| Param | Original file | Final file |
|---|---|---|
| Filename | modeM0/AS1G06_154T03_9000000996_07285cztM0_level2.evt | modeM0/AS1G06_154T03_9000000996_07285cztM0_level2_quad_clean.evt |
| Size (bytes) | 323,236,800 | 53,225,280 |
| Size | 308.3 MB | 50.8 MB |
| Events in quadrant A | 2,325,880 | 314,542 |
| Events in quadrant B | 2,371,521 | 324,208 |
| Events in quadrant C | 2,246,230 | 322,304 |
| Events in quadrant D | 2,508,721 | 303,770 |
| Mode M0 | |||
|---|---|---|---|
| Quadrant | BADHDUFLAG | Total packets | Discarded packets |
| A | 0 | 10370 | 2 |
| B | 0 | 10356 | 2 |
| C | 0 | 10235 | 2 |
| D | 0 | 11004 | 2 |
| Mode SS | |||
|---|---|---|---|
| Quadrant | BADHDUFLAG | Total packets | Discarded packets |
| A | 0 | 102 | 0 |
| B | 0 | 102 | 0 |
| C | 0 | 102 | 0 |
| D | 0 | 102 | 0 |
| Quadrant | Total seconds | Saturated seconds | Saturation percentage |
|---|---|---|---|
| A | 4924 | 194 | 3.939886% |
| B | 4924 | 171 | 3.472786% |
| C | 4924 | 124 | 2.518278% |
| D | 4924 | 219 | 4.447604% |
Noise dominated data is calculated using 1-second bins in cleaned event files. If a bin has >2000 counts, and if more than 50% of those come from <1% of pixels, then it is considered to be noise-dominated and hence unusable.
| Quadrant | # 1 sec bins | Bins with >0 counts | Bins with >2000 counts | High rate bins dominated by noise | Noise dominated (total time) | Noise dominated (detector-on time) | Marked lightcurve |
|---|---|---|---|---|---|---|---|
| A | 5044 | 4924 | 1 | 1 | 0.02% | 0.02% | 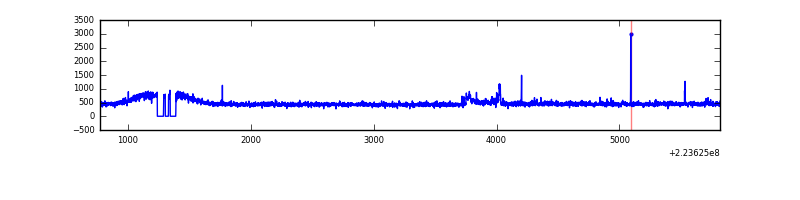 |
| B | 5044 | 4927 | 0 | 0 | 0.00% | 0.00% | 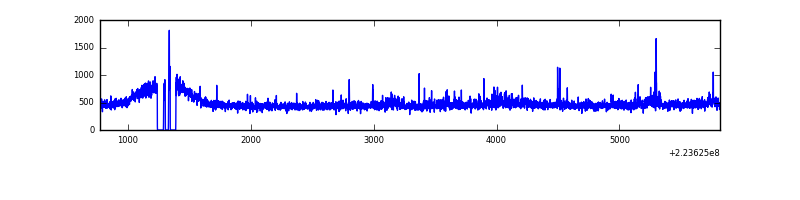 |
| C | 5044 | 4927 | 0 | 0 | 0.00% | 0.00% | 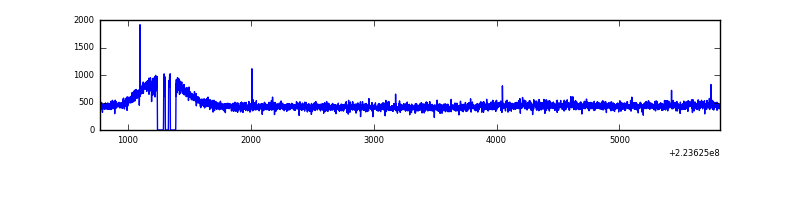 |
| D | 5044 | 4925 | 34 | 34 | 0.67% | 0.69% | 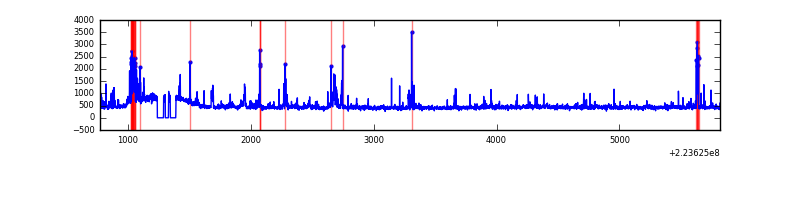 |
Top three noisy pixels from each quadrant. If the there are fewer than three noisy pixels in the level2.evt file, extra rows are filled as -1
| Pixel properties | Quadrant properties | ||||||
|---|---|---|---|---|---|---|---|
| Quadrant | DetID | PixID | Counts | Sigma | Mean | Median | Sigma |
| A | 15 | 239 | 56514 | 454.55 | 586 | 570 | 123.1 |
| A | 8 | 15 | 12496 | 96.9 | 586 | 570 | 123.1 |
| A | 0 | 226 | 5763 | 42.19 | 586 | 570 | 123.1 |
| B | 0 | 214 | 54167 | 465.45 | 587 | 572 | 115.1 |
| B | 4 | 81 | 13361 | 111.07 | 587 | 572 | 115.1 |
| B | 12 | 111 | 11618 | 95.93 | 587 | 572 | 115.1 |
| C | 7 | 247 | 8212 | 56.96 | 571 | 571 | 134.1 |
| C | 1 | 16 | 6999 | 47.92 | 571 | 571 | 134.1 |
| C | 13 | 61 | 4459 | 28.98 | 571 | 571 | 134.1 |
| D | 2 | 216 | 181519 | 1254.62 | 573 | 553 | 144.2 |
| D | 2 | 14 | 110752 | 764.0 | 573 | 553 | 144.2 |
| D | 14 | 34 | 23765 | 160.93 | 573 | 553 | 144.2 |
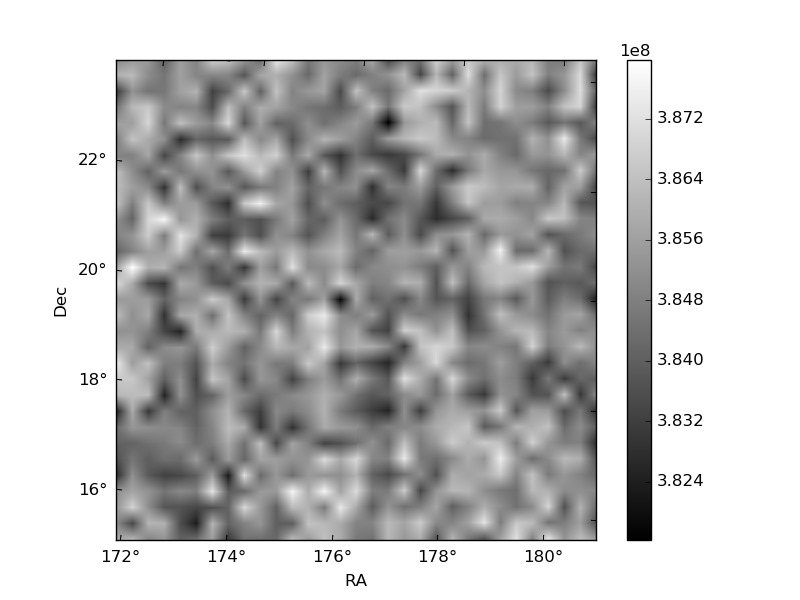
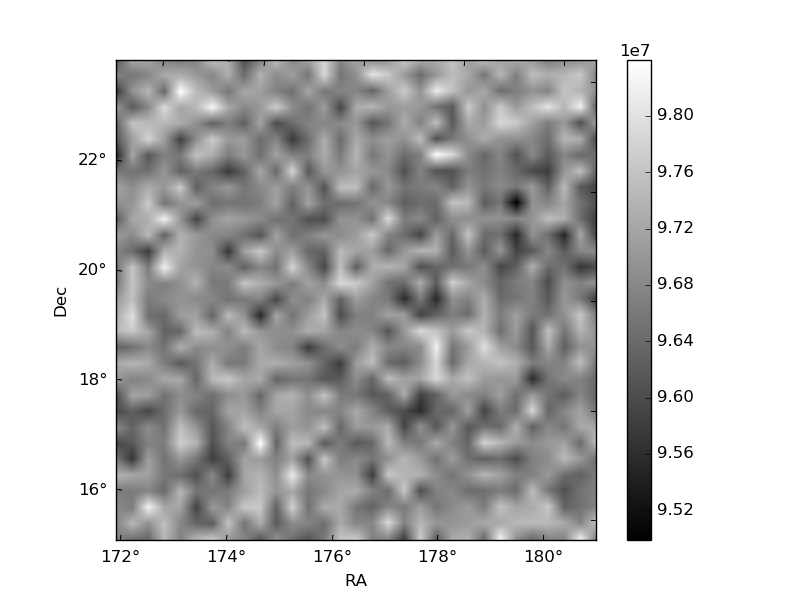
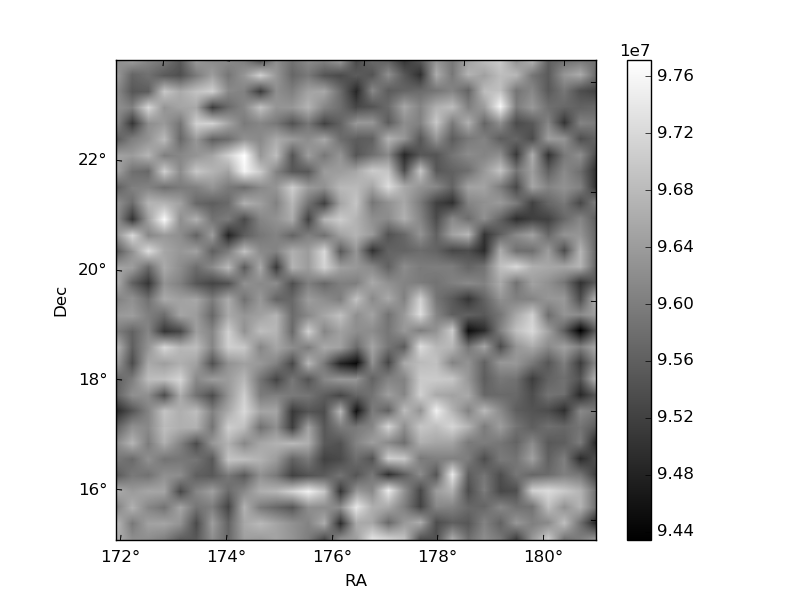
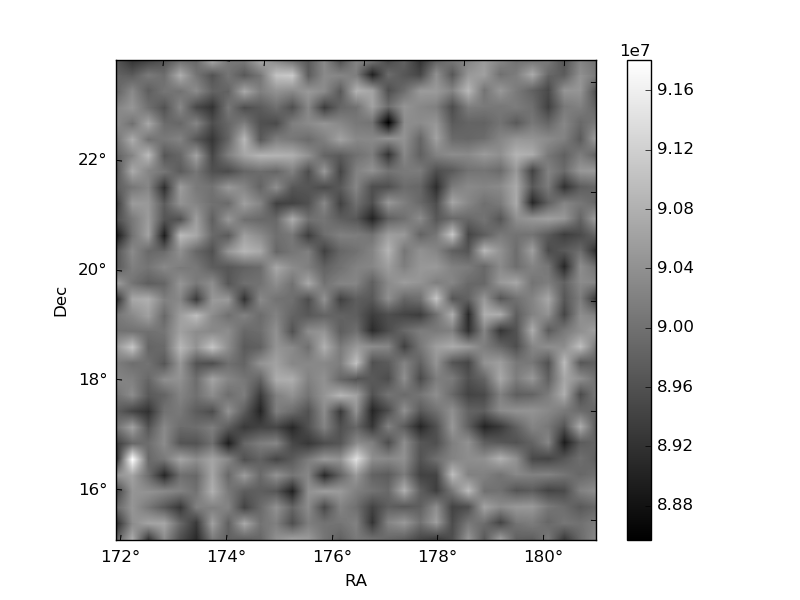
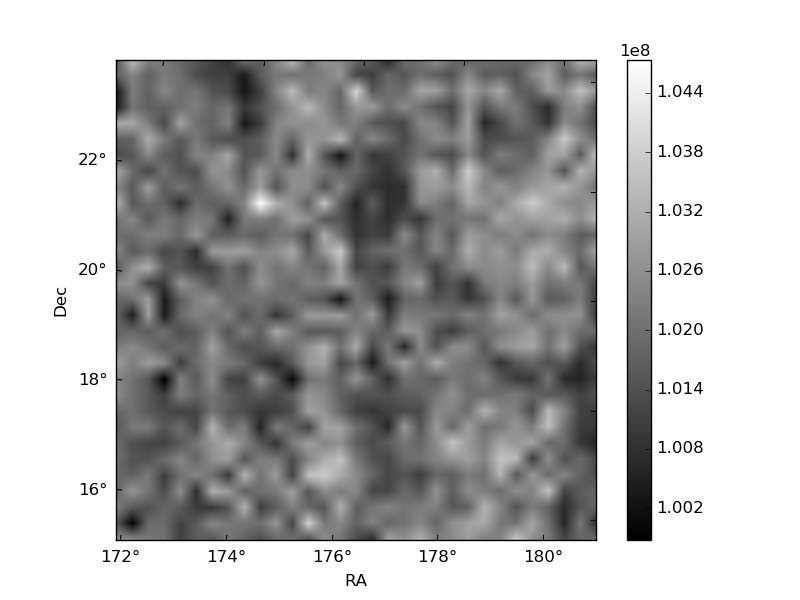
Histogram calculated using DETX and DETY for each event in the final _common_clean file
| Quadrant A | 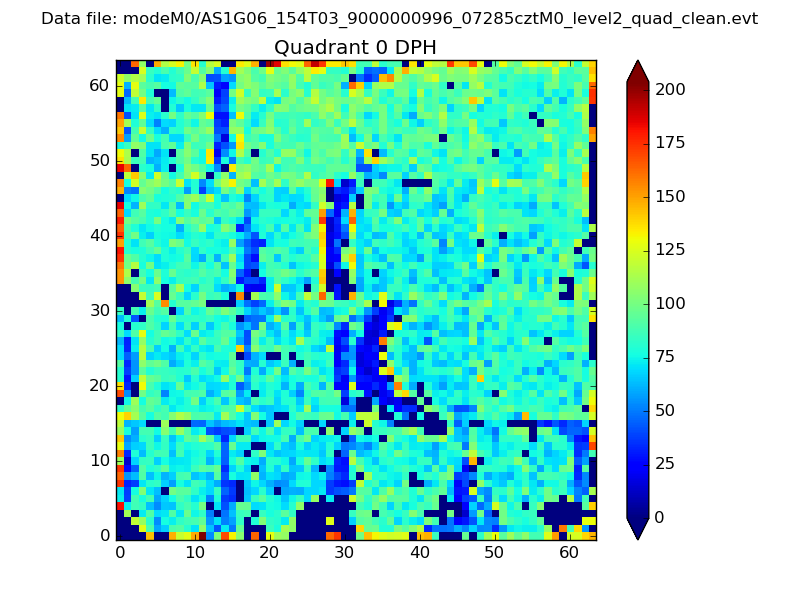 |
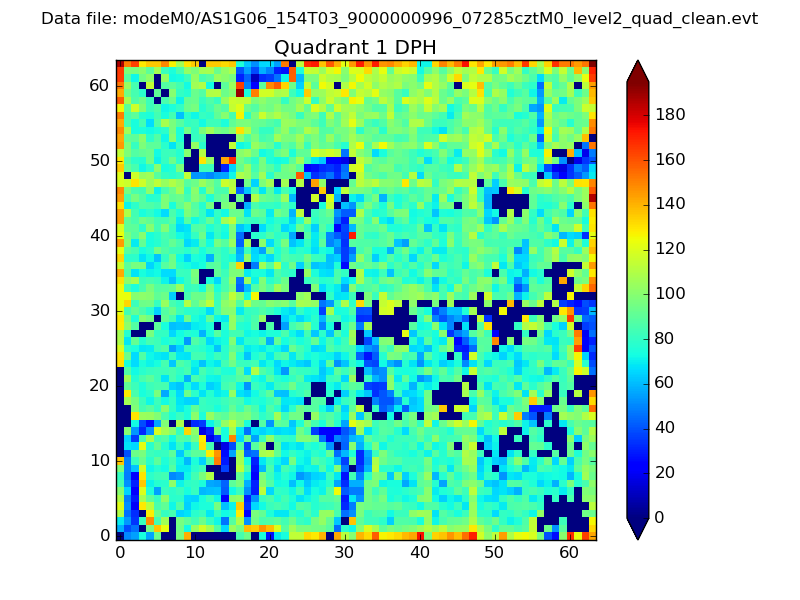 |
Quadrant B |
|---|---|---|---|
| Quadrant D | 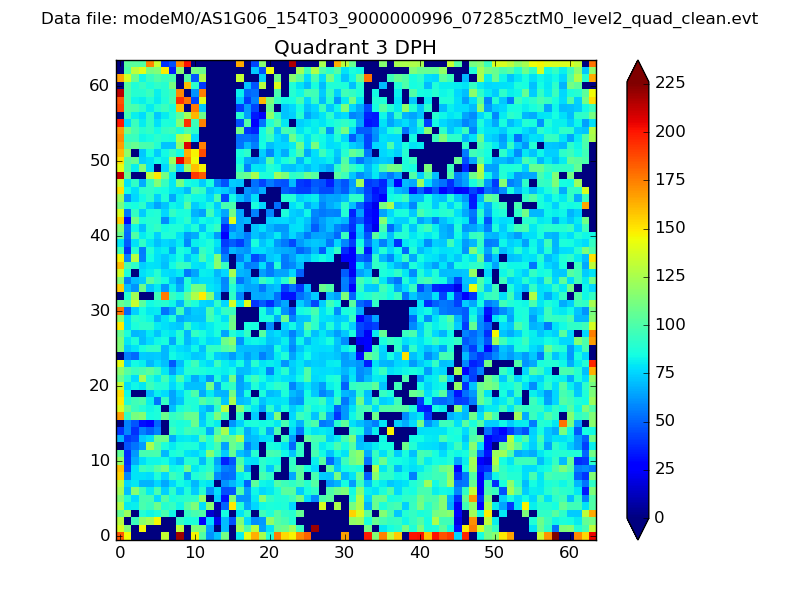 |
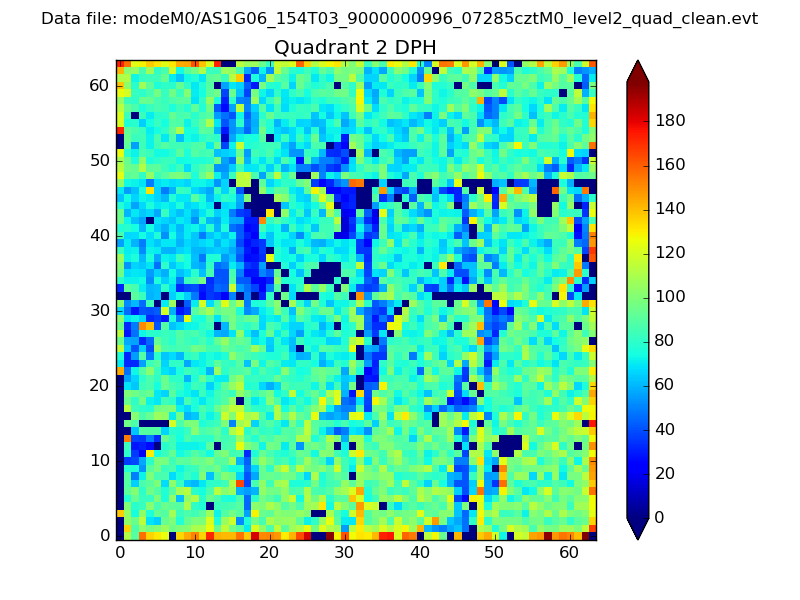 |
Quadrant C |
| Plot type | Count rate plots | Images |
|---|---|---|
| Comparison with Poisson distribution Blue bars denote a histogram of data divided into 1 sec bins. Red curve is a Poisson curve with rate = median count rate of data. |
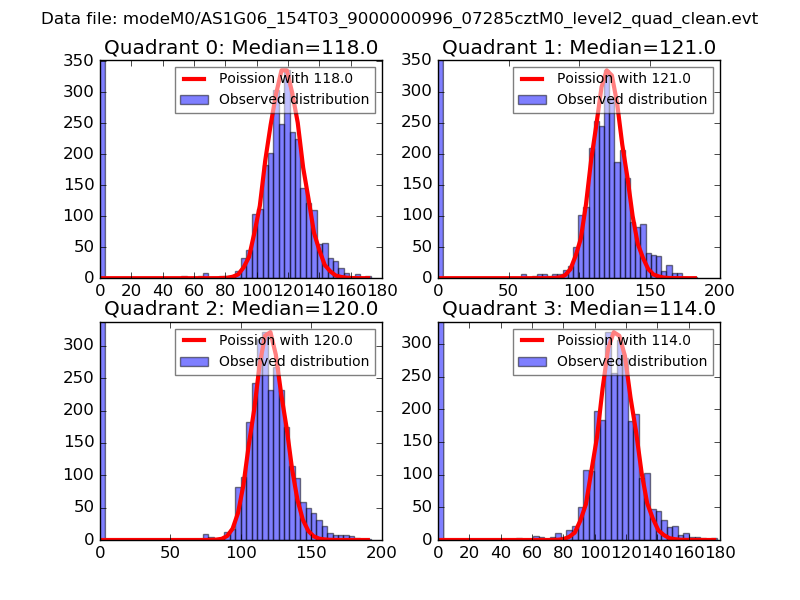 |
 |
| Quadrant-wise count rates Data is divided into 100 sec bins |
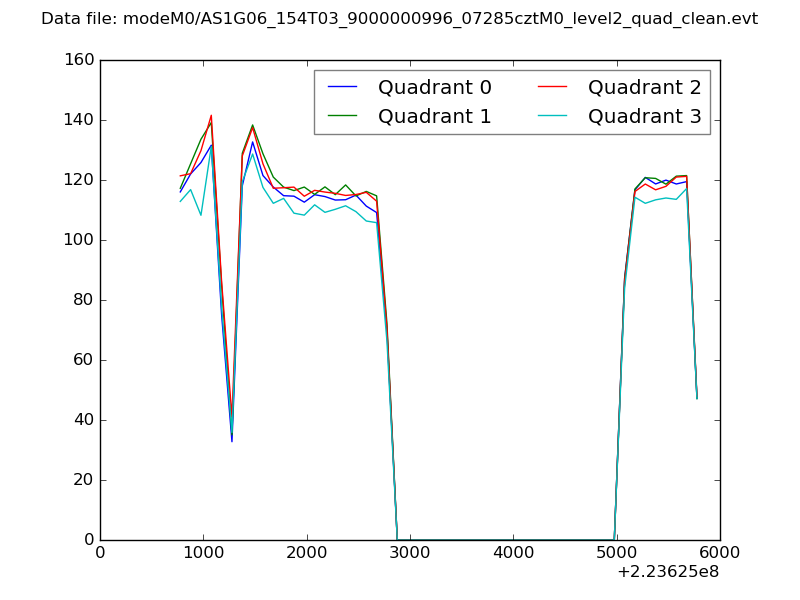 |
|
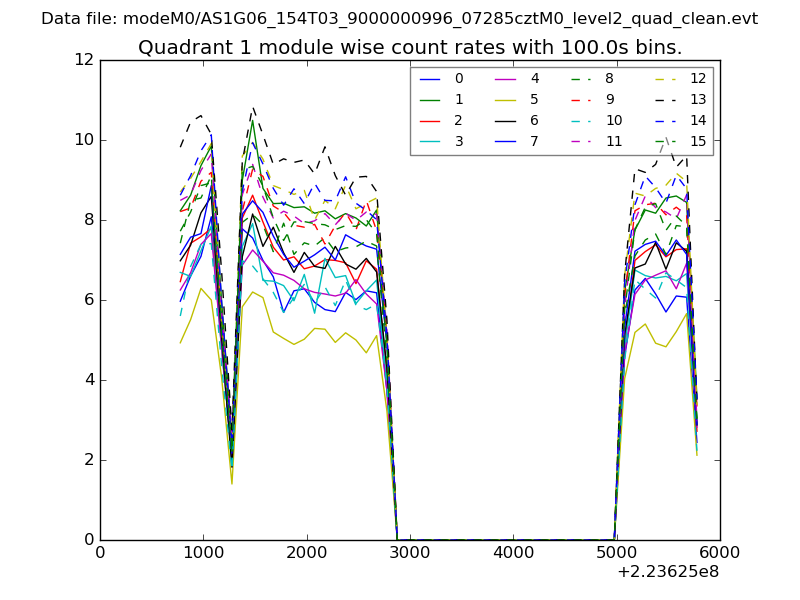
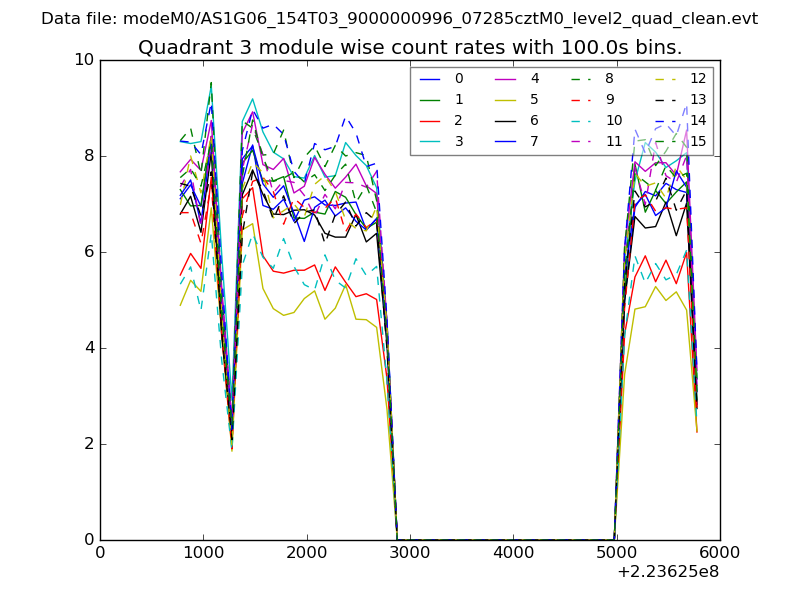
| Module-wise count rates for Quadrant A Data is divided into 100 sec bins |
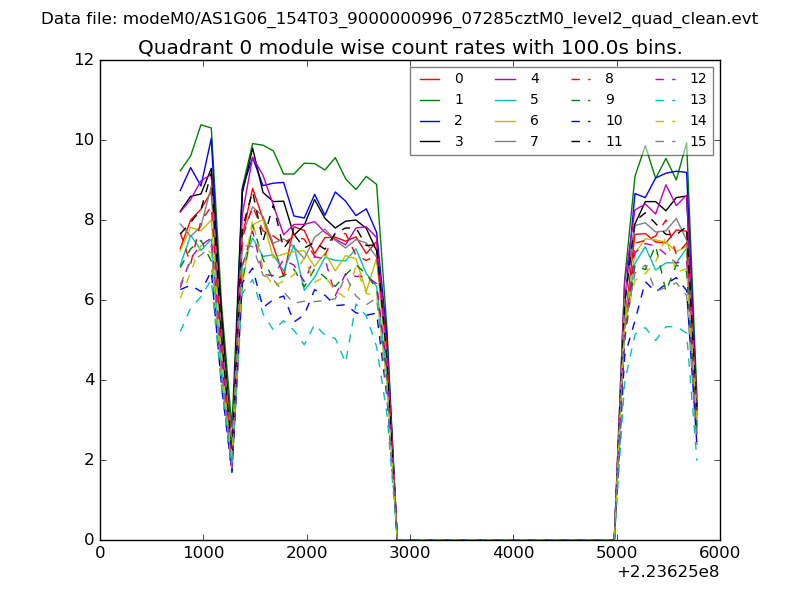 |
 |
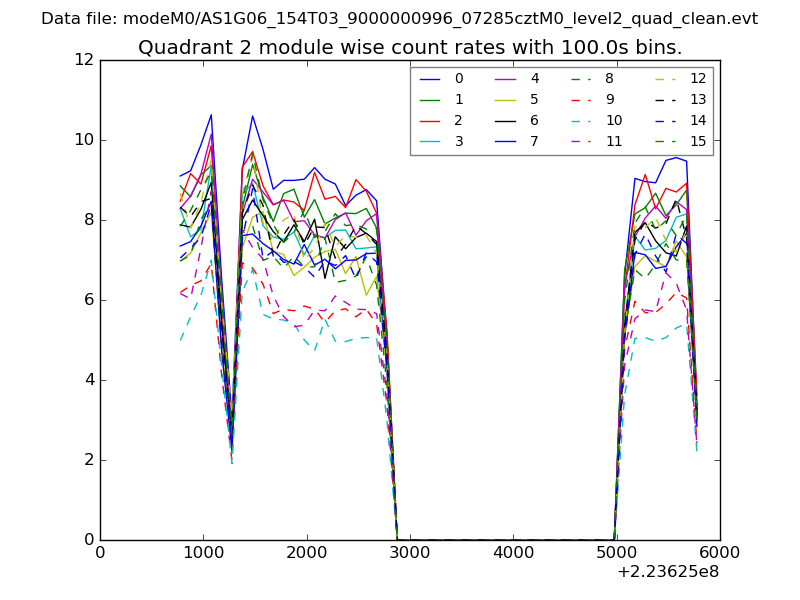
| Module-wise count rates for Quadrant B Data is divided into 100 sec bins |
 |
 |
| Module-wise count rates for Quadrant C Data is divided into 100 sec bins |
 |
 |
| Module-wise count rates for Quadrant D Data is divided into 100 sec bins |
 |
 |
| Parameter | Plot |
|---|---|
| CZT HV Monitor | 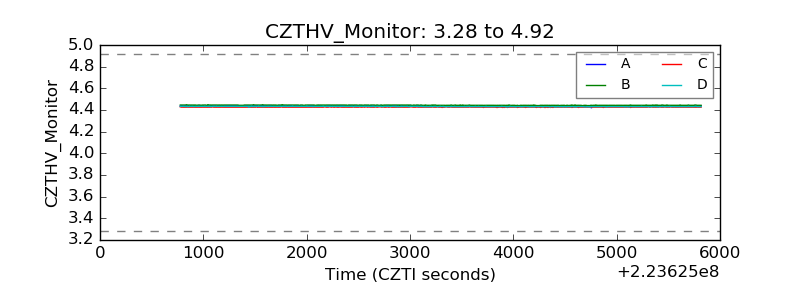 |
| D_VDD | 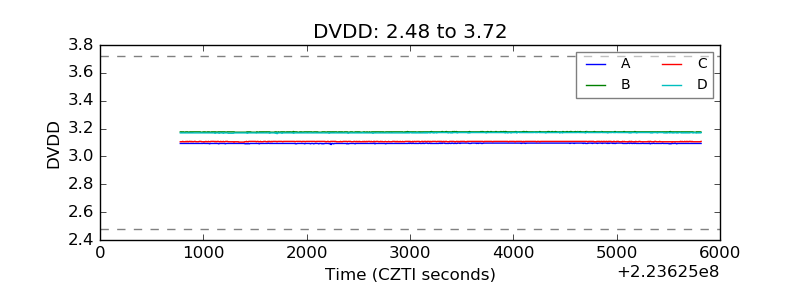 |
| Temperature 1 | 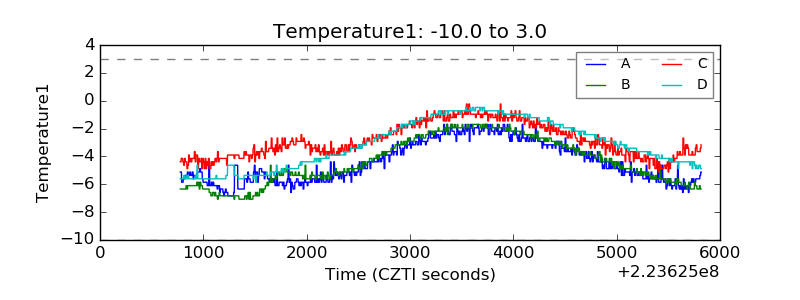 |
| Veto HV Monitor | 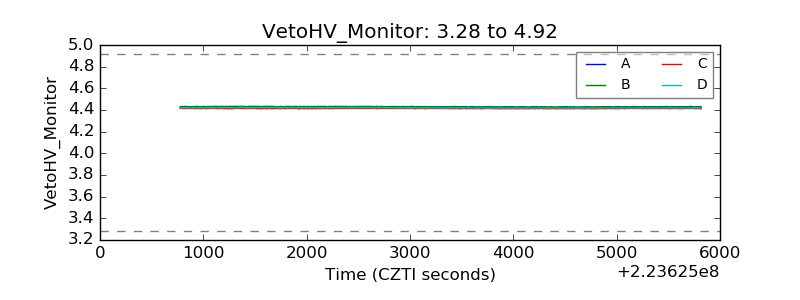 |
| Veto LLD | 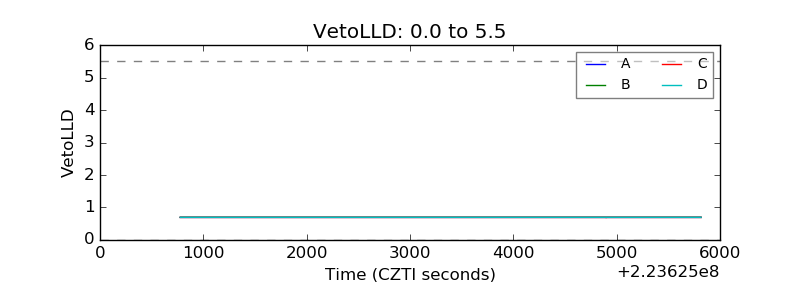 |
| Alpha Counter | 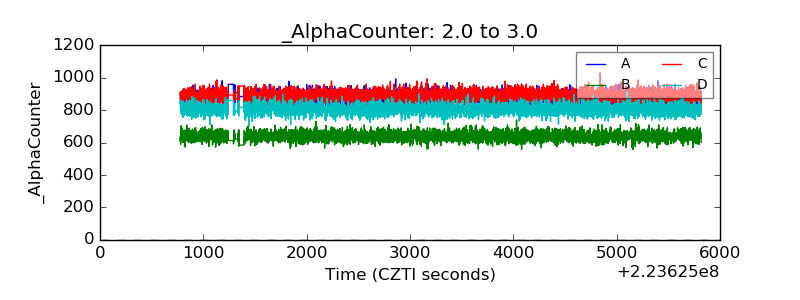 |
| _CPM_Rate | 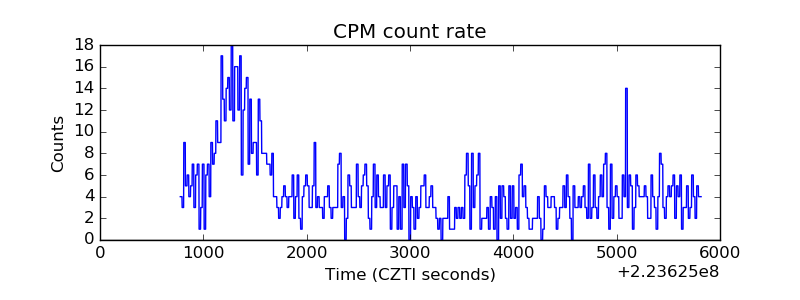 |
| CZT Counter | 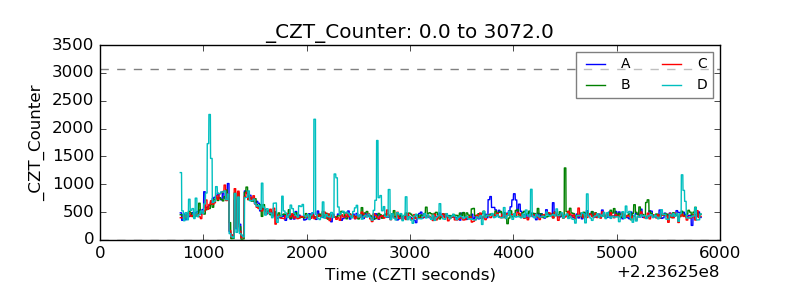 |
| +2.5 Volts monitor | 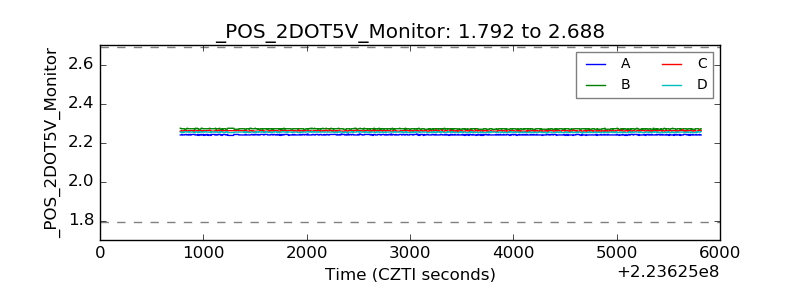 |
| +5 Volts monitor |  |
| _ROLL_ROT | 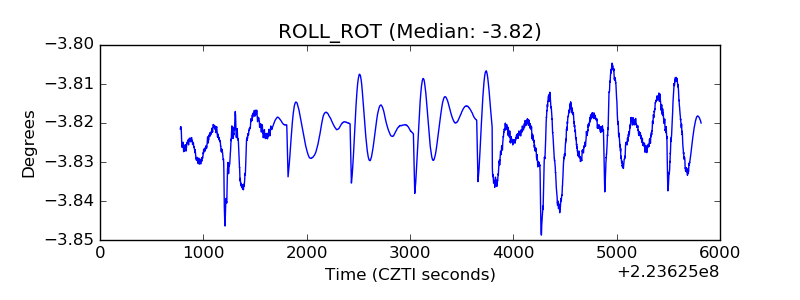 |
| _Roll_DEC | 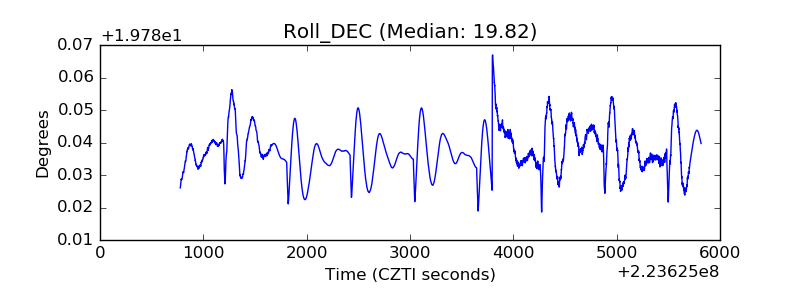 |
| _Roll_RA | 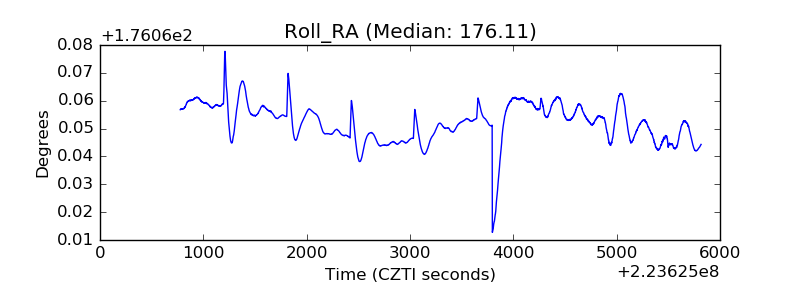 |
| Veto Counter | 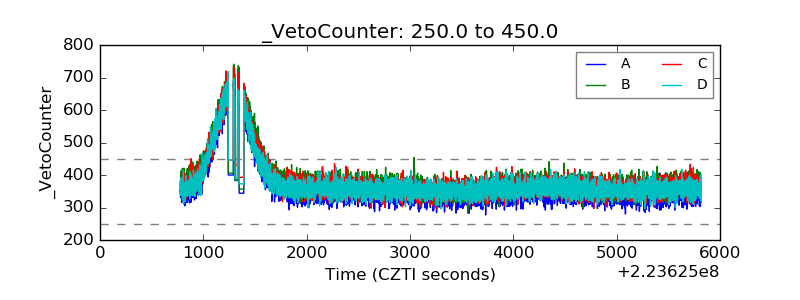 |