| Param | Original file | Final file |
|---|---|---|
| Filename | modeM0/AS1G06_137T01_9000001000_07294cztM0_level2.evt | modeM0/AS1G06_137T01_9000001000_07294cztM0_level2_quad_clean.evt |
| Size (bytes) | 321,834,240 | 77,947,200 |
| Size | 306.9 MB | 74.3 MB |
| Events in quadrant A | 2,333,557 | 502,984 |
| Events in quadrant B | 2,371,504 | 524,712 |
| Events in quadrant C | 2,351,861 | 509,013 |
| Events in quadrant D | 2,356,874 | 481,074 |
| Mode M9 | |||
|---|---|---|---|
| Quadrant | BADHDUFLAG | Total packets | Discarded packets |
| A | 0 | 14 | 0 |
| B | 0 | 14 | 0 |
| C | 0 | 14 | 0 |
| D | 0 | 14 | 0 |
| Mode M0 | |||
|---|---|---|---|
| Quadrant | BADHDUFLAG | Total packets | Discarded packets |
| A | 0 | 10198 | 2 |
| B | 0 | 10329 | 1 |
| C | 0 | 10231 | 1 |
| D | 0 | 10544 | 1 |
| Mode SS | |||
|---|---|---|---|
| Quadrant | BADHDUFLAG | Total packets | Discarded packets |
| A | 0 | 100 | 0 |
| B | 0 | 100 | 0 |
| C | 0 | 100 | 0 |
| D | 0 | 100 | 0 |
| Quadrant | Total seconds | Saturated seconds | Saturation percentage |
|---|---|---|---|
| A | 4881 | 20 | 0.409752% |
| B | 4881 | 20 | 0.409752% |
| C | 4881 | 14 | 0.286826% |
| D | 4881 | 36 | 0.737554% |
Noise dominated data is calculated using 1-second bins in cleaned event files. If a bin has >2000 counts, and if more than 50% of those come from <1% of pixels, then it is considered to be noise-dominated and hence unusable.
| Quadrant | # 1 sec bins | Bins with >0 counts | Bins with >2000 counts | High rate bins dominated by noise | Noise dominated (total time) | Noise dominated (detector-on time) | Marked lightcurve |
|---|---|---|---|---|---|---|---|
| A | 6236 | 4882 | 4 | 4 | 0.06% | 0.08% | 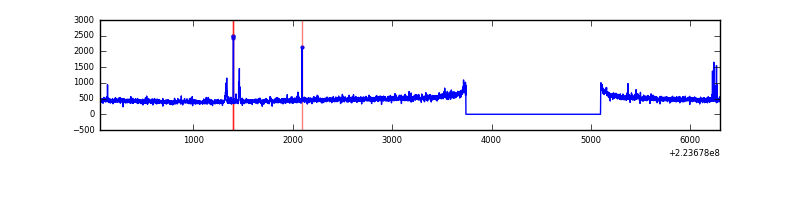 |
| B | 6236 | 4882 | 2 | 2 | 0.03% | 0.04% | 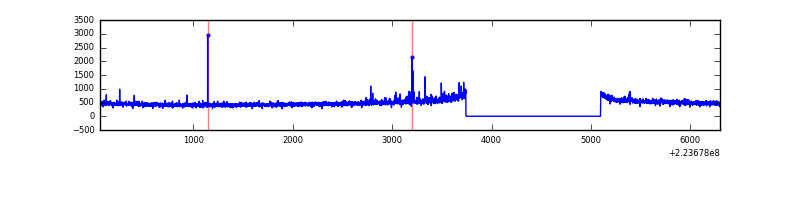 |
| C | 6236 | 4882 | 1 | 1 | 0.02% | 0.02% | 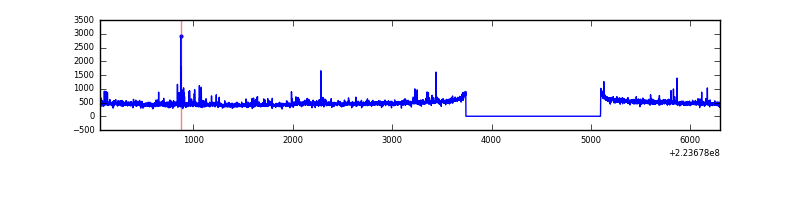 |
| D | 6236 | 4882 | 26 | 26 | 0.42% | 0.53% | 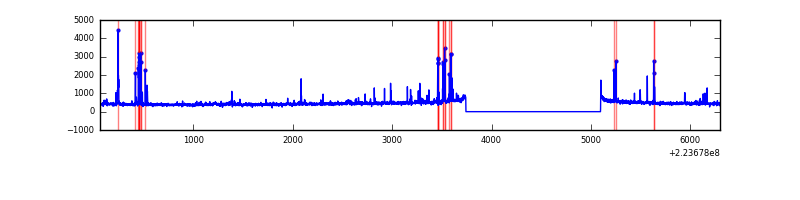 |
Top three noisy pixels from each quadrant. If the there are fewer than three noisy pixels in the level2.evt file, extra rows are filled as -1
| Pixel properties | Quadrant properties | ||||||
|---|---|---|---|---|---|---|---|
| Quadrant | DetID | PixID | Counts | Sigma | Mean | Median | Sigma |
| A | 8 | 15 | 48231 | 400.88 | 582 | 570 | 118.9 |
| A | 15 | 234 | 34849 | 288.32 | 582 | 570 | 118.9 |
| A | 15 | 239 | 8692 | 68.31 | 582 | 570 | 118.9 |
| B | 0 | 214 | 52783 | 458.42 | 596 | 582 | 113.9 |
| B | 12 | 111 | 11384 | 94.86 | 596 | 582 | 113.9 |
| B | 11 | 111 | 9051 | 74.37 | 596 | 582 | 113.9 |
| C | 1 | 16 | 51120 | 381.56 | 571 | 576 | 132.5 |
| C | 7 | 247 | 37598 | 279.48 | 571 | 576 | 132.5 |
| C | 9 | 68 | 34513 | 256.19 | 571 | 576 | 132.5 |
| D | 14 | 34 | 94601 | 681.5 | 563 | 546 | 138.0 |
| D | 2 | 14 | 89178 | 642.2 | 563 | 546 | 138.0 |
| D | 12 | 233 | 12581 | 87.2 | 563 | 546 | 138.0 |
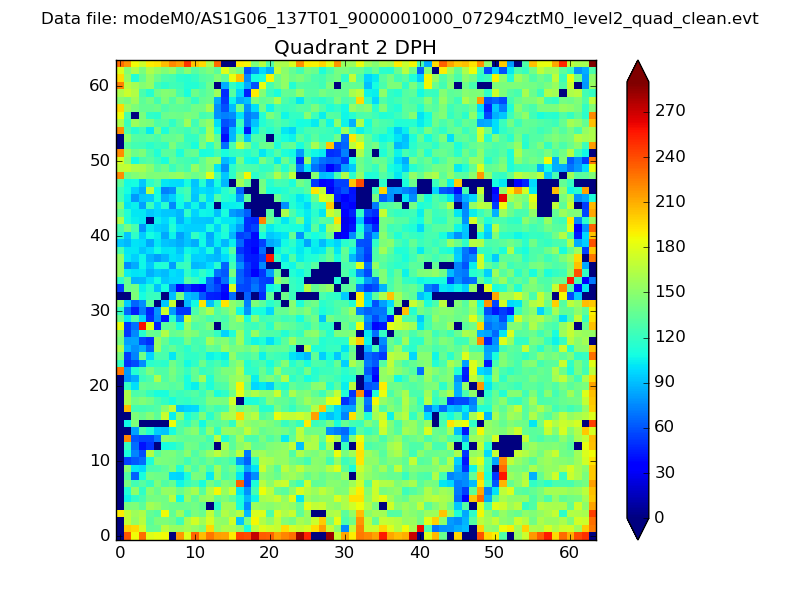
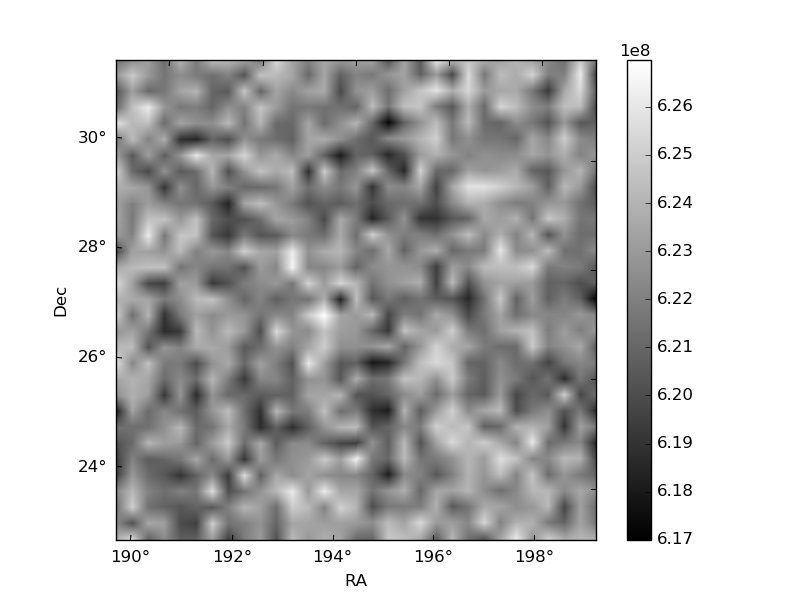
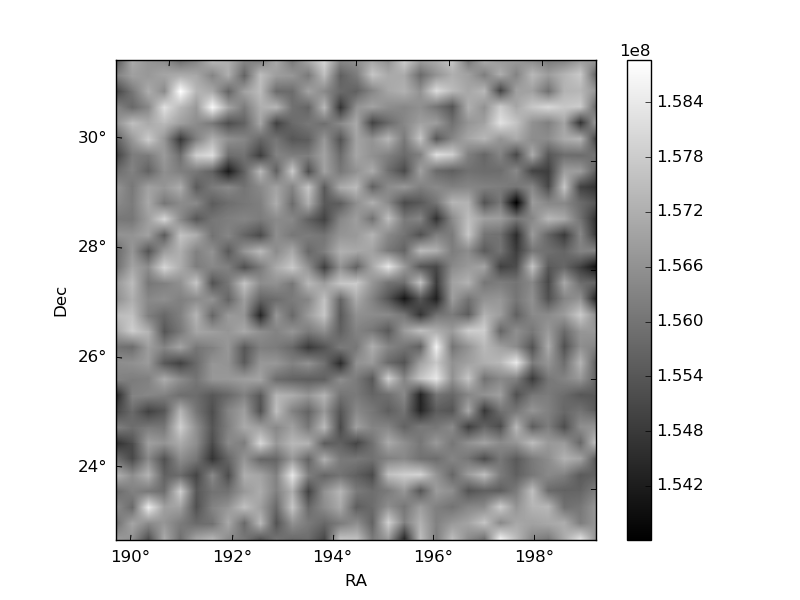
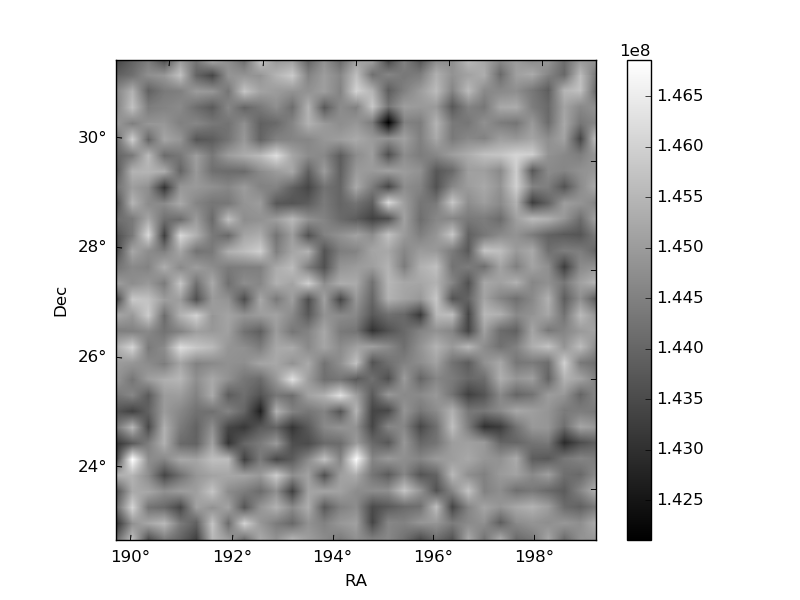
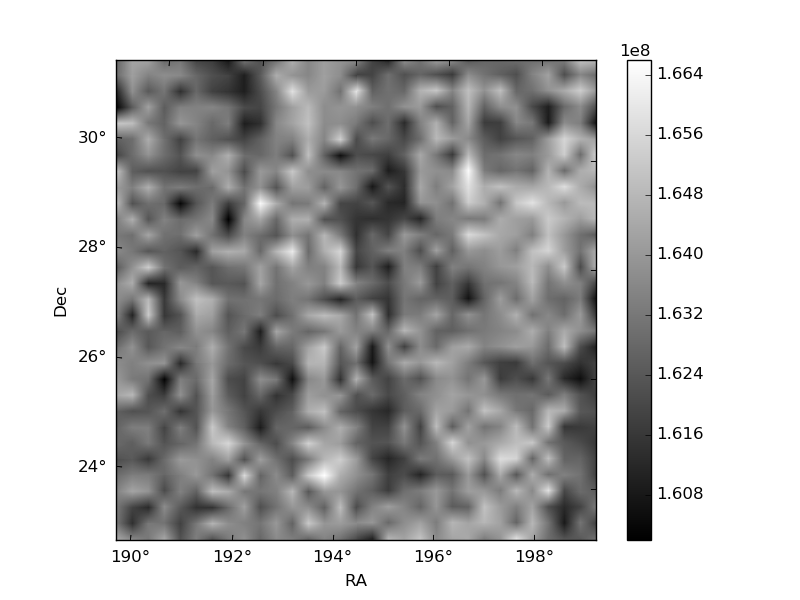
Histogram calculated using DETX and DETY for each event in the final _common_clean file
| Quadrant A | 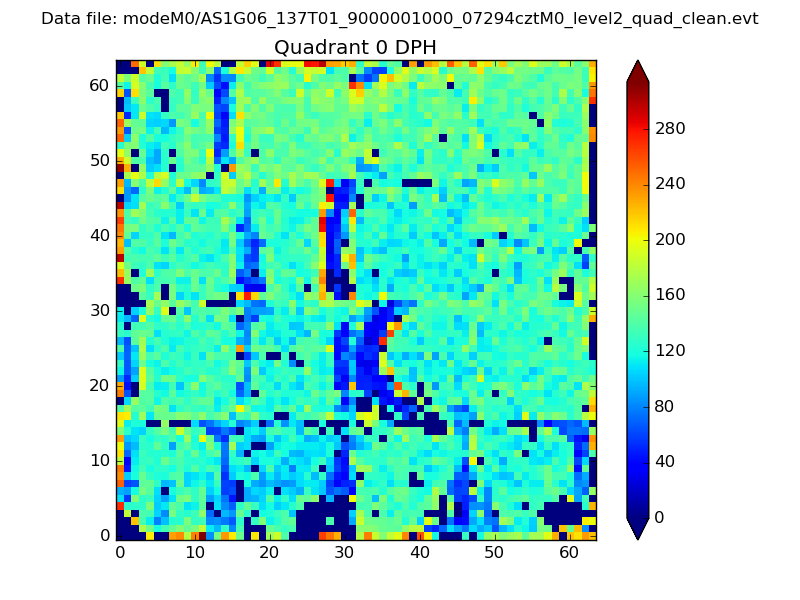 |
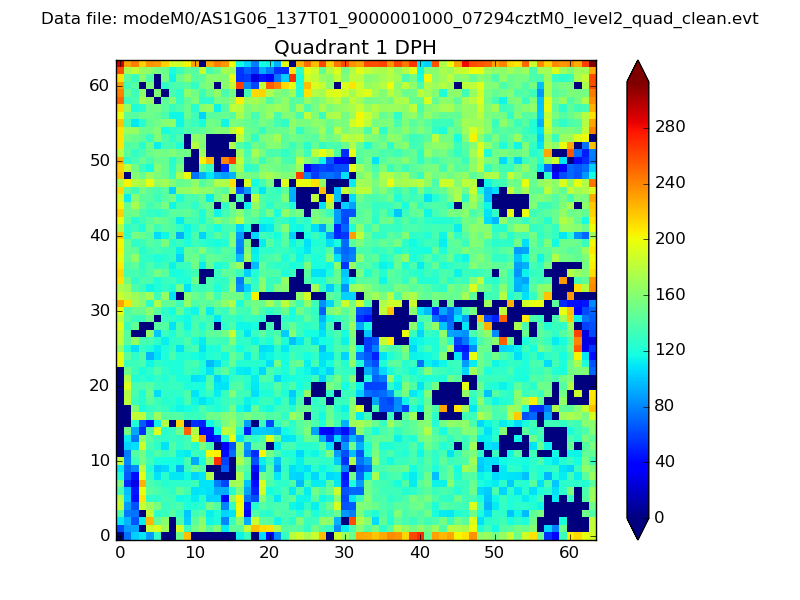 |
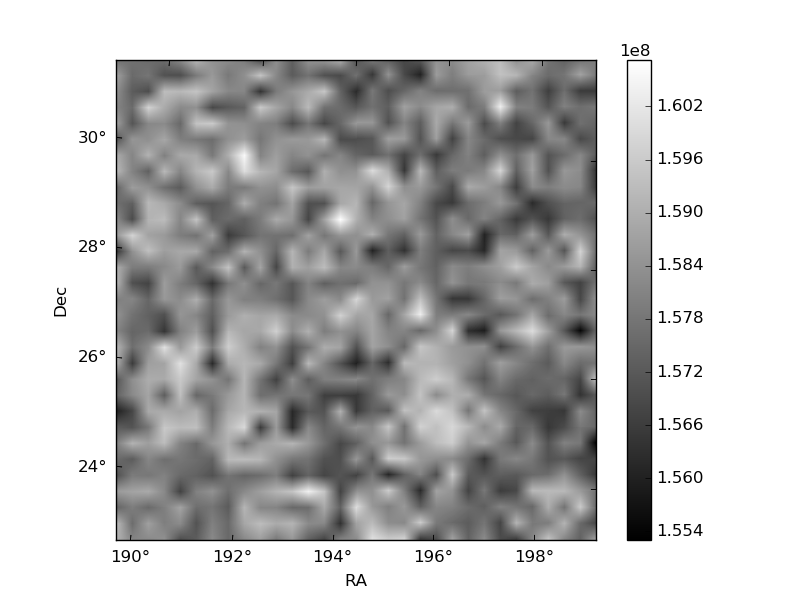
Quadrant B |
|---|---|---|---|
| Quadrant D | 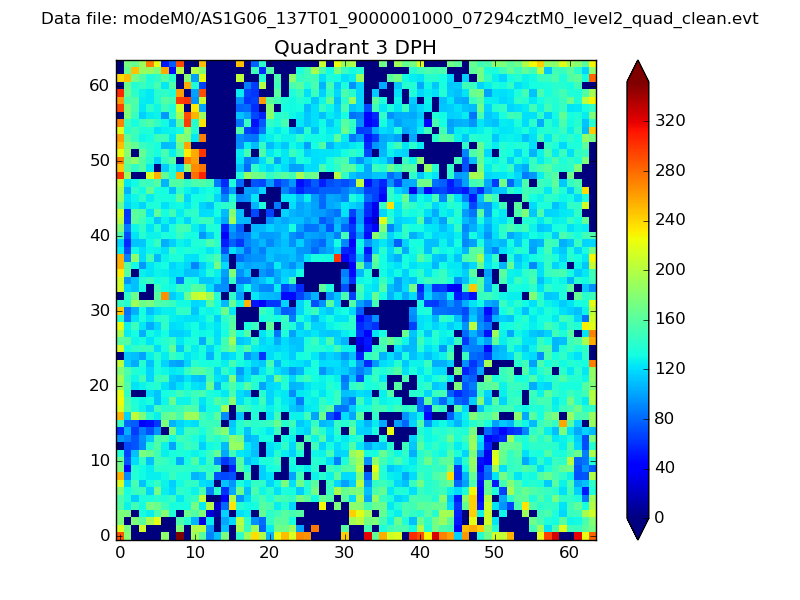 |
 |
Quadrant C |
| Plot type | Count rate plots | Images |
|---|---|---|
| Comparison with Poisson distribution Blue bars denote a histogram of data divided into 1 sec bins. Red curve is a Poisson curve with rate = median count rate of data. |
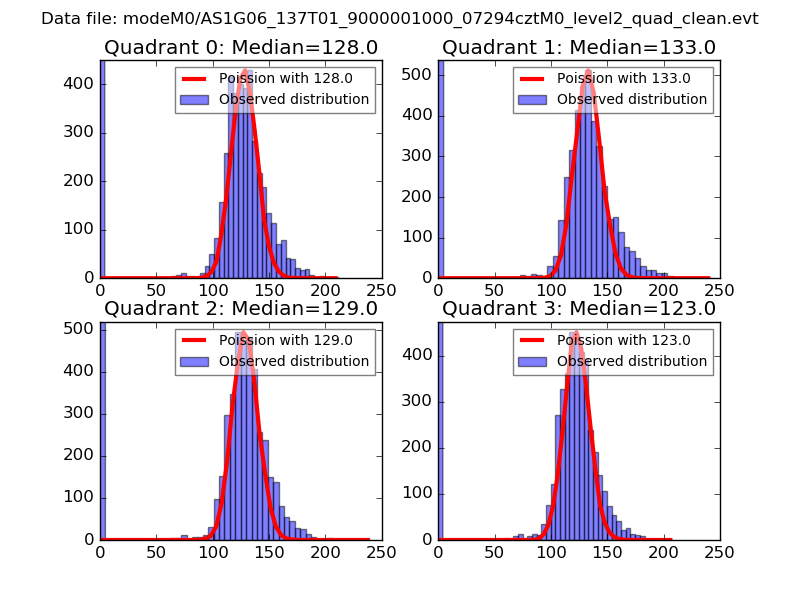 |
 |
| Quadrant-wise count rates Data is divided into 100 sec bins |
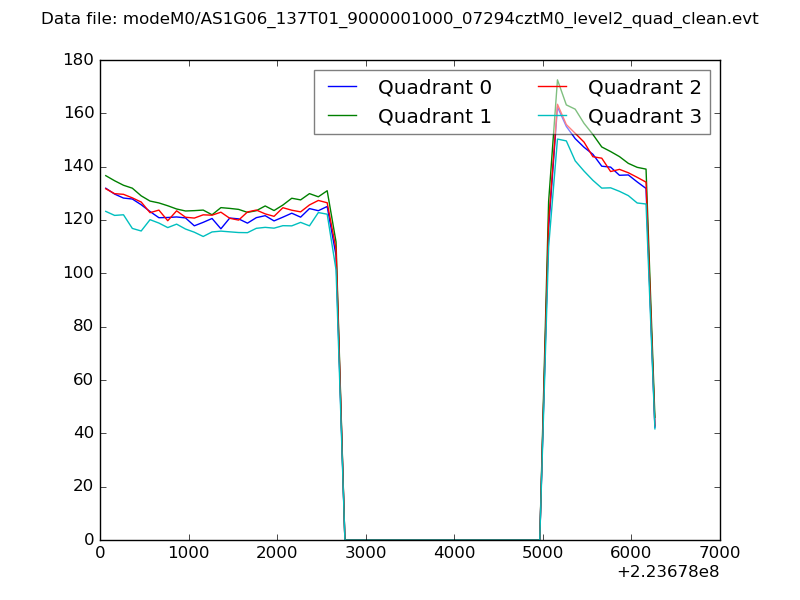 |
|
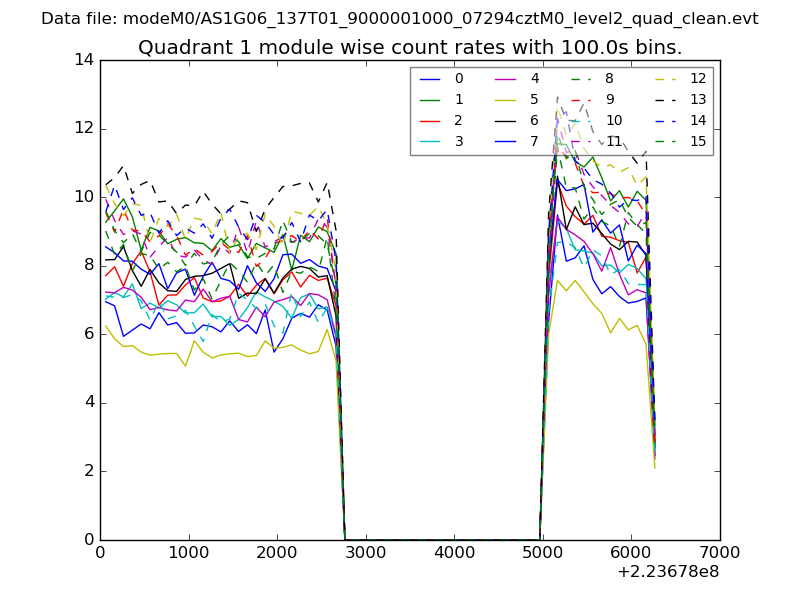
| Module-wise count rates for Quadrant A Data is divided into 100 sec bins |
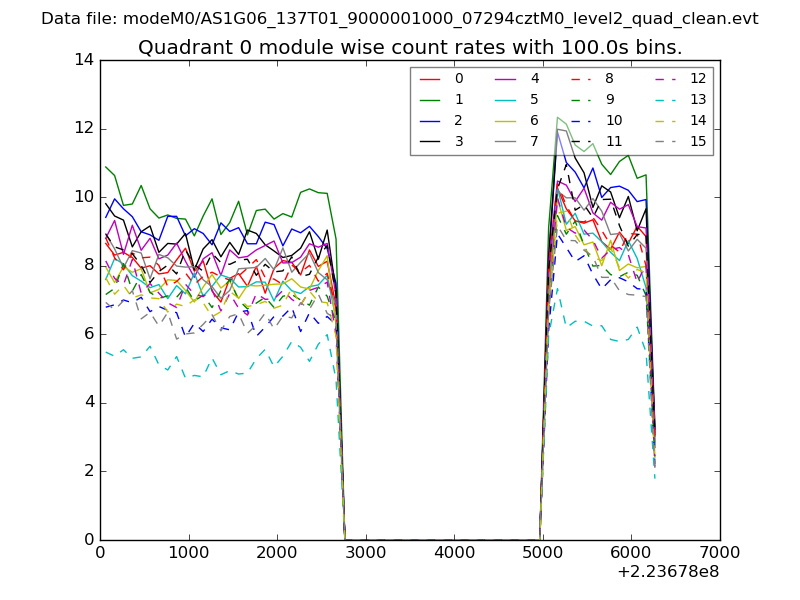 |
 |
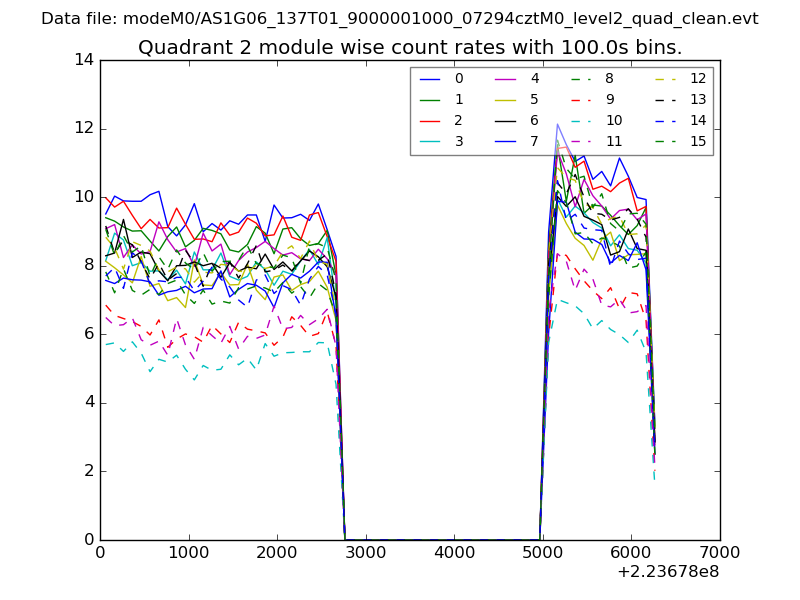
| Module-wise count rates for Quadrant B Data is divided into 100 sec bins |
 |
 |
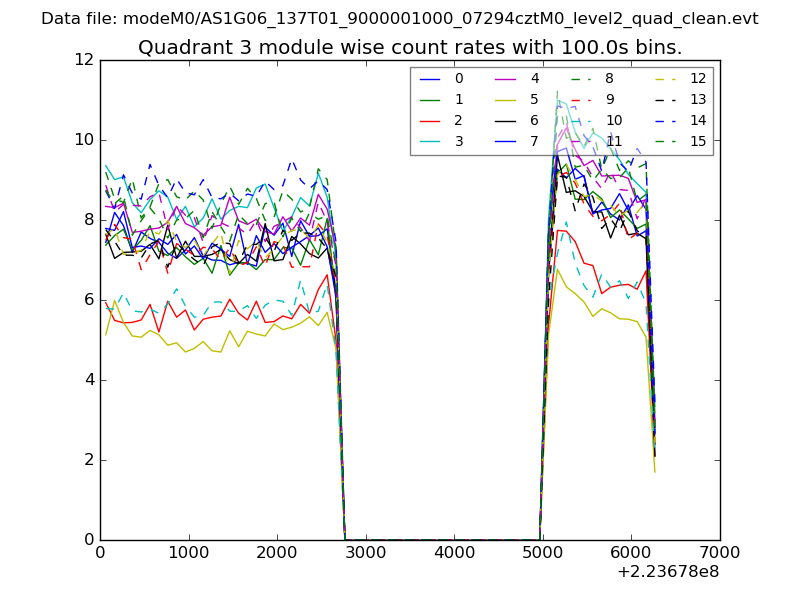
| Module-wise count rates for Quadrant C Data is divided into 100 sec bins |
 |
 |
| Module-wise count rates for Quadrant D Data is divided into 100 sec bins |
 |
 |
| Parameter | Plot |
|---|---|
| CZT HV Monitor | 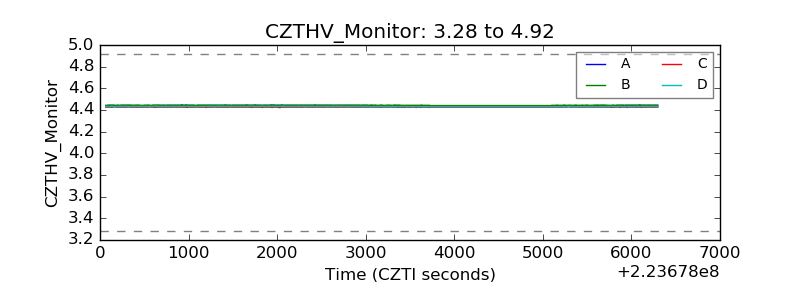 |
| D_VDD | 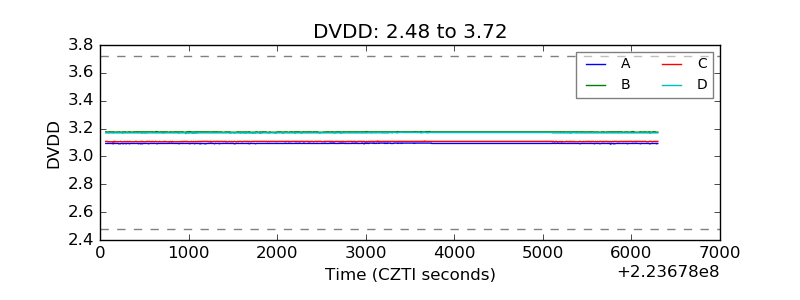 |
| Temperature 1 | 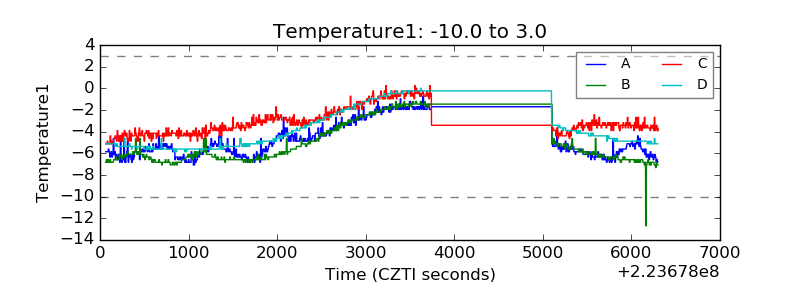 |
| Veto HV Monitor | 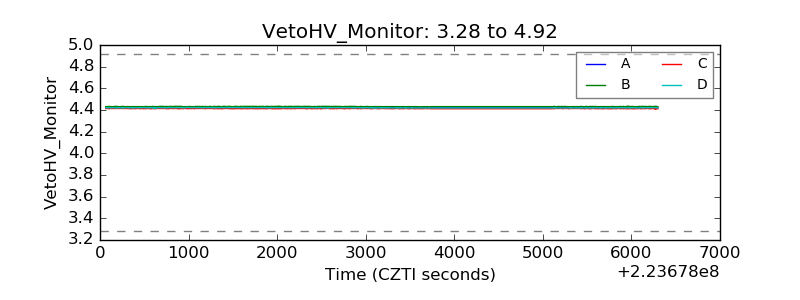 |
| Veto LLD | 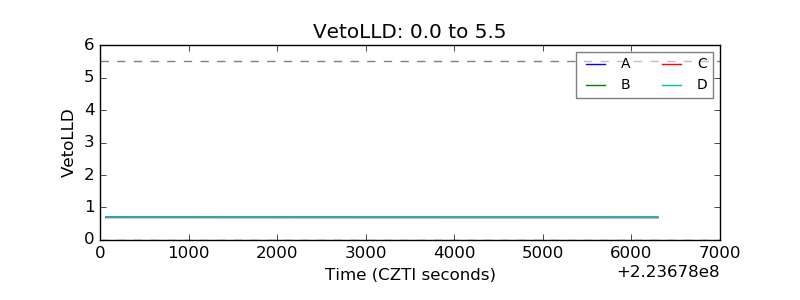 |
| Alpha Counter | 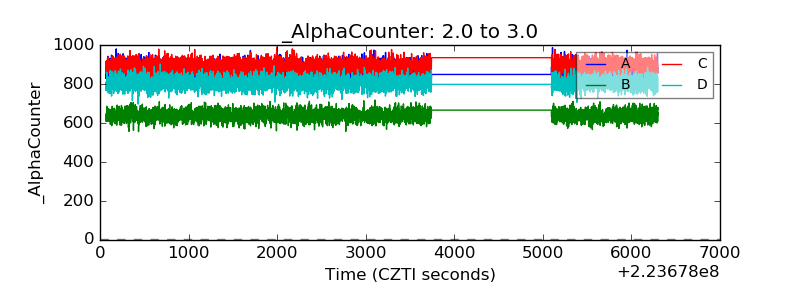 |
| _CPM_Rate | 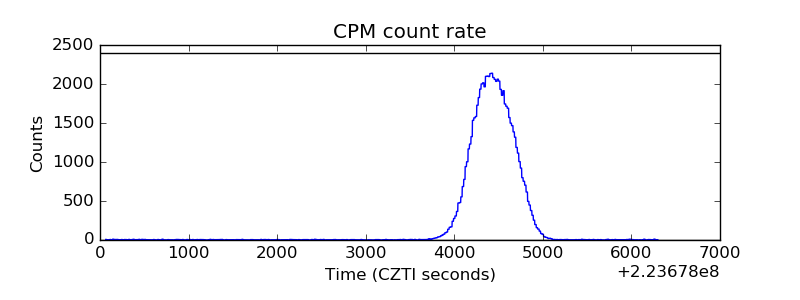 |
| CZT Counter | 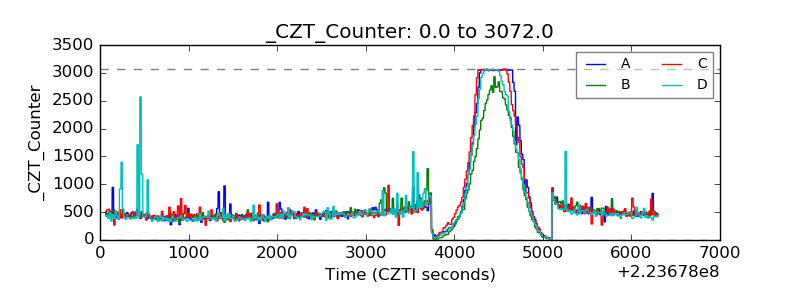 |
| +2.5 Volts monitor |  |
| +5 Volts monitor |  |
| _ROLL_ROT | 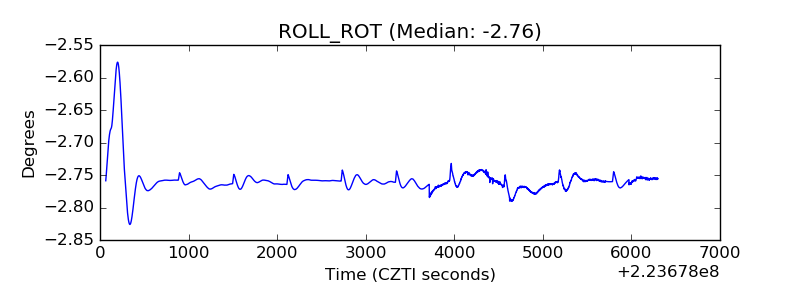 |
| _Roll_DEC | 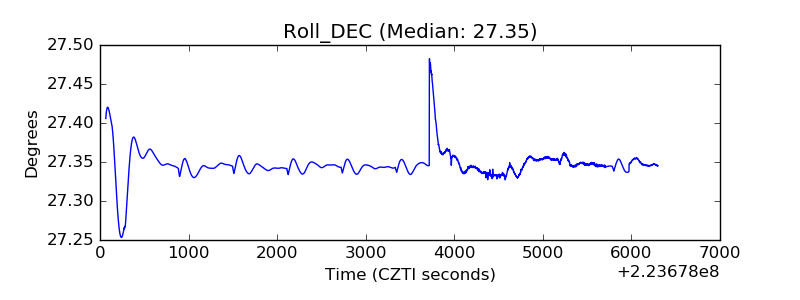 |
| _Roll_RA | 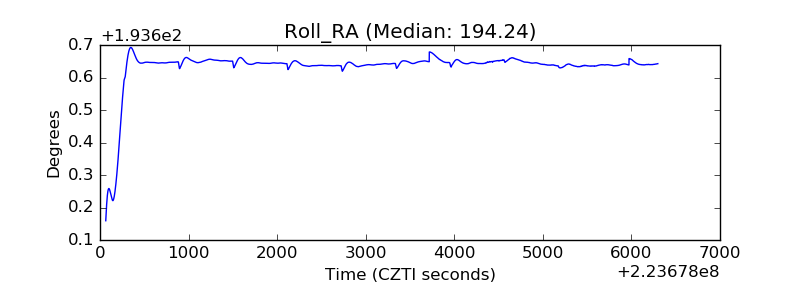 |
| Veto Counter | 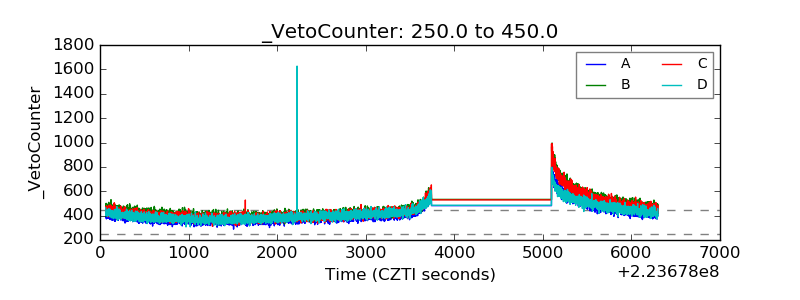 |