| Param | Original file | Final file |
|---|---|---|
| Filename | modeM0/AS1G06_137T01_9000001000_07295cztM0_level2.evt | modeM0/AS1G06_137T01_9000001000_07295cztM0_level2_quad_clean.evt |
| Size (bytes) | 417,283,200 | 95,472,000 |
| Size | 398.0 MB | 91.0 MB |
| Events in quadrant A | 3,129,845 | 614,305 |
| Events in quadrant B | 3,001,513 | 645,060 |
| Events in quadrant C | 2,977,620 | 623,307 |
| Events in quadrant D | 3,115,861 | 584,937 |
| Mode M9 | |||
|---|---|---|---|
| Quadrant | BADHDUFLAG | Total packets | Discarded packets |
| A | 0 | 22 | 0 |
| B | 0 | 22 | 0 |
| C | 0 | 22 | 0 |
| D | 0 | 23 | 0 |
| Mode M0 | |||
|---|---|---|---|
| Quadrant | BADHDUFLAG | Total packets | Discarded packets |
| A | 0 | 13311 | 3 |
| B | 0 | 12961 | 2 |
| C | 0 | 12840 | 2 |
| D | 0 | 13560 | 2 |
| Mode SS | |||
|---|---|---|---|
| Quadrant | BADHDUFLAG | Total packets | Discarded packets |
| A | 0 | 122 | 0 |
| B | 0 | 122 | 0 |
| C | 0 | 122 | 0 |
| D | 0 | 122 | 0 |
| Quadrant | Total seconds | Saturated seconds | Saturation percentage |
|---|---|---|---|
| A | 6073 | 41 | 0.675119% |
| B | 6073 | 35 | 0.576321% |
| C | 6073 | 21 | 0.345793% |
| D | 6073 | 52 | 0.856249% |
Noise dominated data is calculated using 1-second bins in cleaned event files. If a bin has >2000 counts, and if more than 50% of those come from <1% of pixels, then it is considered to be noise-dominated and hence unusable.
| Quadrant | # 1 sec bins | Bins with >0 counts | Bins with >2000 counts | High rate bins dominated by noise | Noise dominated (total time) | Noise dominated (detector-on time) | Marked lightcurve |
|---|---|---|---|---|---|---|---|
| A | 7433 | 6074 | 7 | 7 | 0.09% | 0.12% | 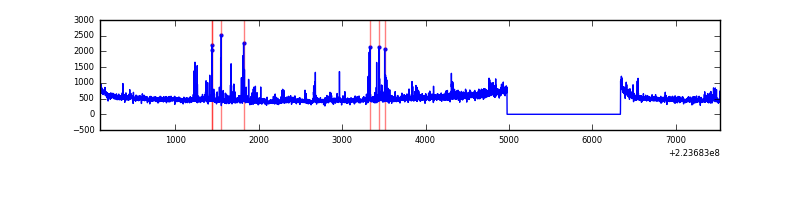 |
| B | 7433 | 6074 | 1 | 1 | 0.01% | 0.02% | 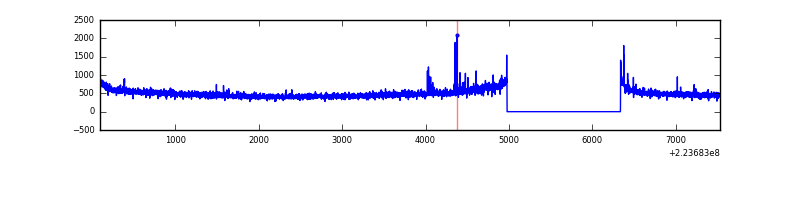 |
| C | 7433 | 6074 | 3 | 3 | 0.04% | 0.05% | 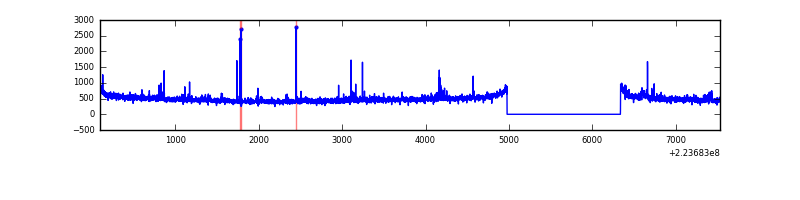 |
| D | 7433 | 6074 | 46 | 46 | 0.62% | 0.76% | 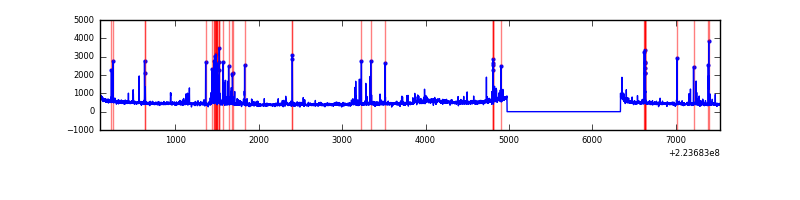 |
Top three noisy pixels from each quadrant. If the there are fewer than three noisy pixels in the level2.evt file, extra rows are filled as -1
| Pixel properties | Quadrant properties | ||||||
|---|---|---|---|---|---|---|---|
| Quadrant | DetID | PixID | Counts | Sigma | Mean | Median | Sigma |
| A | 8 | 15 | 291699 | 1942.48 | 735 | 720 | 149.8 |
| A | 0 | 226 | 7041 | 42.2 | 735 | 720 | 149.8 |
| A | 15 | 239 | 6766 | 40.36 | 735 | 720 | 149.8 |
| B | 0 | 214 | 43157 | 300.24 | 755 | 738 | 141.3 |
| B | 4 | 81 | 20072 | 136.84 | 755 | 738 | 141.3 |
| B | 12 | 111 | 14388 | 96.61 | 755 | 738 | 141.3 |
| C | 9 | 68 | 74010 | 436.59 | 724 | 729 | 167.8 |
| C | 1 | 16 | 69776 | 411.36 | 724 | 729 | 167.8 |
| C | 12 | 4 | 5753 | 29.93 | 724 | 729 | 167.8 |
| D | 2 | 14 | 247816 | 1409.65 | 712 | 690 | 175.3 |
| D | 14 | 34 | 55785 | 314.27 | 712 | 690 | 175.3 |
| D | 12 | 173 | 49773 | 279.98 | 712 | 690 | 175.3 |
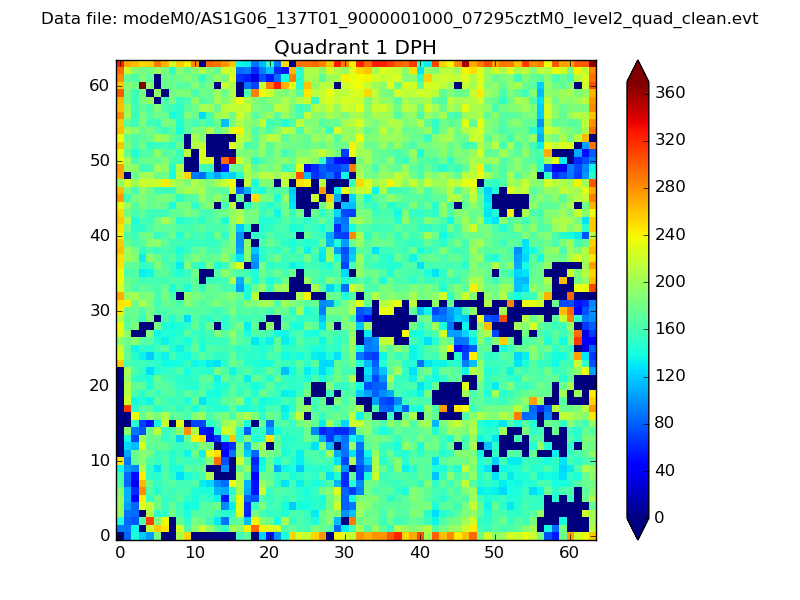
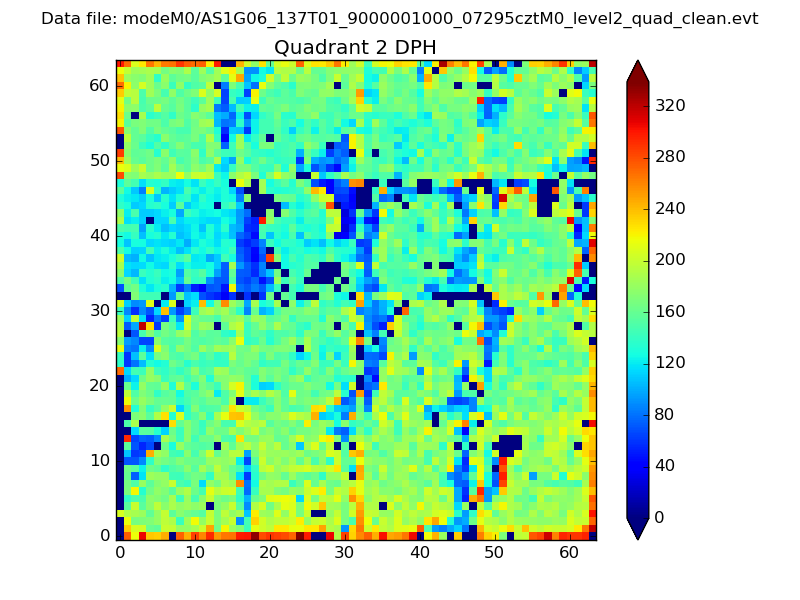
Histogram calculated using DETX and DETY for each event in the final _common_clean file
| Quadrant A |  |
 |
Quadrant B |
|---|---|---|---|
| Quadrant D |  |
 |
Quadrant C |
| Plot type | Count rate plots | Images |
|---|---|---|
| Comparison with Poisson distribution Blue bars denote a histogram of data divided into 1 sec bins. Red curve is a Poisson curve with rate = median count rate of data. |
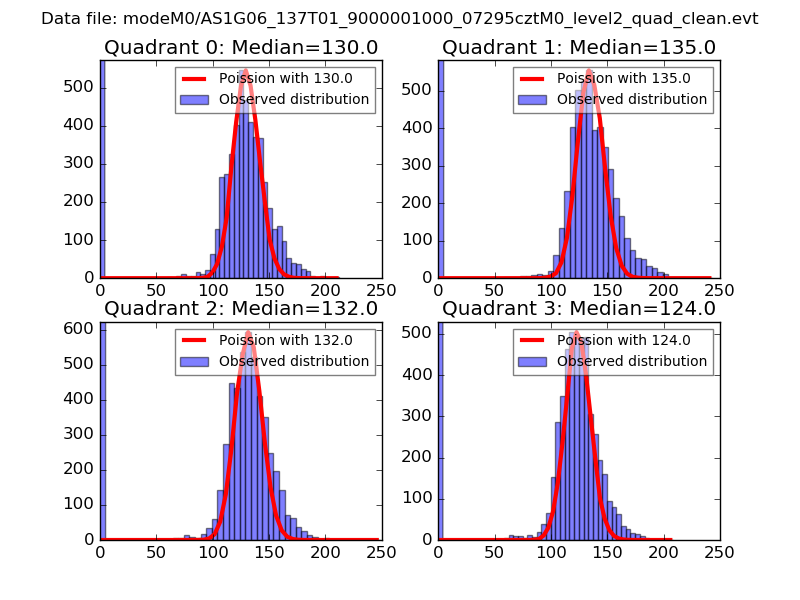 |
 |
| Quadrant-wise count rates Data is divided into 100 sec bins |
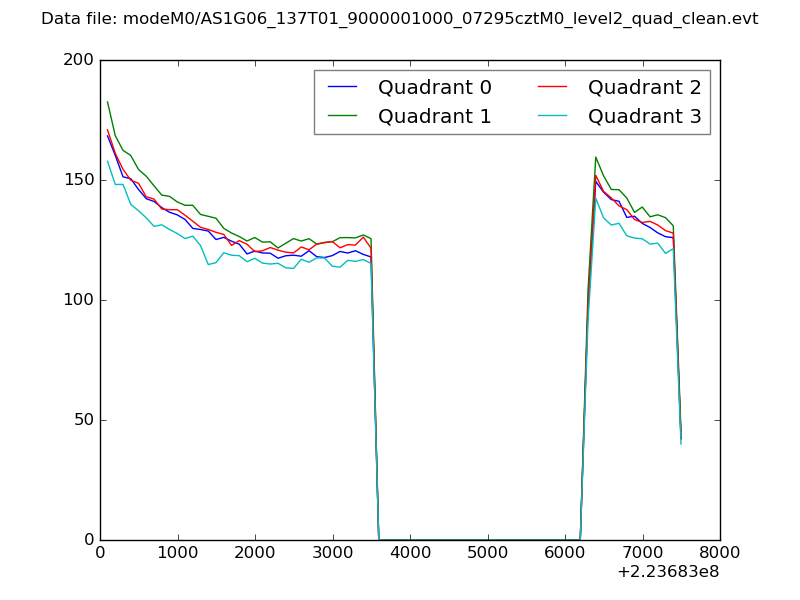 |
|
| Module-wise count rates for Quadrant A Data is divided into 100 sec bins |
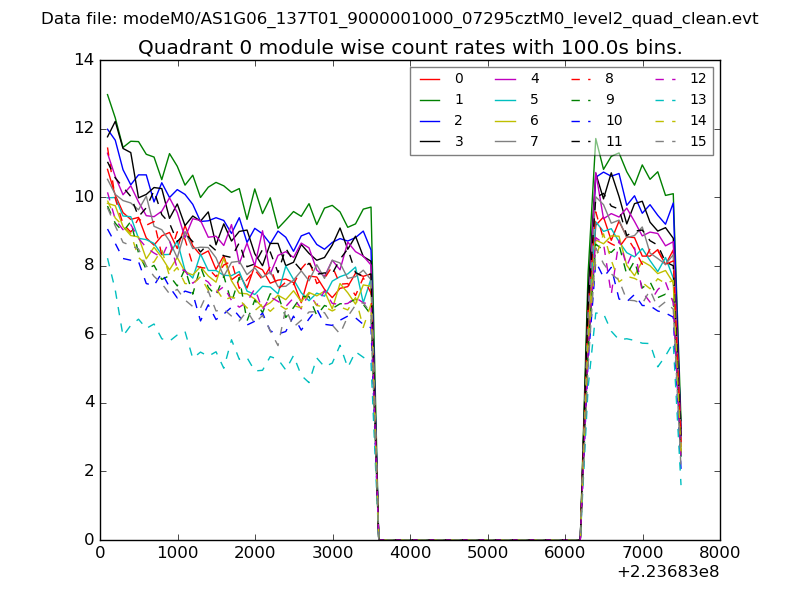 |
 |
| Module-wise count rates for Quadrant B Data is divided into 100 sec bins |
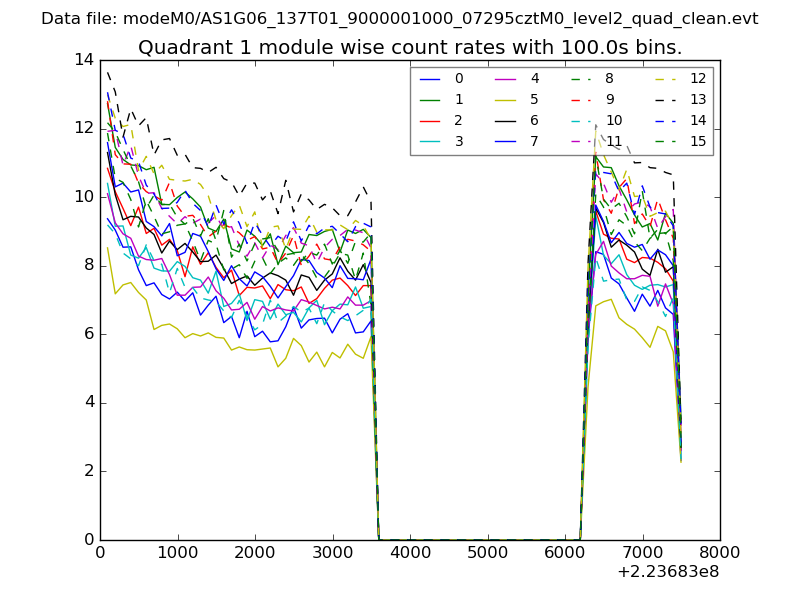 |
 |
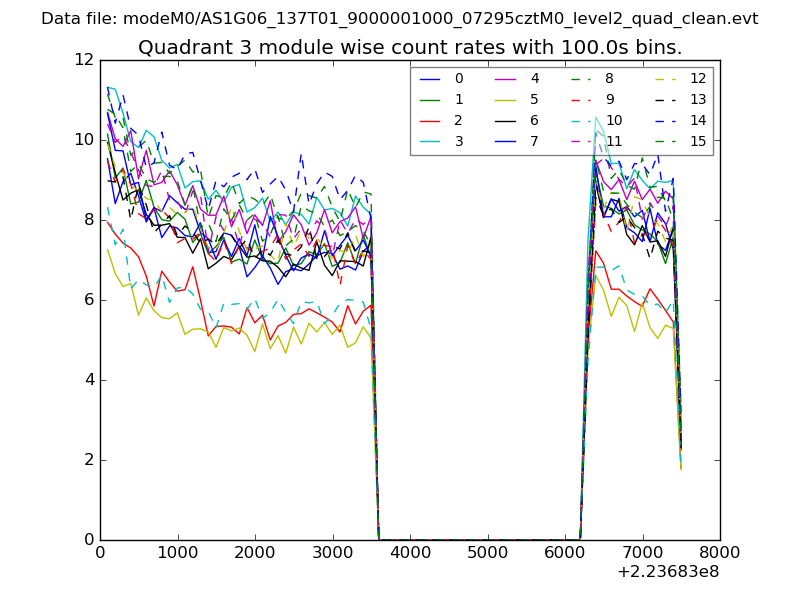
| Module-wise count rates for Quadrant C Data is divided into 100 sec bins |
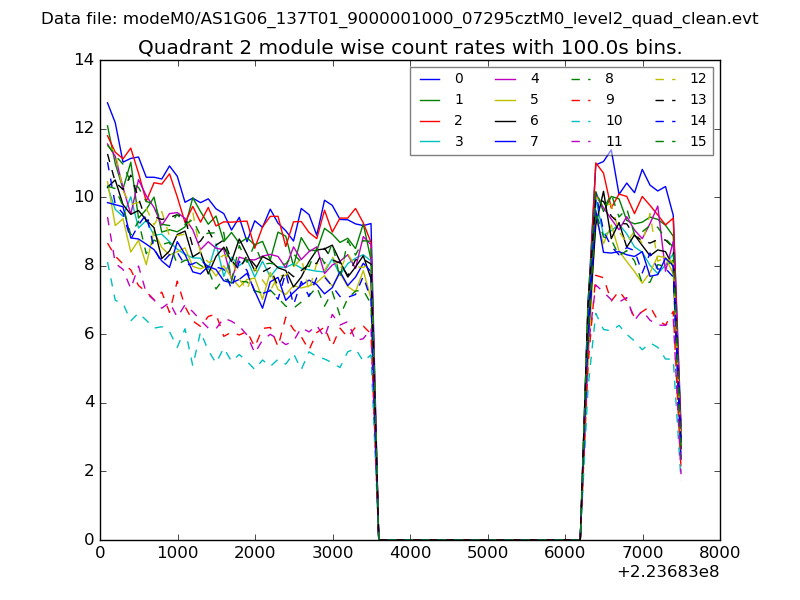 |
 |
| Module-wise count rates for Quadrant D Data is divided into 100 sec bins |
 |
 |
| Parameter | Plot |
|---|---|
| CZT HV Monitor | 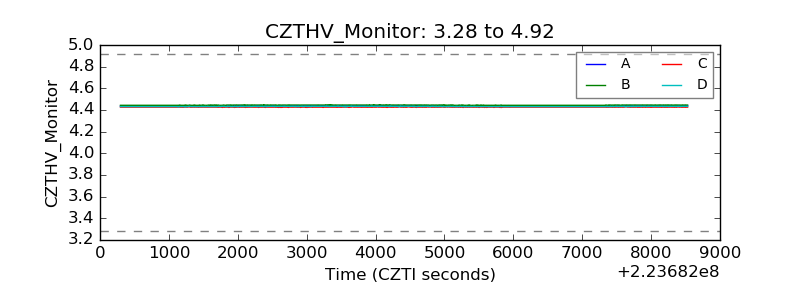 |
| D_VDD |  |
| Temperature 1 | 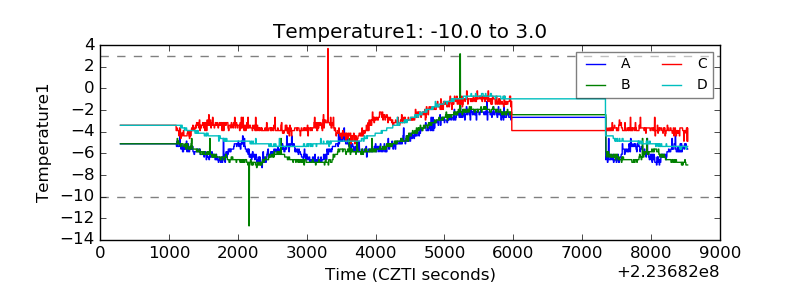 |
| Veto HV Monitor | 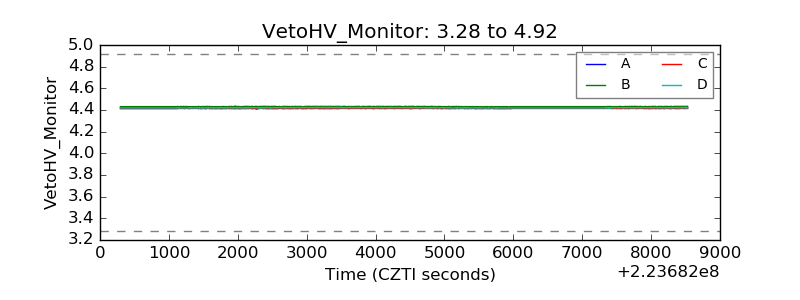 |
| Veto LLD | 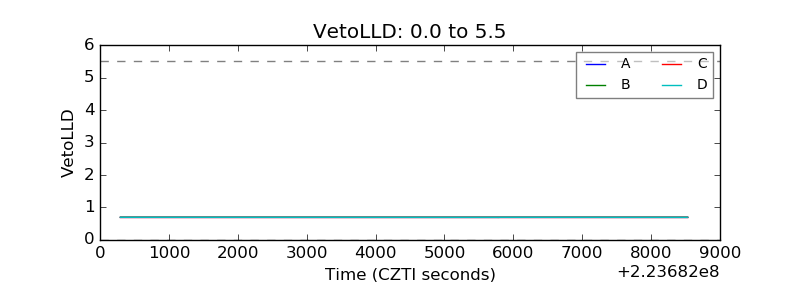 |
| Alpha Counter | 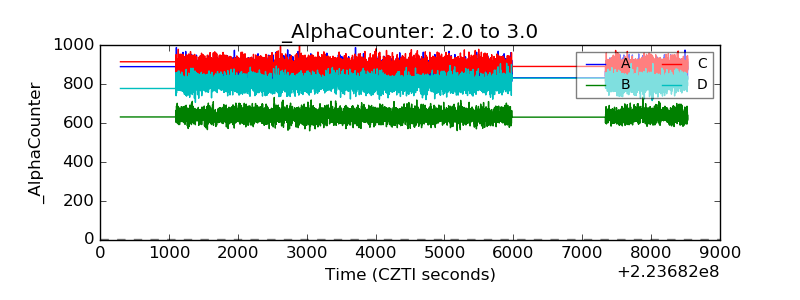 |
| _CPM_Rate | 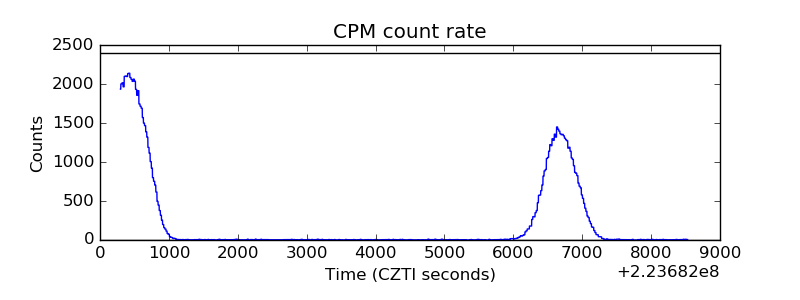 |
| CZT Counter | 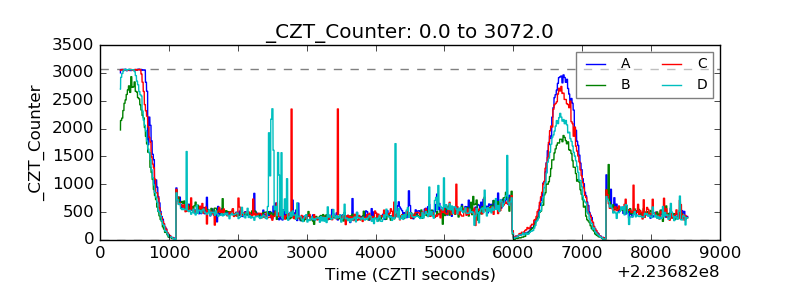 |
| +2.5 Volts monitor |  |
| +5 Volts monitor | 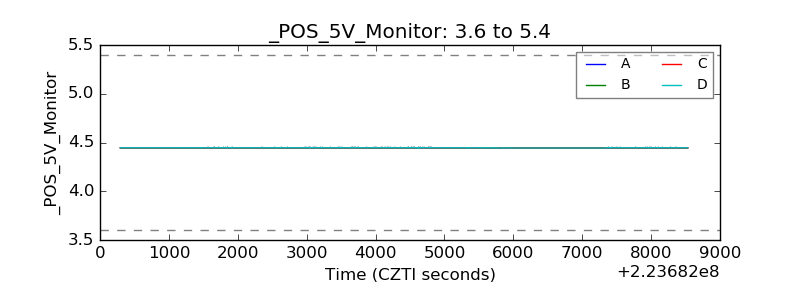 |
| _ROLL_ROT | 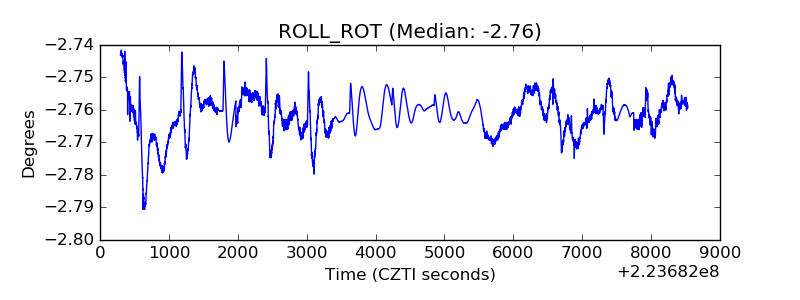 |
| _Roll_DEC | 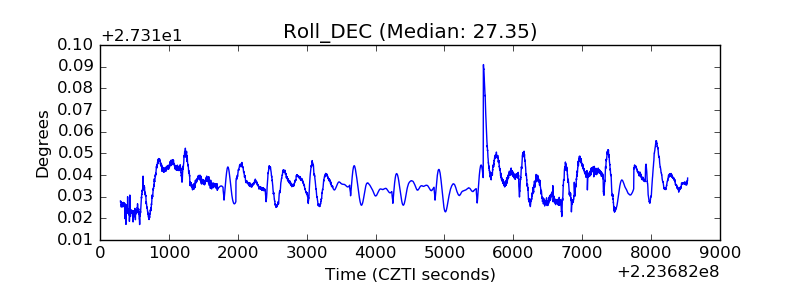 |
| _Roll_RA | 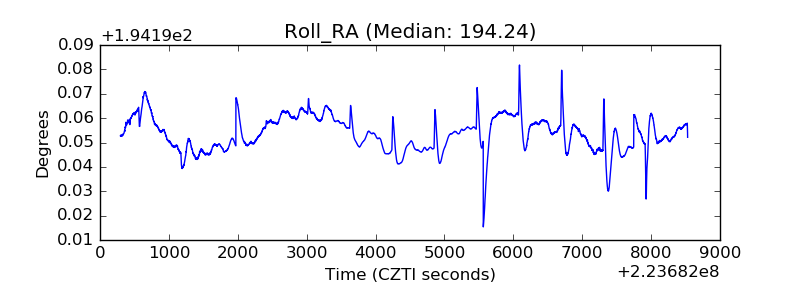 |
| Veto Counter | 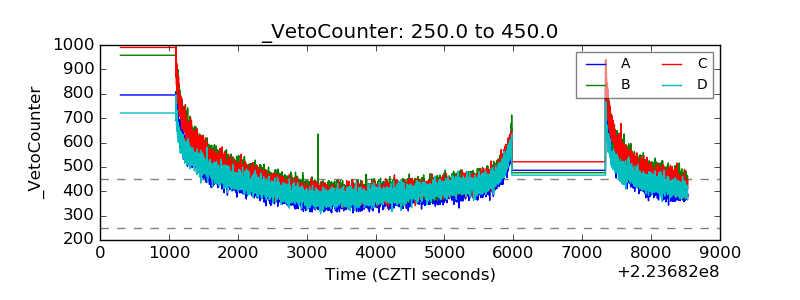 |