| Param | Original file | Final file |
|---|---|---|
| Filename | modeM0/AS1G06_137T01_9000001000_07297cztM0_level2.evt | modeM0/AS1G06_137T01_9000001000_07297cztM0_level2_quad_clean.evt |
| Size (bytes) | 468,832,320 | 93,061,440 |
| Size | 447.1 MB | 88.8 MB |
| Events in quadrant A | 4,133,905 | 538,013 |
| Events in quadrant B | 3,242,649 | 607,832 |
| Events in quadrant C | 3,164,585 | 603,761 |
| Events in quadrant D | 3,186,649 | 585,982 |
| Mode M9 | |||
|---|---|---|---|
| Quadrant | BADHDUFLAG | Total packets | Discarded packets |
| A | 0 | 8 | 0 |
| B | 0 | 8 | 0 |
| C | 0 | 8 | 0 |
| D | 0 | 8 | 0 |
| Mode M0 | |||
|---|---|---|---|
| Quadrant | BADHDUFLAG | Total packets | Discarded packets |
| A | 0 | 16945 | 2 |
| B | 0 | 14500 | 1 |
| C | 0 | 14442 | 1 |
| D | 0 | 14757 | 1 |
| Mode SS | |||
|---|---|---|---|
| Quadrant | BADHDUFLAG | Total packets | Discarded packets |
| A | 0 | 142 | 0 |
| B | 0 | 142 | 0 |
| C | 0 | 142 | 0 |
| D | 0 | 142 | 0 |
| Quadrant | Total seconds | Saturated seconds | Saturation percentage |
|---|---|---|---|
| A | 6921 | 337 | 4.869239% |
| B | 6921 | 74 | 1.069210% |
| C | 6921 | 48 | 0.693541% |
| D | 6921 | 53 | 0.765785% |
Noise dominated data is calculated using 1-second bins in cleaned event files. If a bin has >2000 counts, and if more than 50% of those come from <1% of pixels, then it is considered to be noise-dominated and hence unusable.
| Quadrant | # 1 sec bins | Bins with >0 counts | Bins with >2000 counts | High rate bins dominated by noise | Noise dominated (total time) | Noise dominated (detector-on time) | Marked lightcurve |
|---|---|---|---|---|---|---|---|
| A | 7806 | 6921 | 283 | 283 | 3.63% | 4.09% | 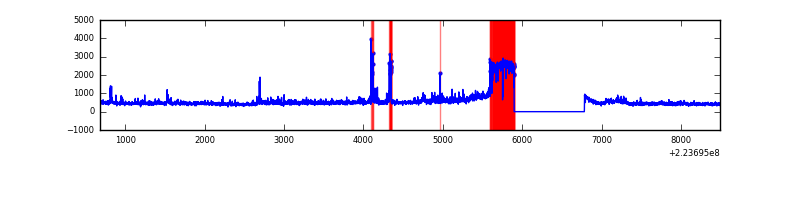 |
| B | 7806 | 6922 | 0 | 0 | 0.00% | 0.00% | 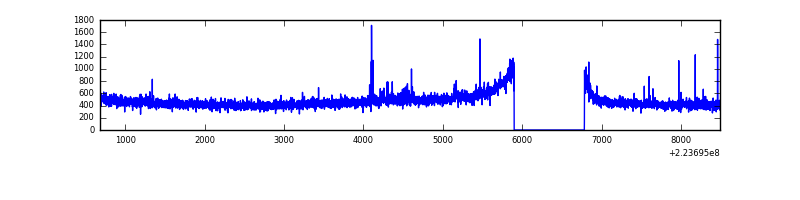 |
| C | 7806 | 6922 | 0 | 0 | 0.00% | 0.00% | 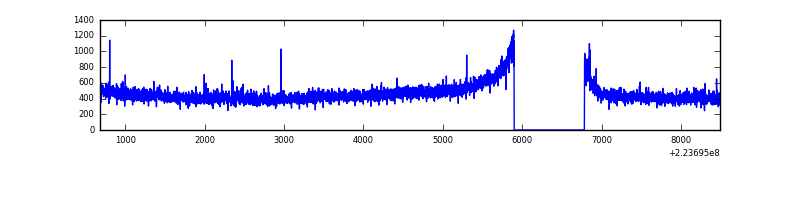 |
| D | 7806 | 6922 | 14 | 14 | 0.18% | 0.20% |  |
Top three noisy pixels from each quadrant. If the there are fewer than three noisy pixels in the level2.evt file, extra rows are filled as -1
| Pixel properties | Quadrant properties | ||||||
|---|---|---|---|---|---|---|---|
| Quadrant | DetID | PixID | Counts | Sigma | Mean | Median | Sigma |
| A | 15 | 234 | 829944 | 5277.47 | 772 | 756 | 157.1 |
| A | 8 | 15 | 298346 | 1894.05 | 772 | 756 | 157.1 |
| A | 15 | 239 | 31648 | 196.62 | 772 | 756 | 157.1 |
| B | 0 | 214 | 18028 | 108.69 | 828 | 811 | 158.4 |
| B | 12 | 111 | 16189 | 97.08 | 828 | 811 | 158.4 |
| B | 4 | 81 | 15159 | 90.58 | 828 | 811 | 158.4 |
| C | 9 | 68 | 41908 | 217.93 | 800 | 806 | 188.6 |
| C | 13 | 61 | 6099 | 28.06 | 800 | 806 | 188.6 |
| C | 7 | 247 | 3879 | 16.29 | 800 | 806 | 188.6 |
| D | 2 | 14 | 80230 | 396.94 | 802 | 780 | 200.2 |
| D | 2 | 216 | 34014 | 166.04 | 802 | 780 | 200.2 |
| D | 14 | 34 | 18747 | 89.76 | 802 | 780 | 200.2 |
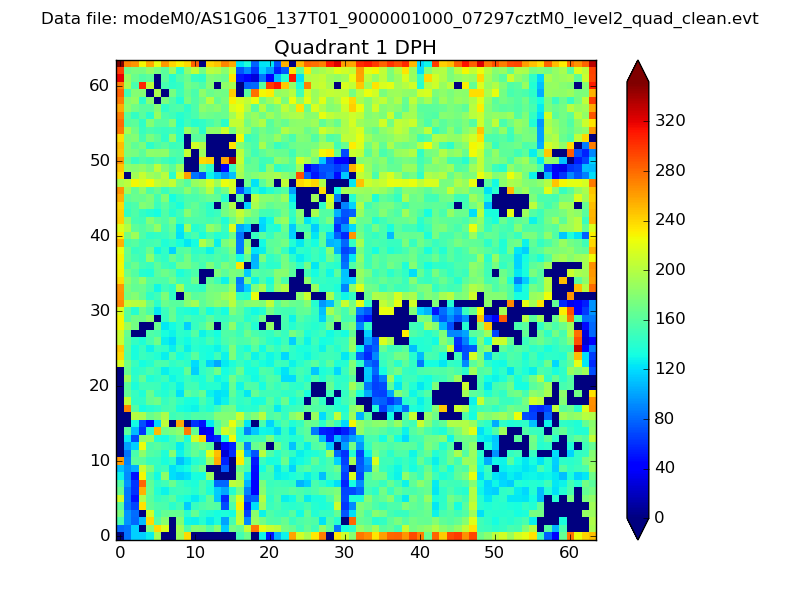
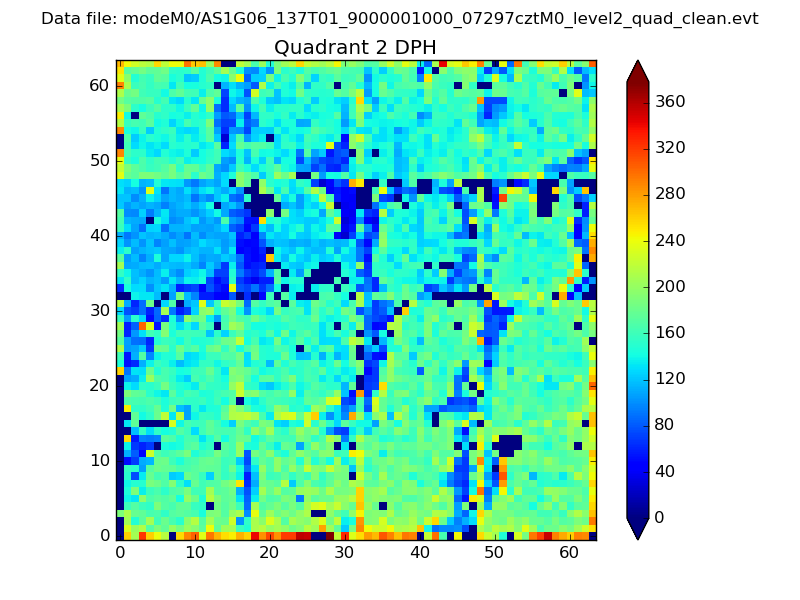
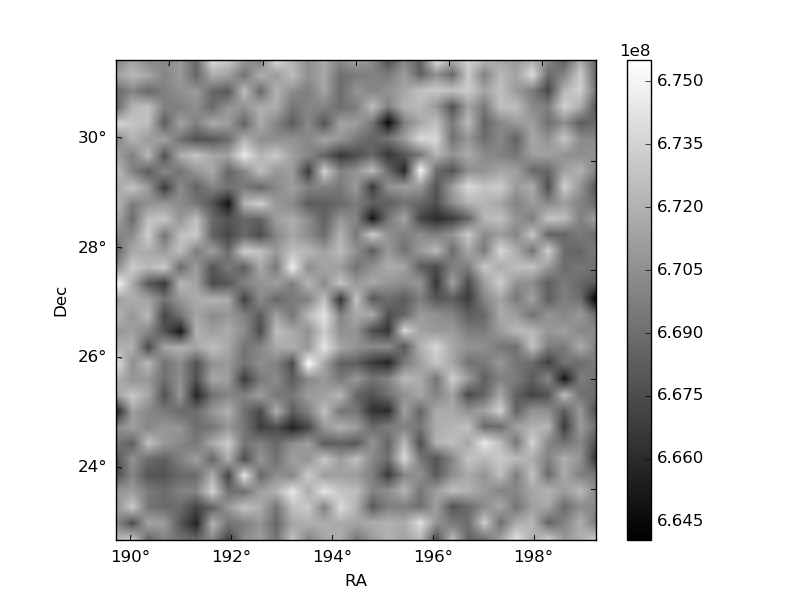
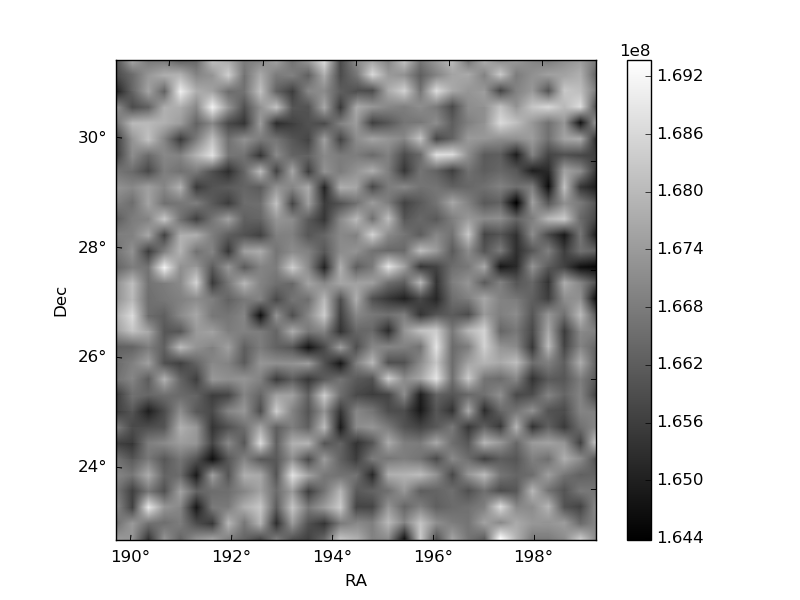
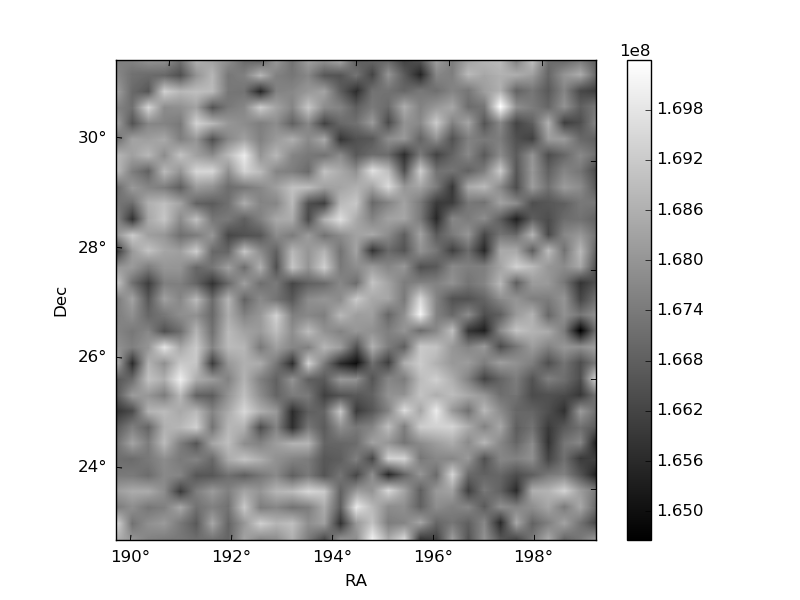
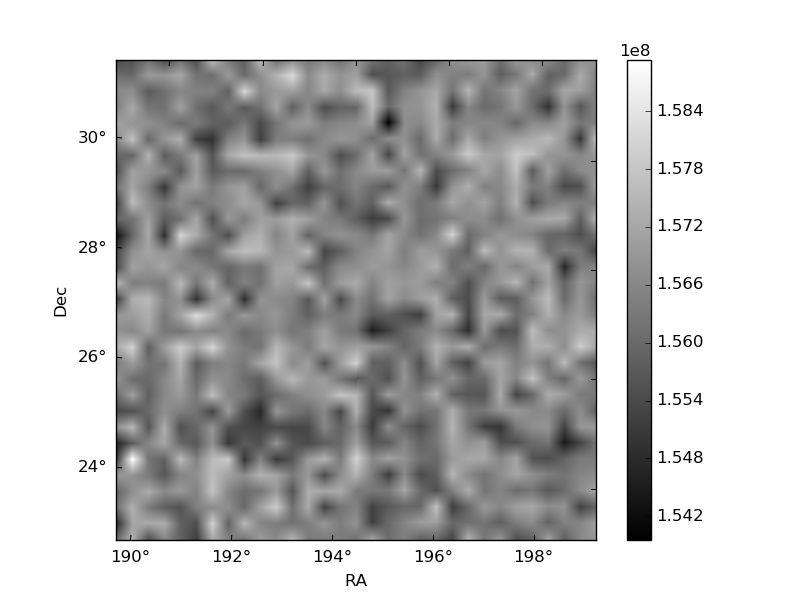
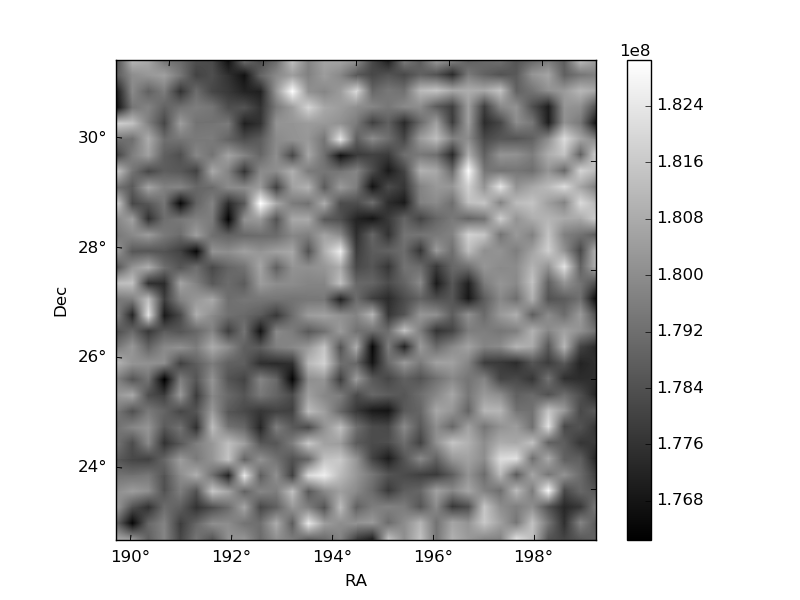
Histogram calculated using DETX and DETY for each event in the final _common_clean file
| Quadrant A | 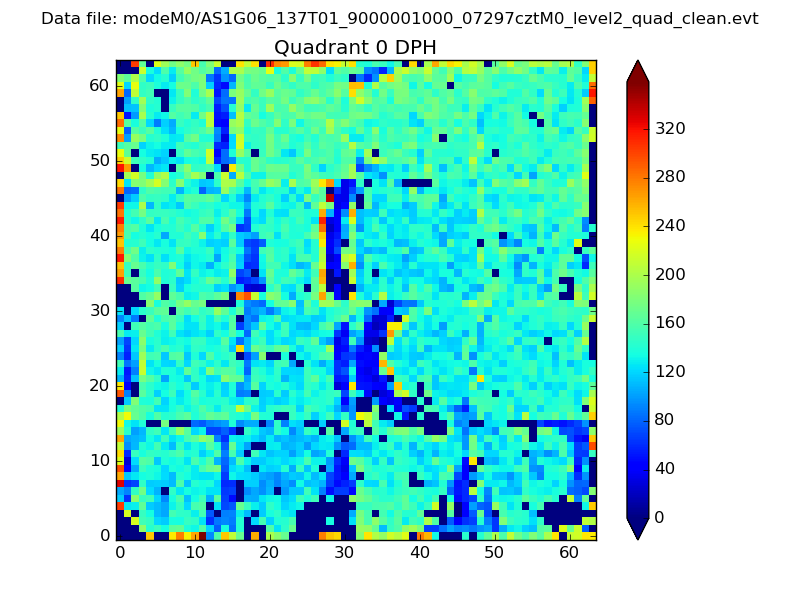 |
 |
Quadrant B |
|---|---|---|---|
| Quadrant D | 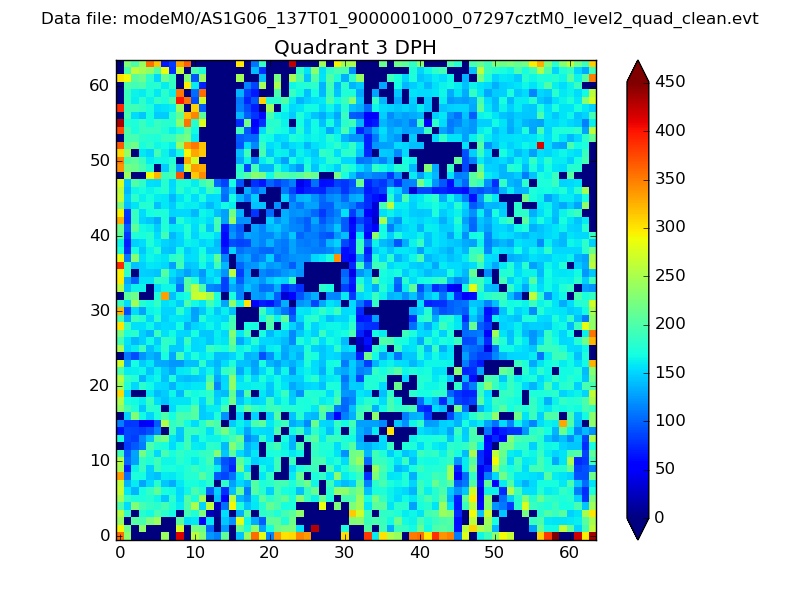 |
 |
Quadrant C |
| Plot type | Count rate plots | Images |
|---|---|---|
| Comparison with Poisson distribution Blue bars denote a histogram of data divided into 1 sec bins. Red curve is a Poisson curve with rate = median count rate of data. |
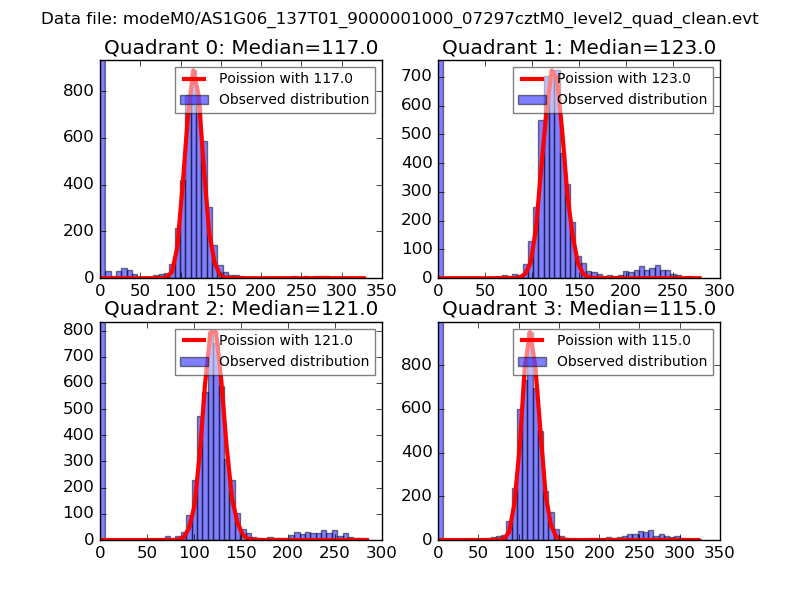 |
 |
| Quadrant-wise count rates Data is divided into 100 sec bins |
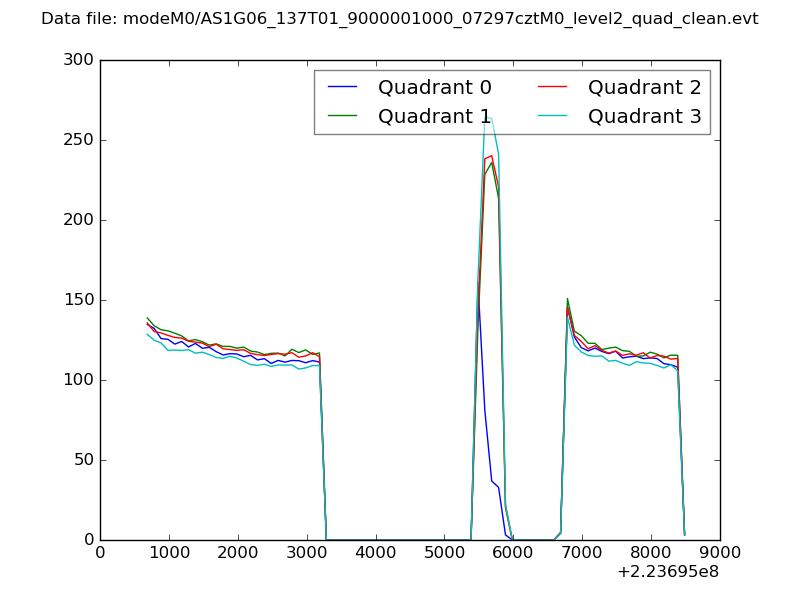 |
|
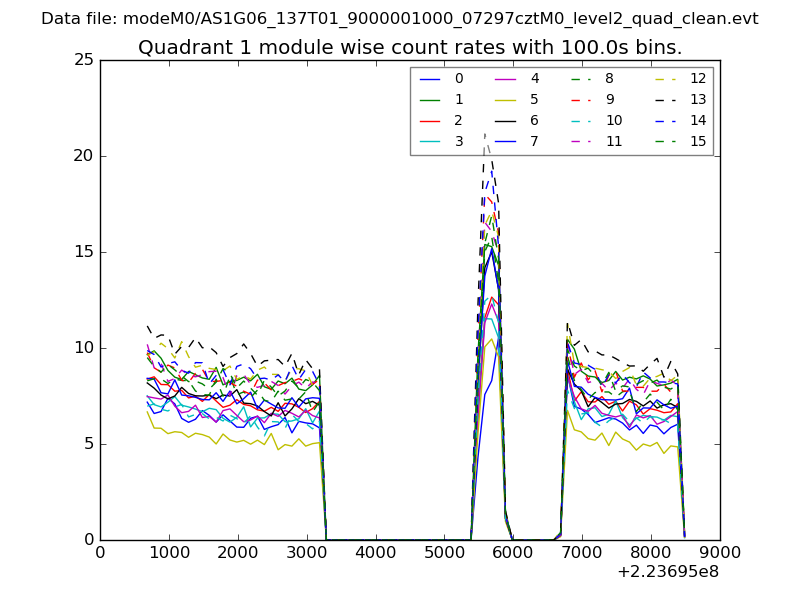
| Module-wise count rates for Quadrant A Data is divided into 100 sec bins |
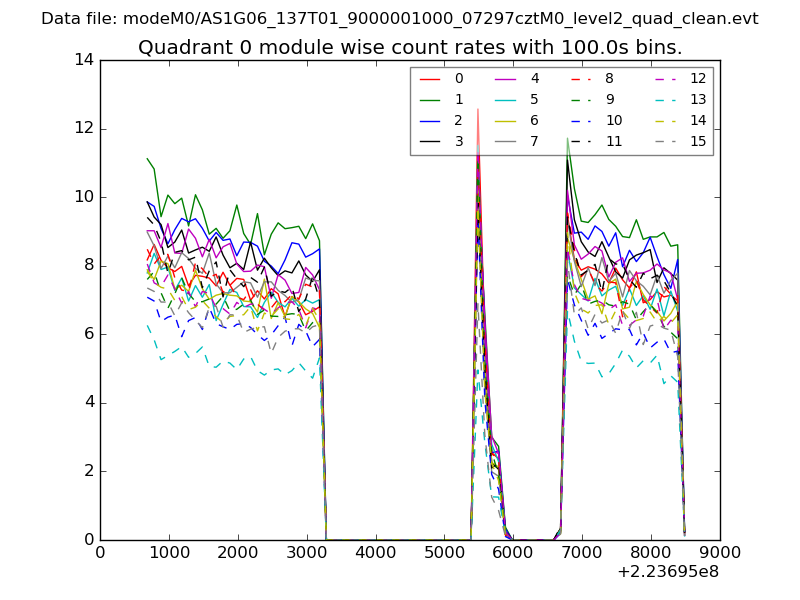 |
 |
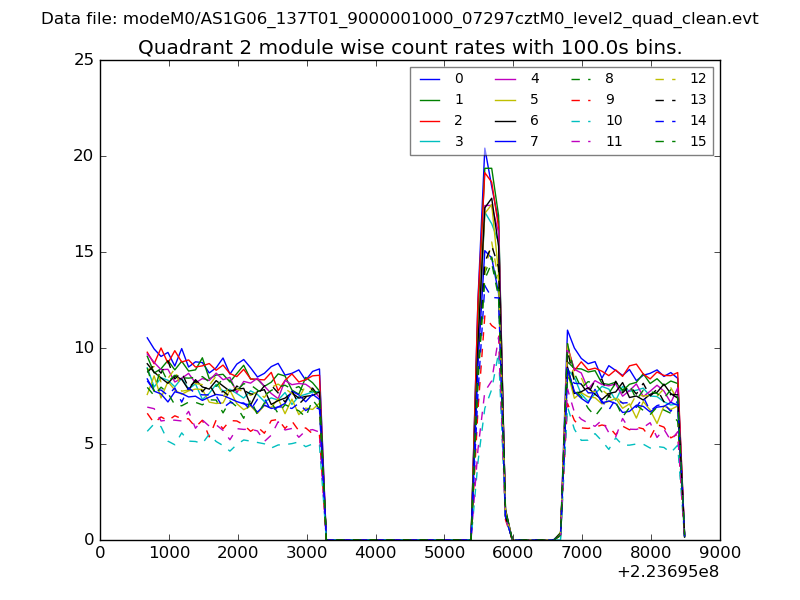
| Module-wise count rates for Quadrant B Data is divided into 100 sec bins |
 |
 |
| Module-wise count rates for Quadrant C Data is divided into 100 sec bins |
 |
 |
| Module-wise count rates for Quadrant D Data is divided into 100 sec bins |
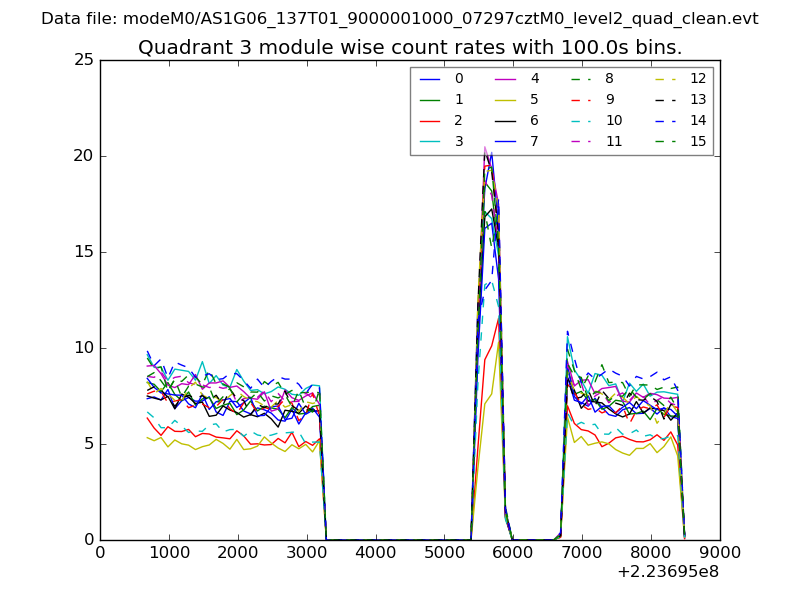 |
 |
| Parameter | Plot |
|---|---|
| CZT HV Monitor | 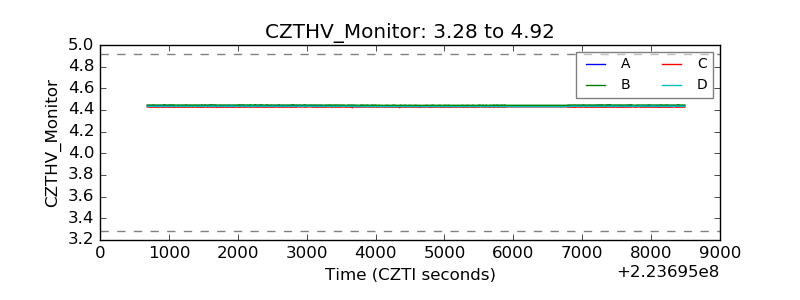 |
| D_VDD | 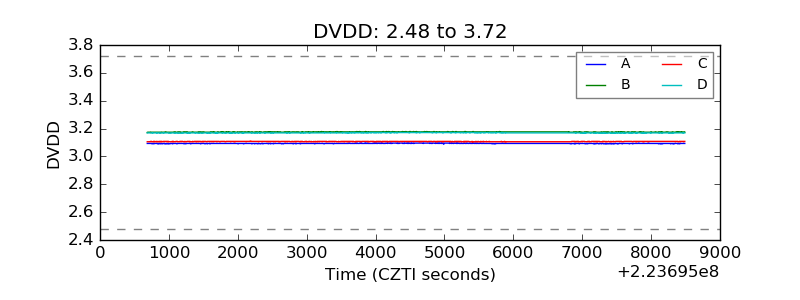 |
| Temperature 1 | 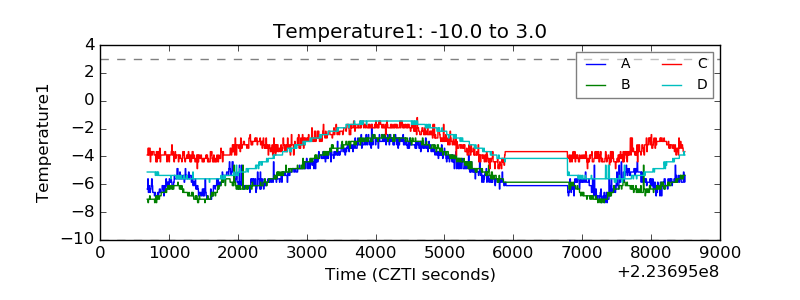 |
| Veto HV Monitor | 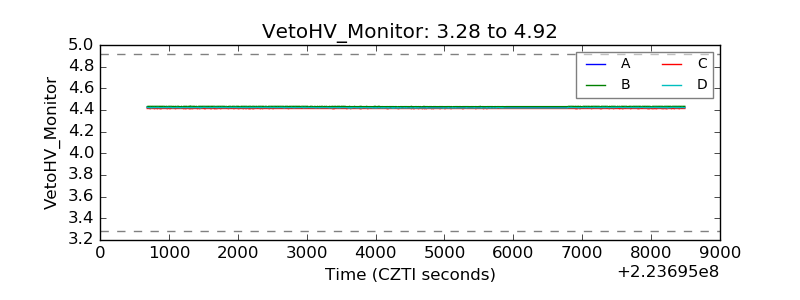 |
| Veto LLD | 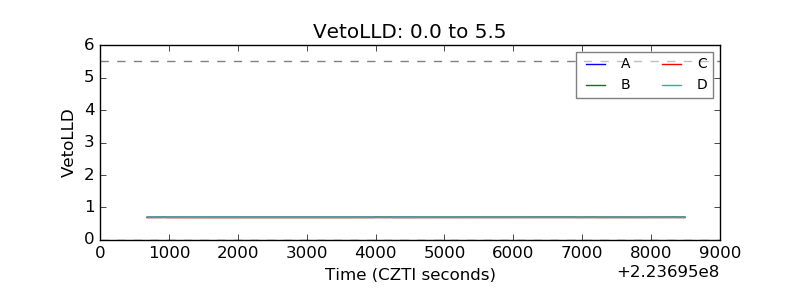 |
| Alpha Counter | 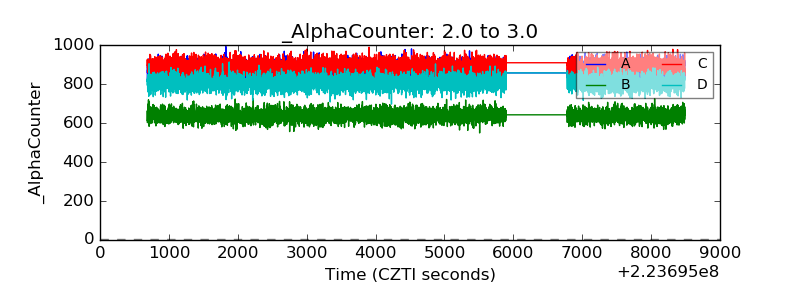 |
| _CPM_Rate | 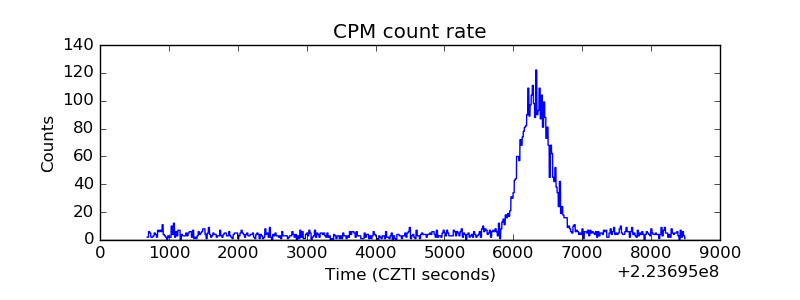 |
| CZT Counter | 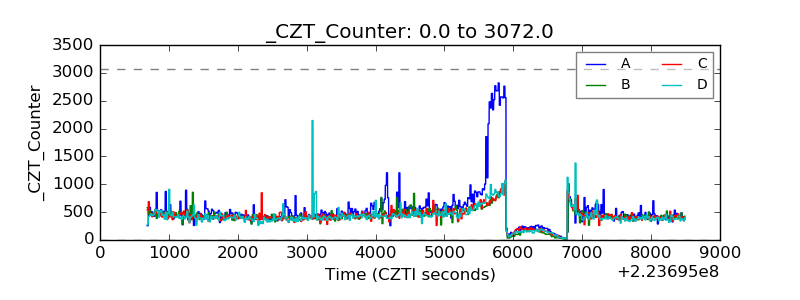 |
| +2.5 Volts monitor | 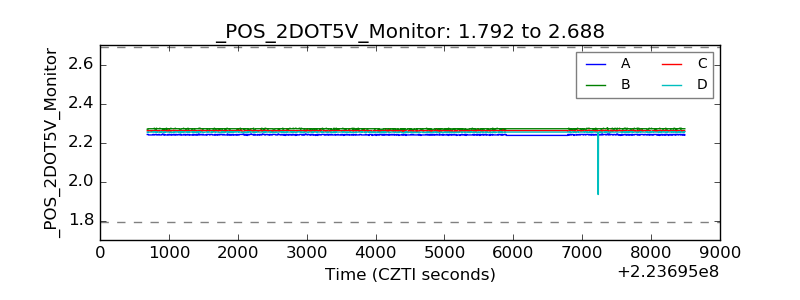 |
| +5 Volts monitor |  |
| _ROLL_ROT | 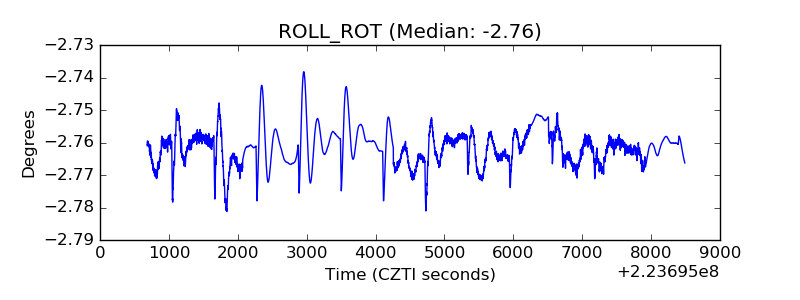 |
| _Roll_DEC | 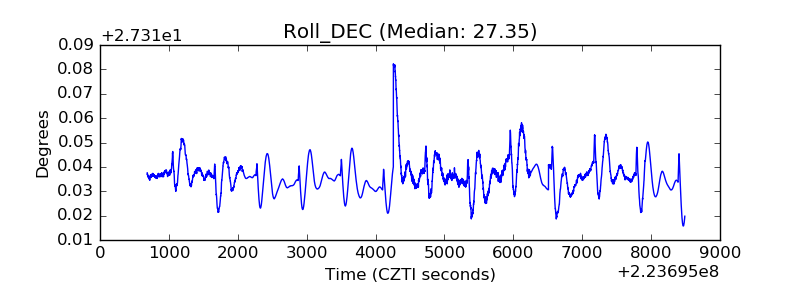 |
| _Roll_RA | 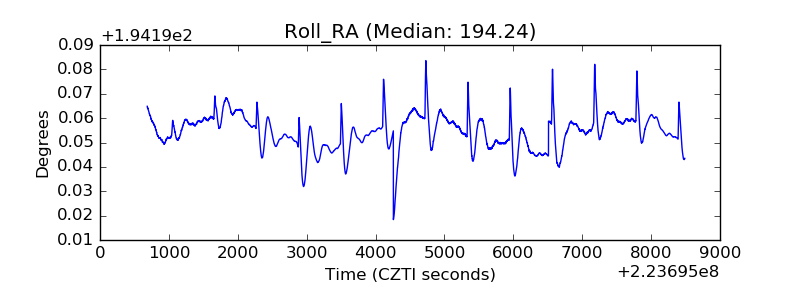 |
| Veto Counter | 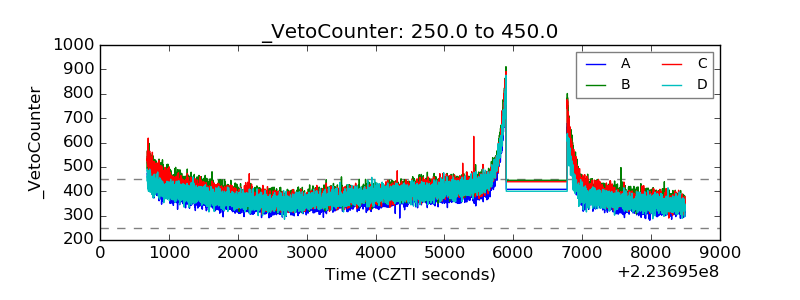 |