| Param | Original file | Final file |
|---|---|---|
| Filename | modeM0/AS1G06_137T01_9000001000_07298cztM0_level2.evt | modeM0/AS1G06_137T01_9000001000_07298cztM0_level2_quad_clean.evt |
| Size (bytes) | 555,079,680 | 110,928,960 |
| Size | 529.4 MB | 105.8 MB |
| Events in quadrant A | 4,445,995 | 657,516 |
| Events in quadrant B | 3,816,537 | 727,111 |
| Events in quadrant C | 3,810,687 | 722,340 |
| Events in quadrant D | 4,198,407 | 700,478 |
| Mode M9 | |||
|---|---|---|---|
| Quadrant | BADHDUFLAG | Total packets | Discarded packets |
| A | 0 | 13 | 0 |
| B | 0 | 13 | 0 |
| C | 0 | 13 | 0 |
| D | 0 | 13 | 0 |
| Mode M0 | |||
|---|---|---|---|
| Quadrant | BADHDUFLAG | Total packets | Discarded packets |
| A | 0 | 18553 | 3 |
| B | 0 | 16843 | 2 |
| C | 0 | 17058 | 2 |
| D | 0 | 18457 | 2 |
| Mode SS | |||
|---|---|---|---|
| Quadrant | BADHDUFLAG | Total packets | Discarded packets |
| A | 0 | 166 | 0 |
| B | 0 | 166 | 0 |
| C | 0 | 166 | 0 |
| D | 0 | 166 | 0 |
| Quadrant | Total seconds | Saturated seconds | Saturation percentage |
|---|---|---|---|
| A | 7933 | 455 | 5.735535% |
| B | 7933 | 176 | 2.218581% |
| C | 7933 | 105 | 1.323585% |
| D | 7933 | 200 | 2.521114% |
Noise dominated data is calculated using 1-second bins in cleaned event files. If a bin has >2000 counts, and if more than 50% of those come from <1% of pixels, then it is considered to be noise-dominated and hence unusable.
| Quadrant | # 1 sec bins | Bins with >0 counts | Bins with >2000 counts | High rate bins dominated by noise | Noise dominated (total time) | Noise dominated (detector-on time) | Marked lightcurve |
|---|---|---|---|---|---|---|---|
| A | 9223 | 7935 | 305 | 305 | 3.31% | 3.84% | 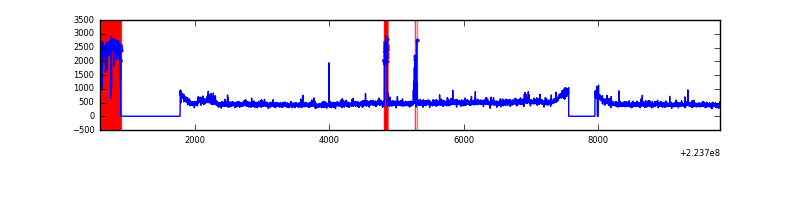 |
| B | 9223 | 7936 | 6 | 6 | 0.07% | 0.08% | 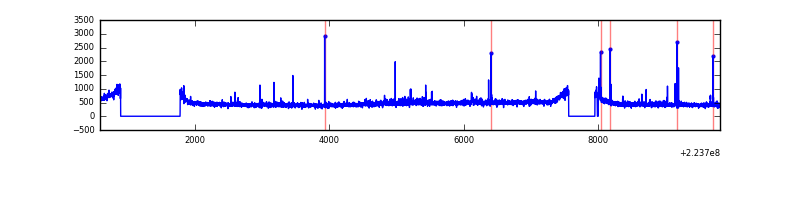 |
| C | 9223 | 7936 | 15 | 15 | 0.16% | 0.19% | 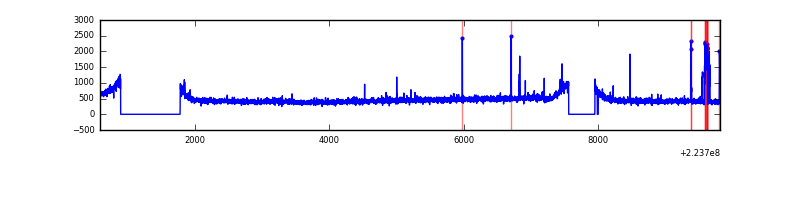 |
| D | 9223 | 7936 | 79 | 79 | 0.86% | 1.00% | 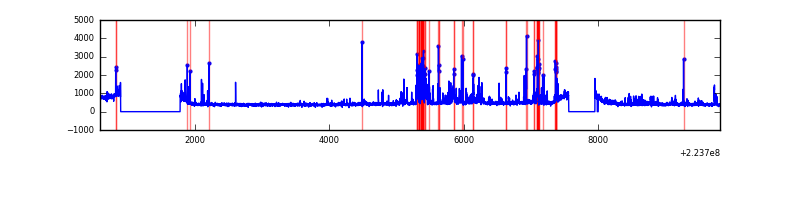 |
Top three noisy pixels from each quadrant. If the there are fewer than three noisy pixels in the level2.evt file, extra rows are filled as -1
| Pixel properties | Quadrant properties | ||||||
|---|---|---|---|---|---|---|---|
| Quadrant | DetID | PixID | Counts | Sigma | Mean | Median | Sigma |
| A | 15 | 234 | 811343 | 4366.89 | 904 | 883 | 185.6 |
| A | 8 | 15 | 137693 | 737.15 | 904 | 883 | 185.6 |
| A | 15 | 239 | 9107 | 44.31 | 904 | 883 | 185.6 |
| B | 4 | 81 | 54351 | 285.13 | 962 | 939 | 187.3 |
| B | 0 | 214 | 32184 | 166.79 | 962 | 939 | 187.3 |
| B | 12 | 111 | 19731 | 100.32 | 962 | 939 | 187.3 |
| C | 9 | 68 | 169051 | 770.42 | 929 | 932 | 218.2 |
| C | 7 | 247 | 16838 | 72.89 | 929 | 932 | 218.2 |
| C | 13 | 61 | 7137 | 28.43 | 929 | 932 | 218.2 |
| D | 12 | 110 | 342455 | 1482.64 | 928 | 900 | 230.4 |
| D | 2 | 14 | 188230 | 813.17 | 928 | 900 | 230.4 |
| D | 2 | 216 | 73471 | 315.02 | 928 | 900 | 230.4 |
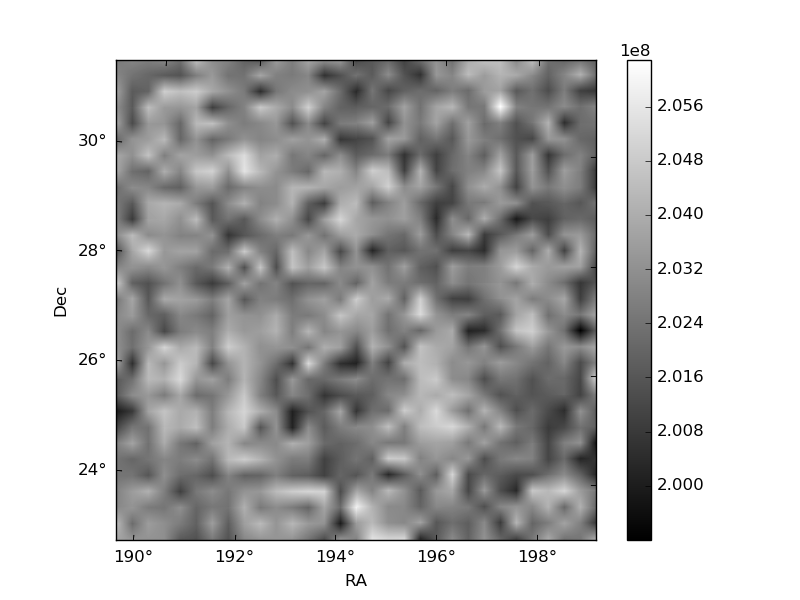
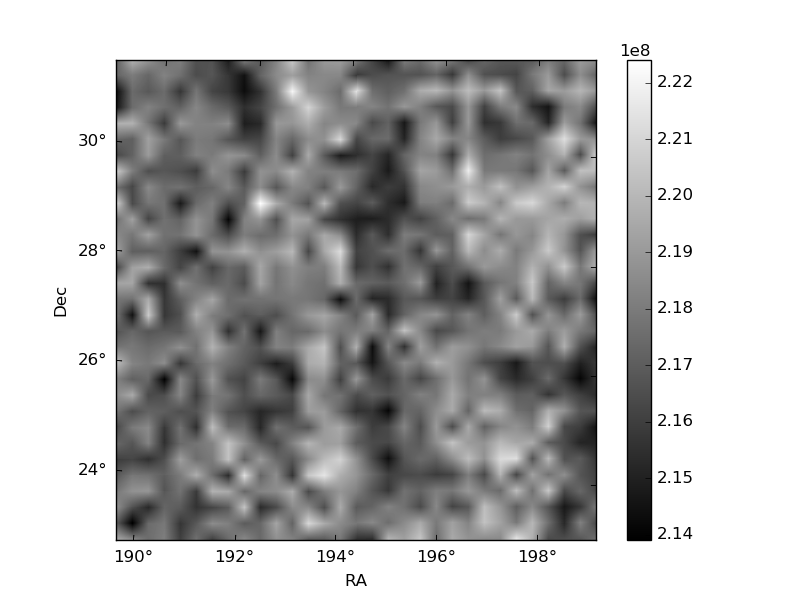
Histogram calculated using DETX and DETY for each event in the final _common_clean file
| Quadrant A | 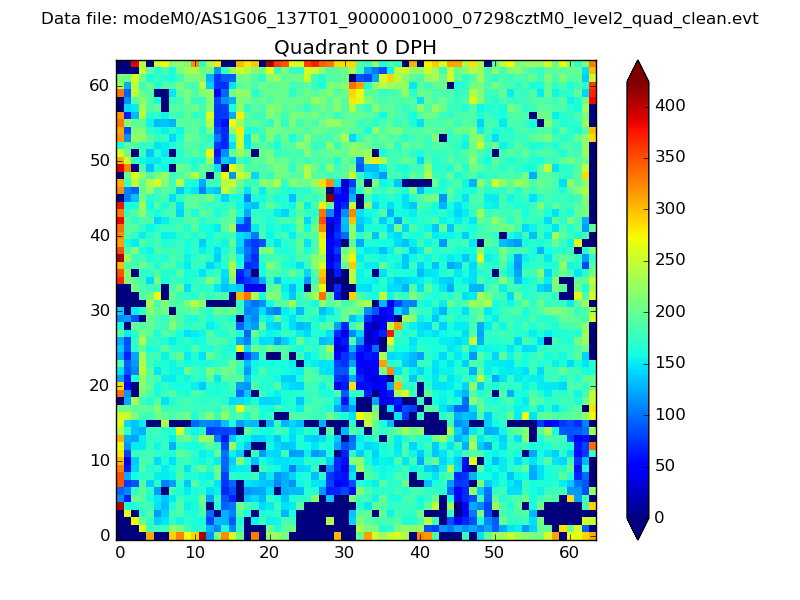 |
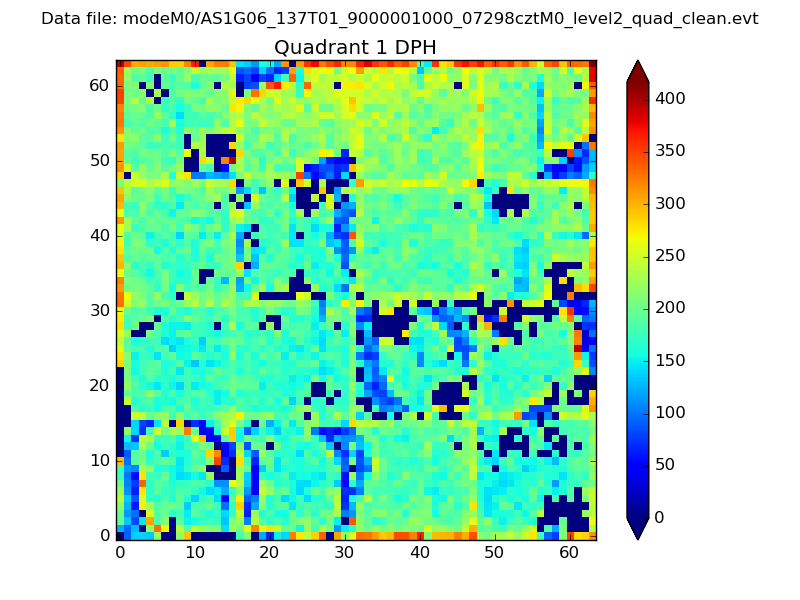 |
Quadrant B |
|---|---|---|---|
| Quadrant D | 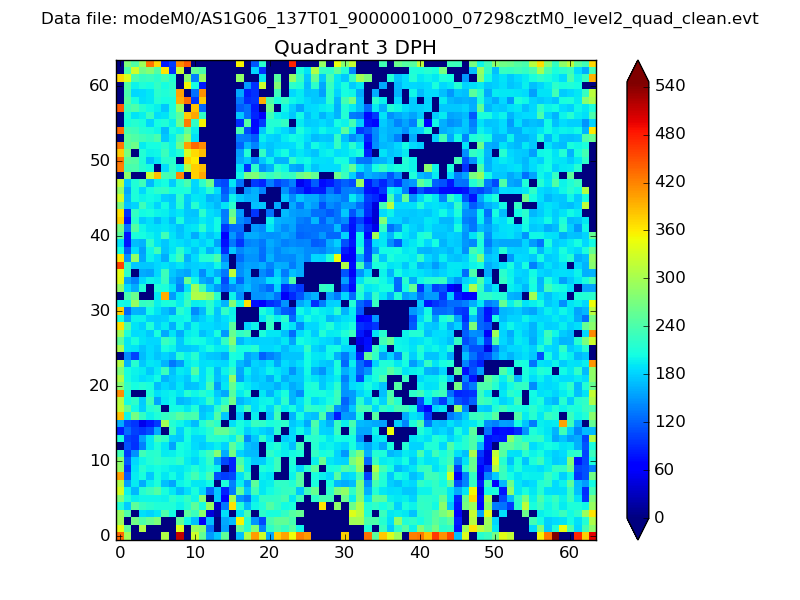 |
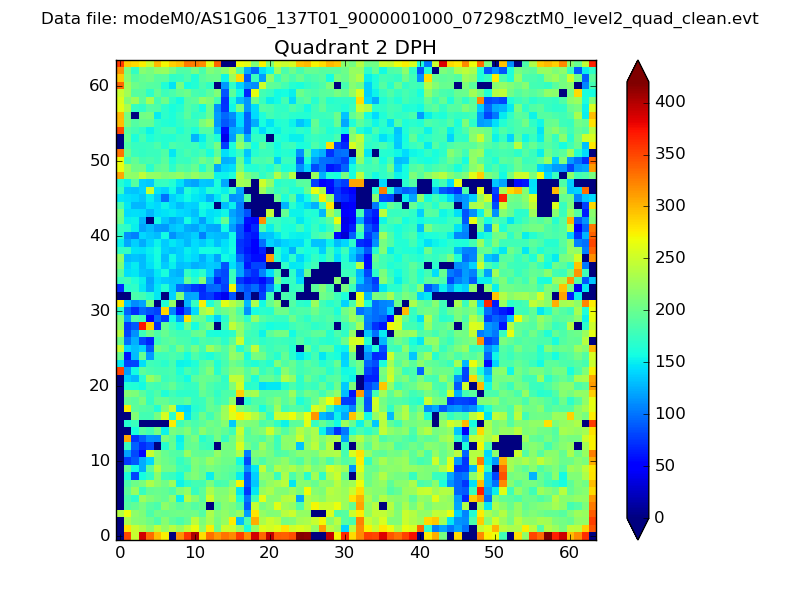 |
Quadrant C |
| Plot type | Count rate plots | Images |
|---|---|---|
| Comparison with Poisson distribution Blue bars denote a histogram of data divided into 1 sec bins. Red curve is a Poisson curve with rate = median count rate of data. |
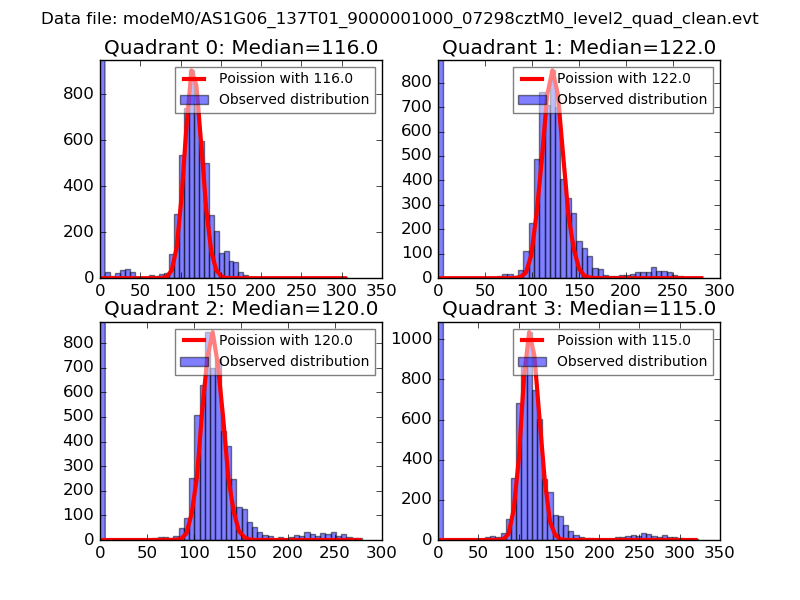 |
 |
| Quadrant-wise count rates Data is divided into 100 sec bins |
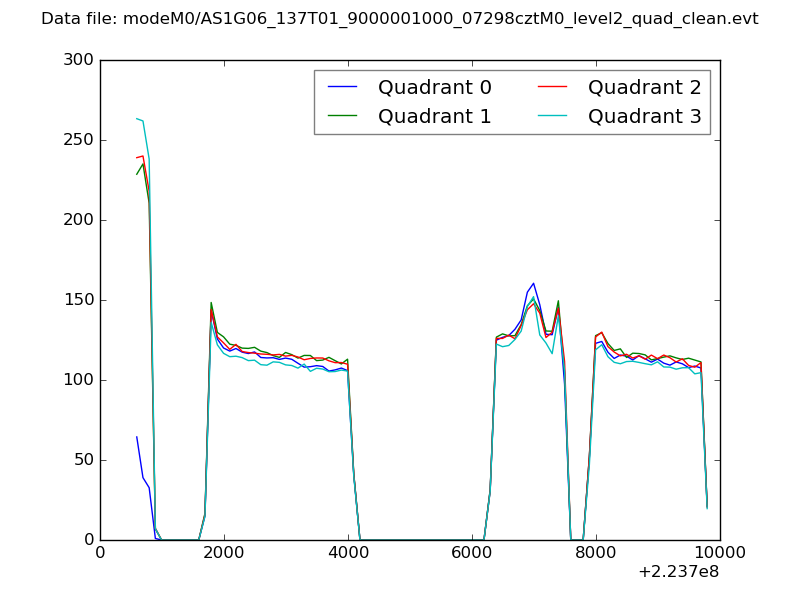 |
|
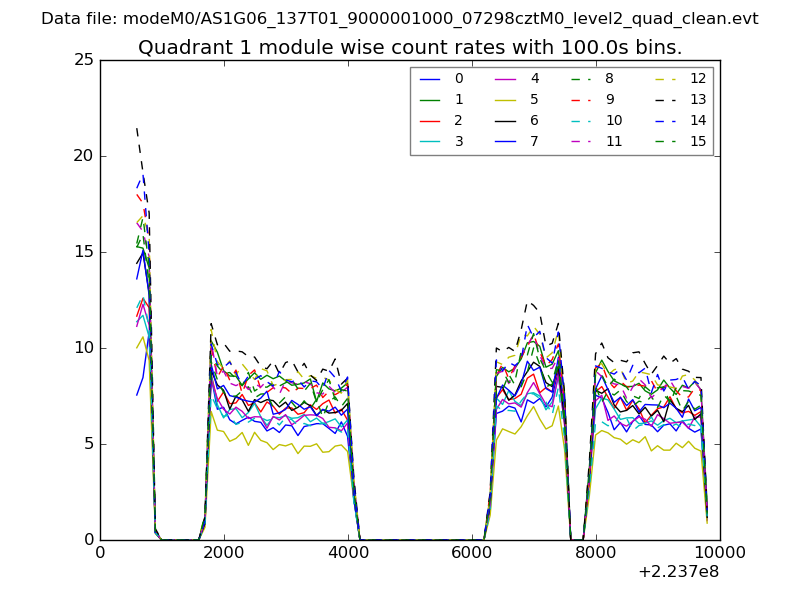
| Module-wise count rates for Quadrant A Data is divided into 100 sec bins |
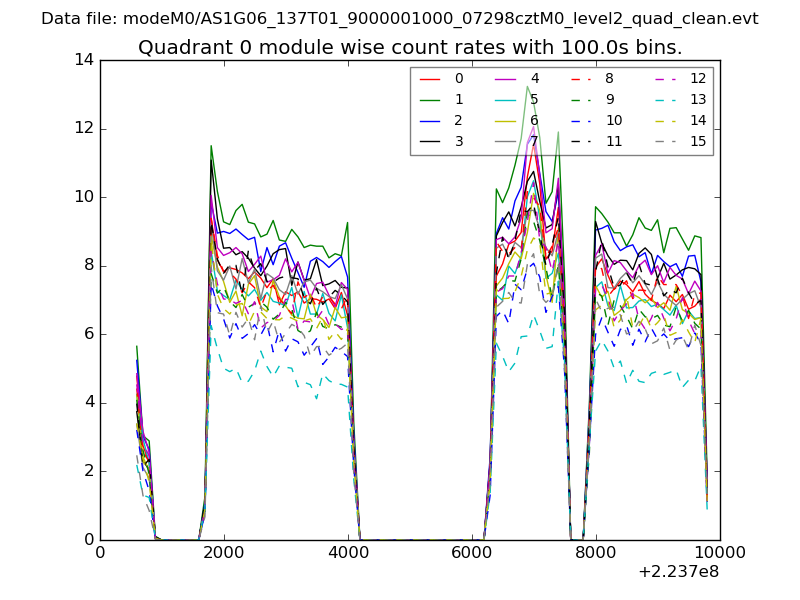 |
 |
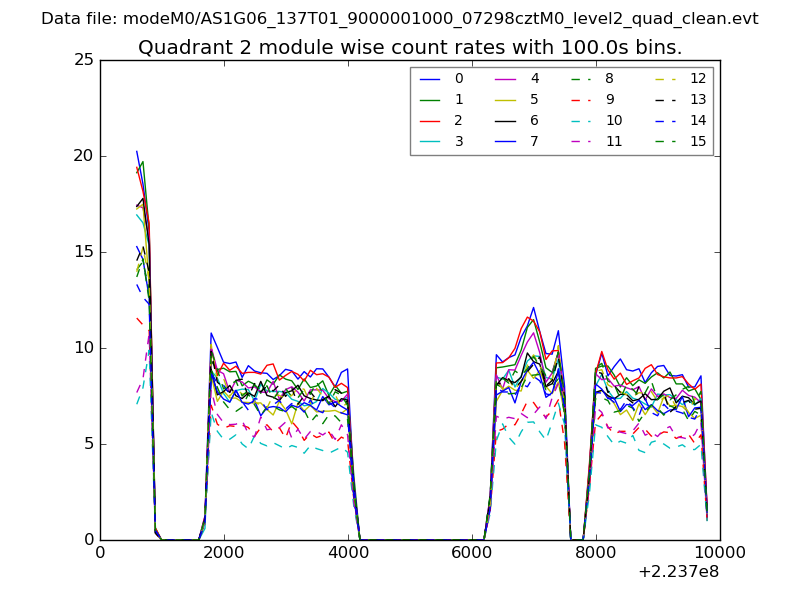
| Module-wise count rates for Quadrant B Data is divided into 100 sec bins |
 |
 |
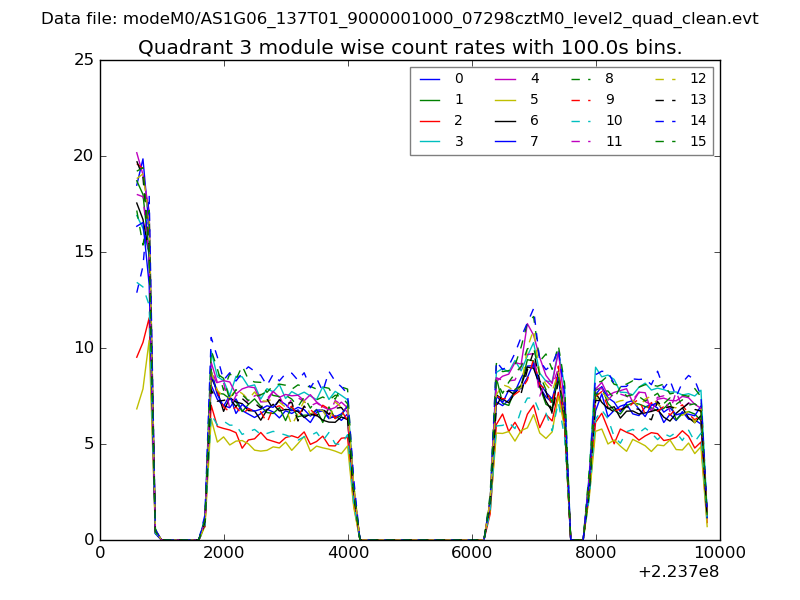
| Module-wise count rates for Quadrant C Data is divided into 100 sec bins |
 |
 |
| Module-wise count rates for Quadrant D Data is divided into 100 sec bins |
 |
 |
| Parameter | Plot |
|---|---|
| CZT HV Monitor | 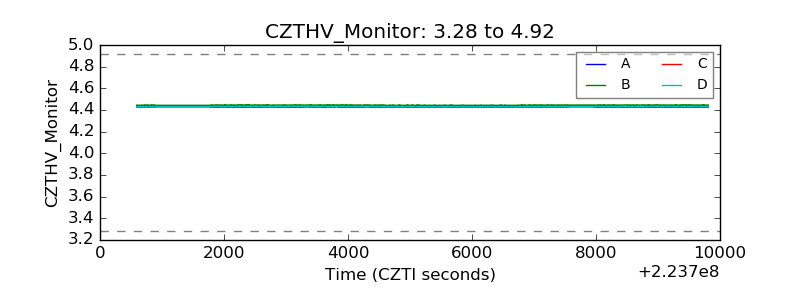 |
| D_VDD | 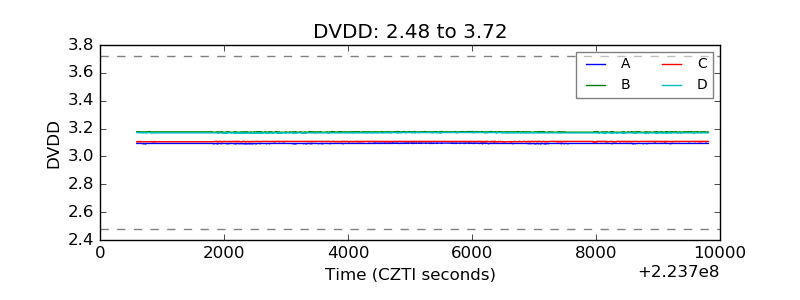 |
| Temperature 1 | 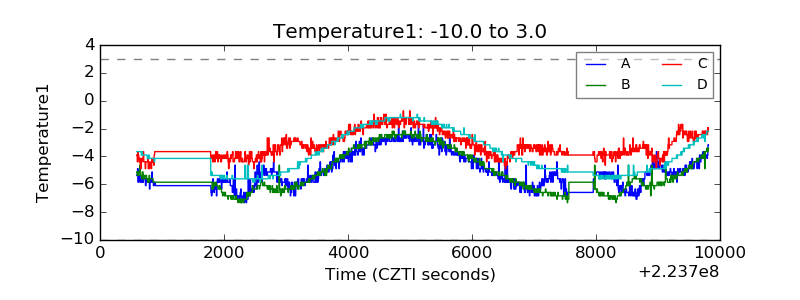 |
| Veto HV Monitor | 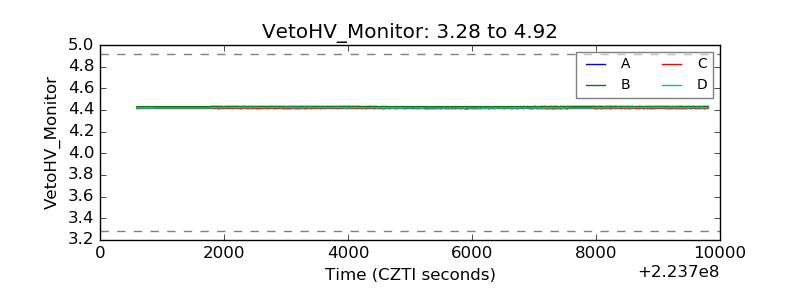 |
| Veto LLD | 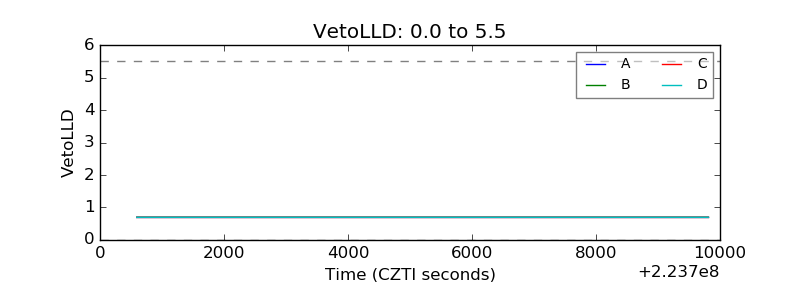 |
| Alpha Counter | 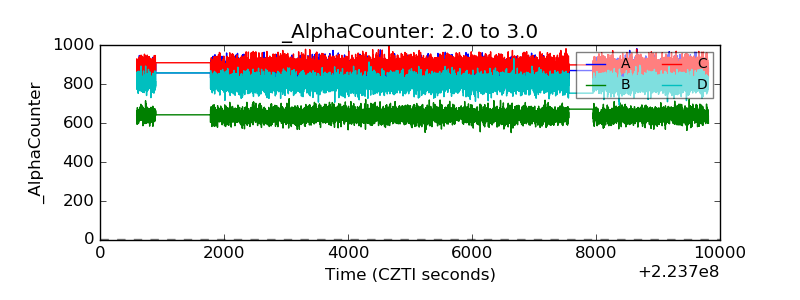 |
| _CPM_Rate | 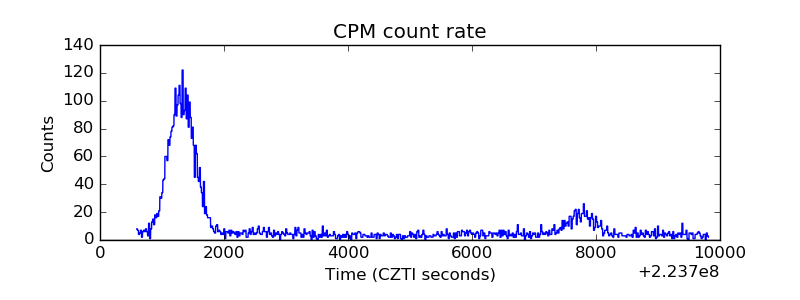 |
| CZT Counter | 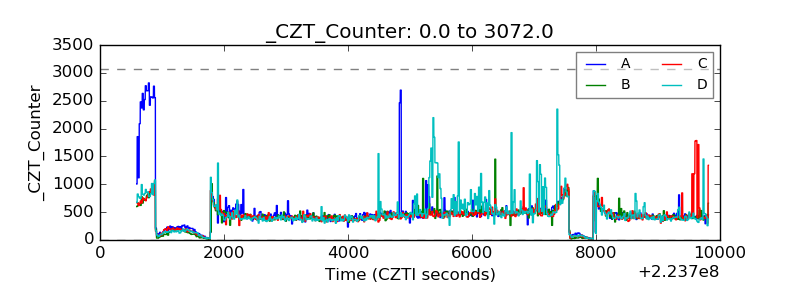 |
| +2.5 Volts monitor |  |
| +5 Volts monitor |  |
| _ROLL_ROT | 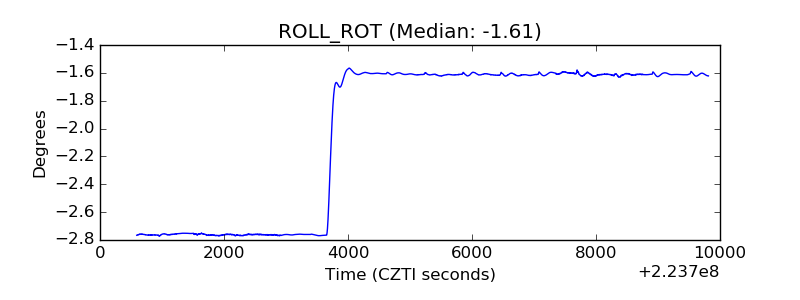 |
| _Roll_DEC | 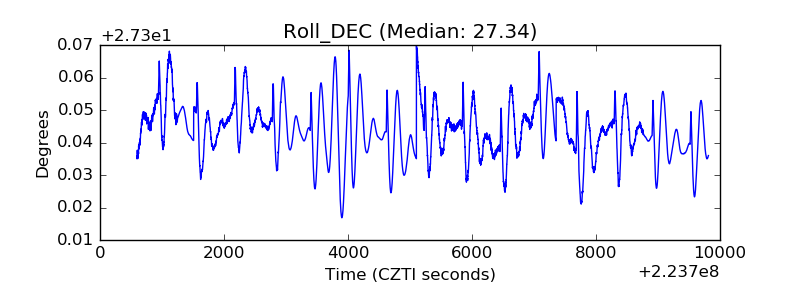 |
| _Roll_RA | 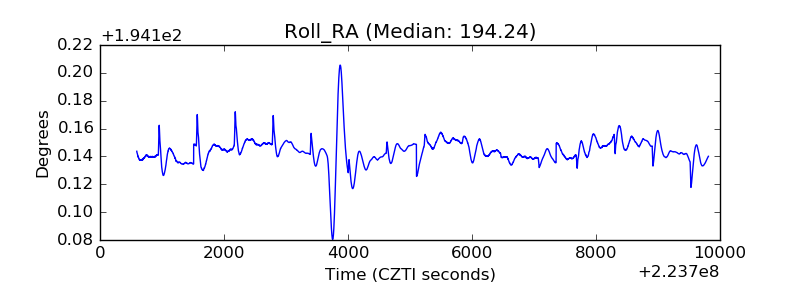 |
| Veto Counter | 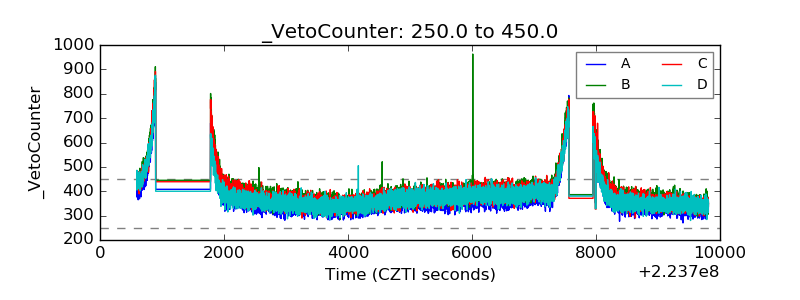 |