| Param | Original file | Final file |
|---|---|---|
| Filename | modeM0/AS1G06_137T01_9000001000_07299cztM0_level2.evt | modeM0/AS1G06_137T01_9000001000_07299cztM0_level2_quad_clean.evt |
| Size (bytes) | 37,854,720 | 9,973,440 |
| Size | 36.1 MB | 9.5 MB |
| Events in quadrant A | 271,665 | 63,672 |
| Events in quadrant B | 284,759 | 66,286 |
| Events in quadrant C | 272,517 | 65,590 |
| Events in quadrant D | 279,158 | 62,206 |
| Mode M9 | |||
|---|---|---|---|
| Quadrant | BADHDUFLAG | Total packets | Discarded packets |
| A | 0 | 5 | 0 |
| B | 0 | 5 | 0 |
| C | 0 | 5 | 0 |
| D | 0 | 5 | 0 |
| Mode M0 | |||
|---|---|---|---|
| Quadrant | BADHDUFLAG | Total packets | Discarded packets |
| A | 0 | 1162 | 2 |
| B | 0 | 1195 | 1 |
| C | 0 | 1170 | 1 |
| D | 0 | 1203 | 1 |
| Mode SS | |||
|---|---|---|---|
| Quadrant | BADHDUFLAG | Total packets | Discarded packets |
| A | 0 | 12 | 0 |
| B | 0 | 12 | 0 |
| C | 0 | 12 | 0 |
| D | 0 | 12 | 0 |
| Quadrant | Total seconds | Saturated seconds | Saturation percentage |
|---|---|---|---|
| A | 521 | 37 | 7.101727% |
| B | 521 | 55 | 10.556622% |
| C | 521 | 21 | 4.030710% |
| D | 521 | 33 | 6.333973% |
Noise dominated data is calculated using 1-second bins in cleaned event files. If a bin has >2000 counts, and if more than 50% of those come from <1% of pixels, then it is considered to be noise-dominated and hence unusable.
| Quadrant | # 1 sec bins | Bins with >0 counts | Bins with >2000 counts | High rate bins dominated by noise | Noise dominated (total time) | Noise dominated (detector-on time) | Marked lightcurve |
|---|---|---|---|---|---|---|---|
| A | 926 | 523 | 0 | 0 | 0.00% | 0.00% | 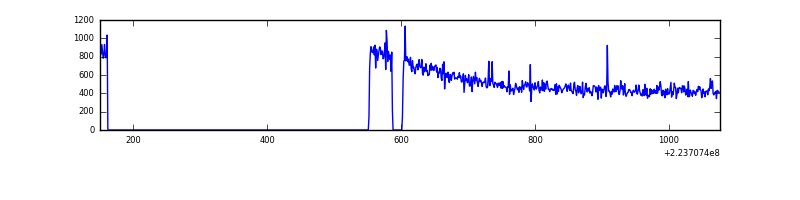 |
| B | 926 | 523 | 2 | 2 | 0.22% | 0.38% | 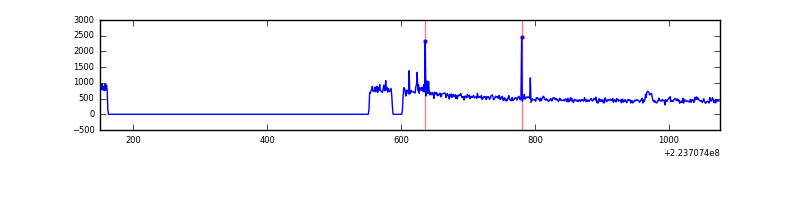 |
| C | 926 | 523 | 0 | 0 | 0.00% | 0.00% | 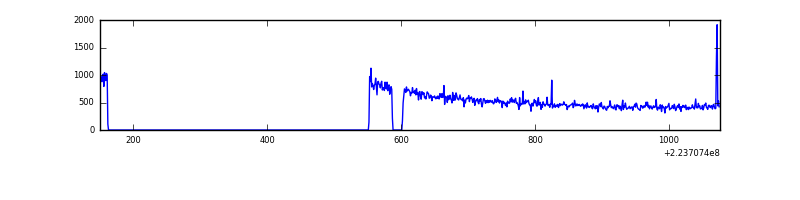 |
| D | 926 | 523 | 0 | 0 | 0.00% | 0.00% | 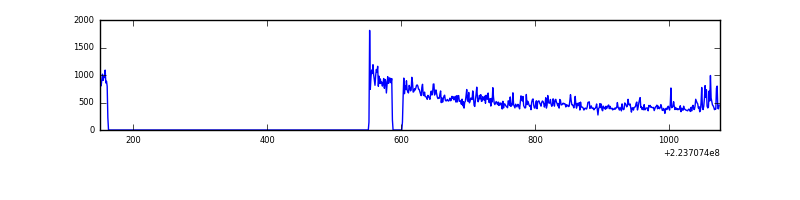 |
Top three noisy pixels from each quadrant. If the there are fewer than three noisy pixels in the level2.evt file, extra rows are filled as -1
| Pixel properties | Quadrant properties | ||||||
|---|---|---|---|---|---|---|---|
| Quadrant | DetID | PixID | Counts | Sigma | Mean | Median | Sigma |
| A | 8 | 15 | 6378 | 381.54 | 68 | 66 | 16.5 |
| A | 15 | 239 | 994 | 56.1 | 68 | 66 | 16.5 |
| A | 0 | 226 | 628 | 33.97 | 68 | 66 | 16.5 |
| B | 4 | 81 | 14534 | 911.71 | 69 | 67 | 15.9 |
| B | 12 | 111 | 1543 | 93.02 | 69 | 67 | 15.9 |
| B | 11 | 111 | 1191 | 70.83 | 69 | 67 | 15.9 |
| C | 9 | 68 | 6733 | 368.35 | 67 | 67 | 18.1 |
| C | 1 | 16 | 898 | 45.92 | 67 | 67 | 18.1 |
| C | 7 | 159 | 843 | 42.88 | 67 | 67 | 18.1 |
| D | 2 | 216 | 24701 | 1345.92 | 66 | 63 | 18.3 |
| D | 12 | 221 | 2981 | 159.4 | 66 | 63 | 18.3 |
| D | 3 | 238 | 1461 | 76.37 | 66 | 63 | 18.3 |
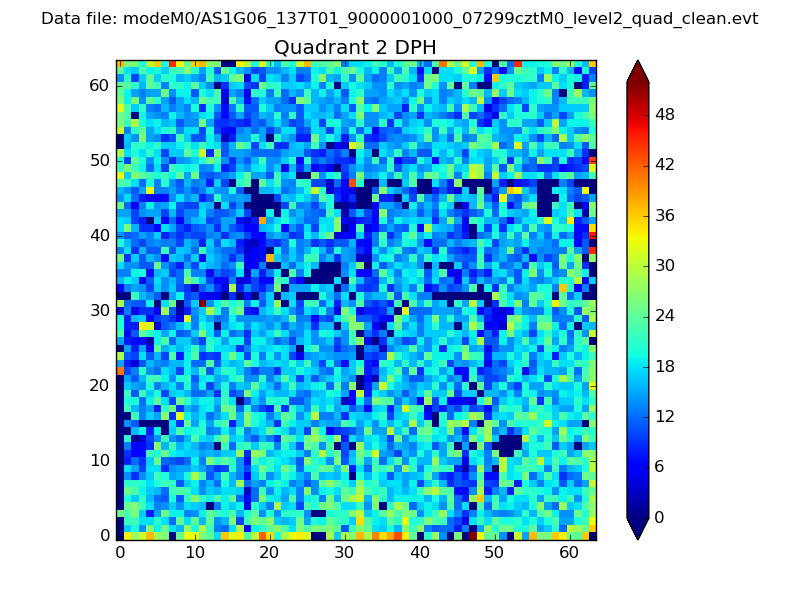
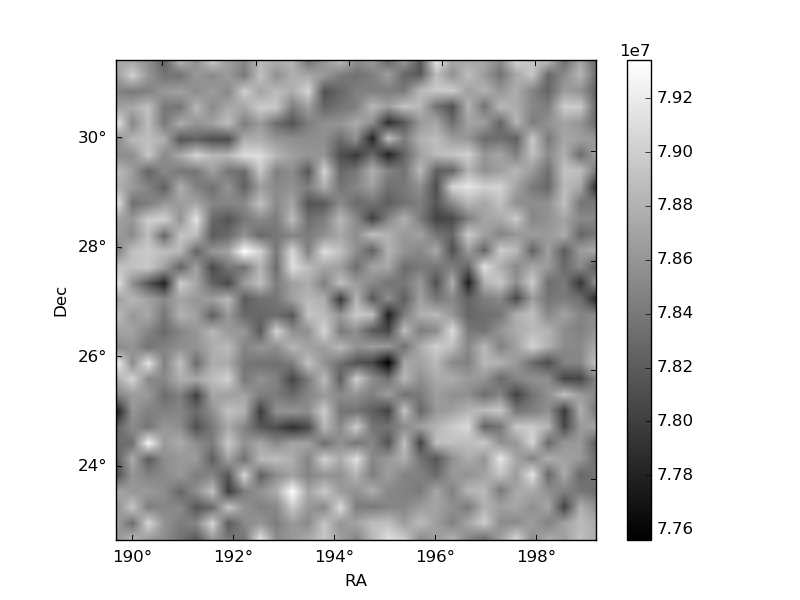
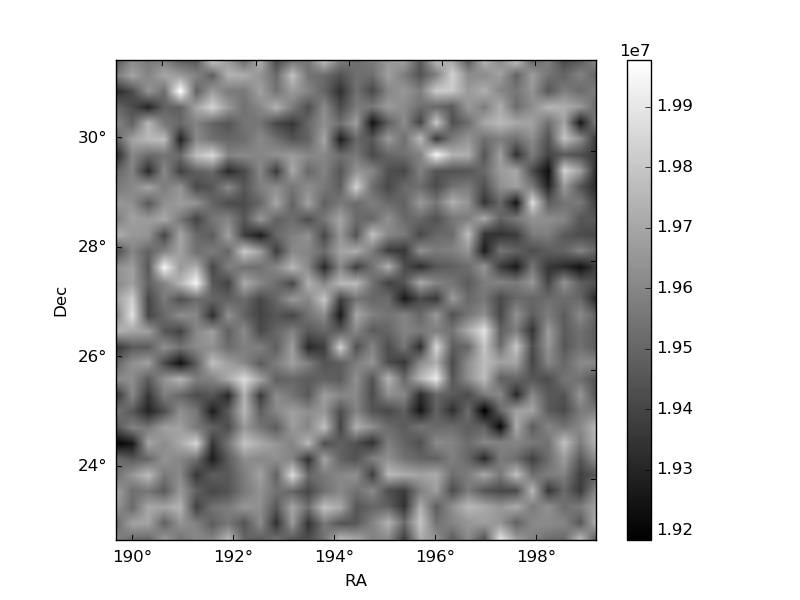
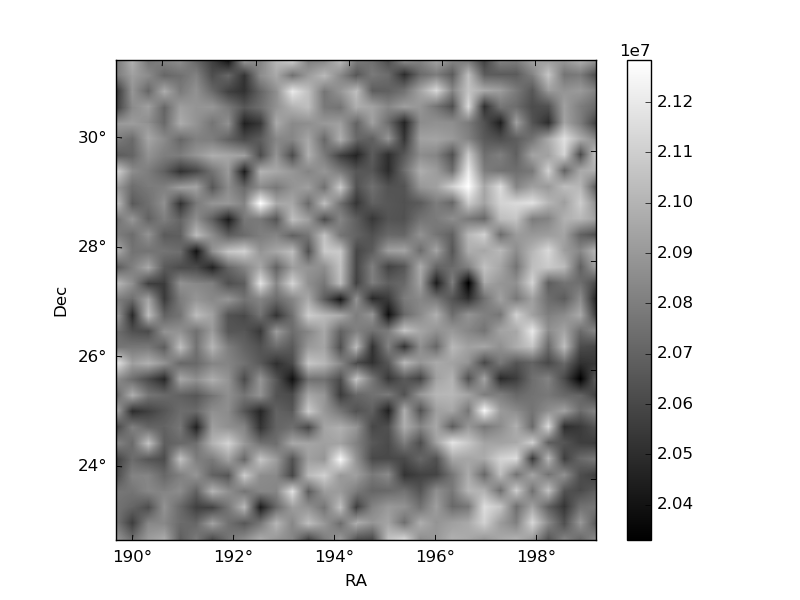
Histogram calculated using DETX and DETY for each event in the final _common_clean file
| Quadrant A | 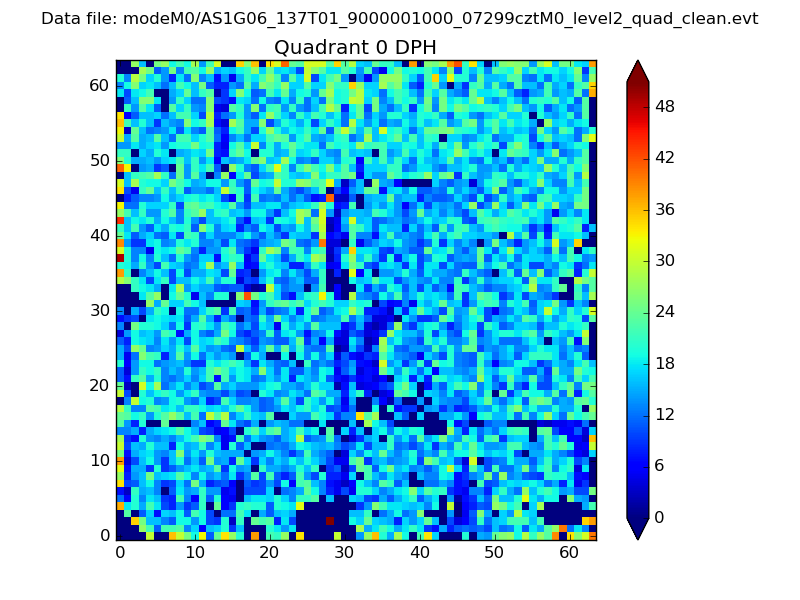 |
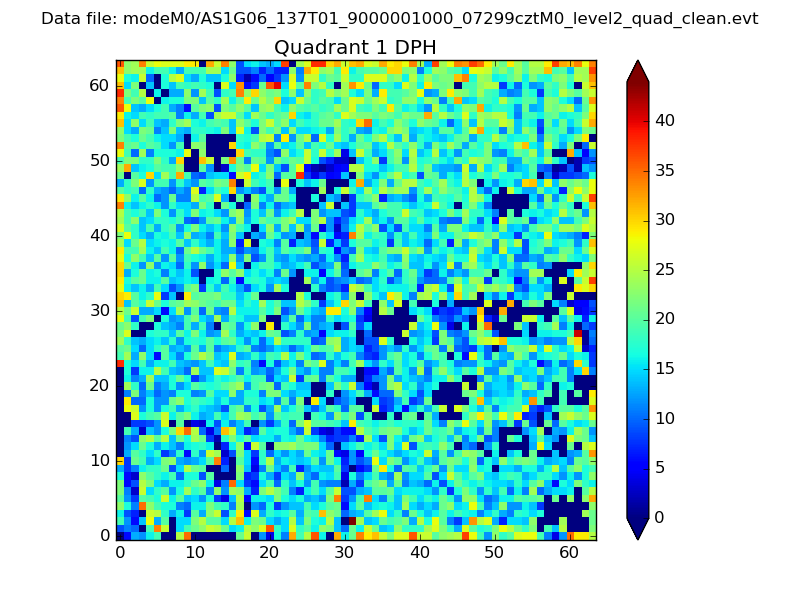 |
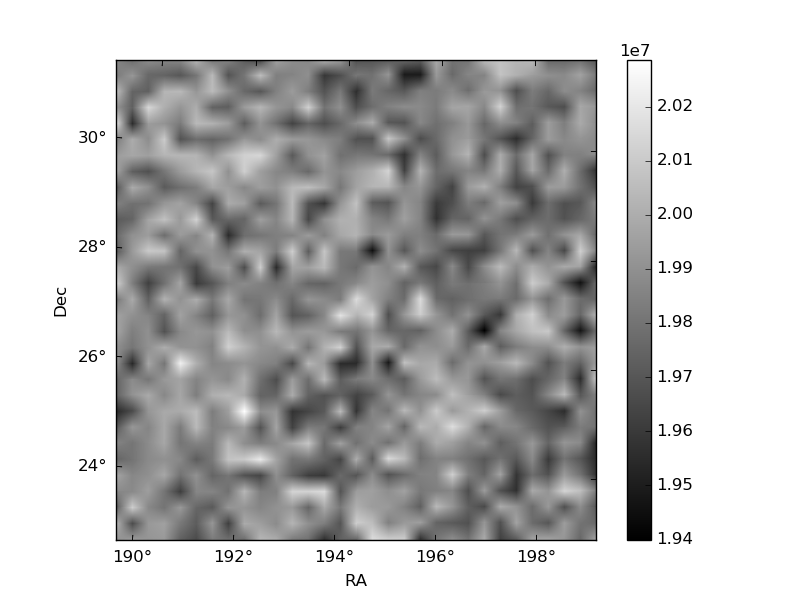
Quadrant B |
|---|---|---|---|
| Quadrant D | 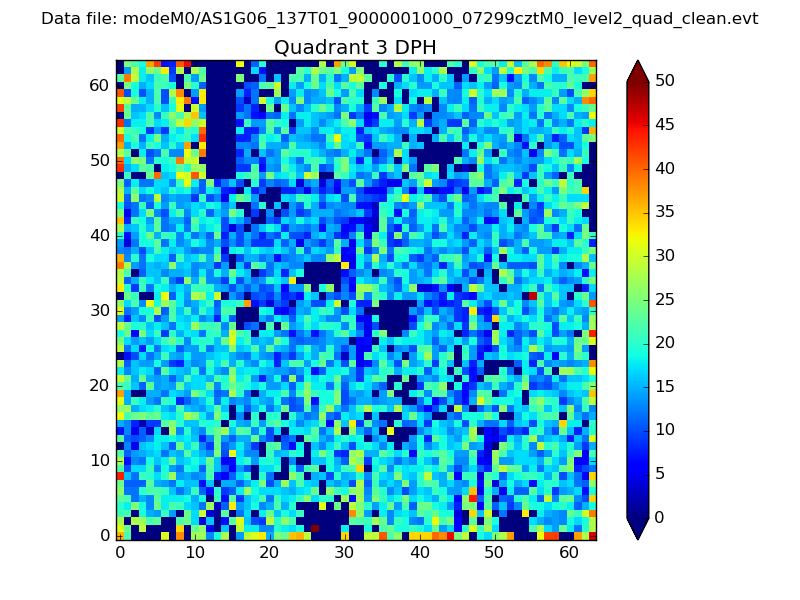 |
 |
Quadrant C |
| Plot type | Count rate plots | Images |
|---|---|---|
| Comparison with Poisson distribution Blue bars denote a histogram of data divided into 1 sec bins. Red curve is a Poisson curve with rate = median count rate of data. |
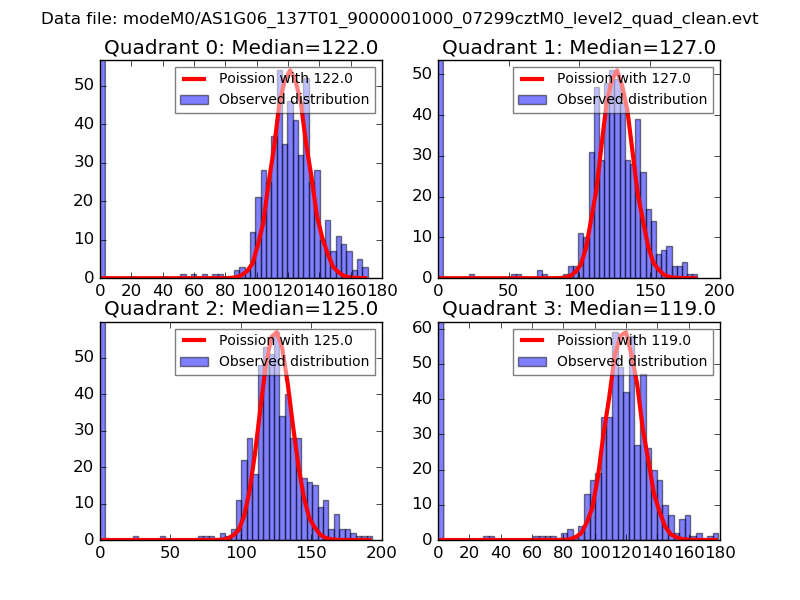 |
 |
| Quadrant-wise count rates Data is divided into 100 sec bins |
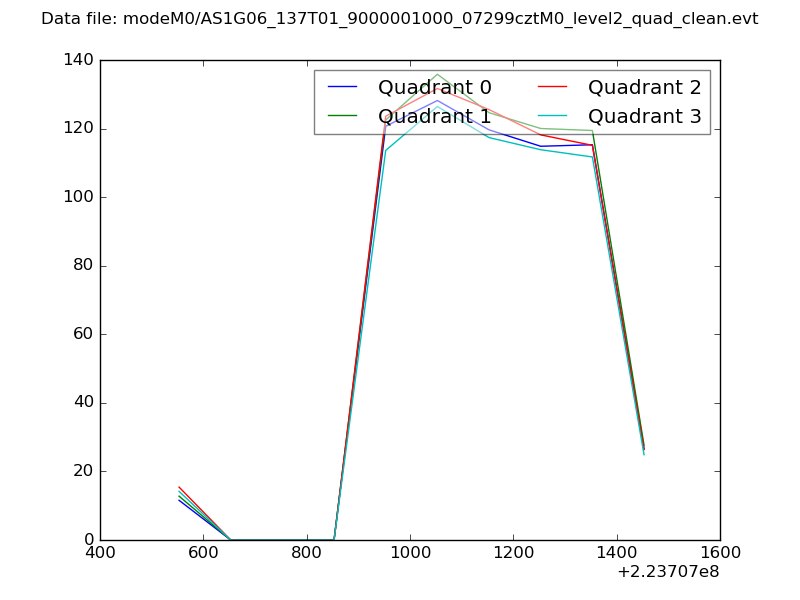 |
|
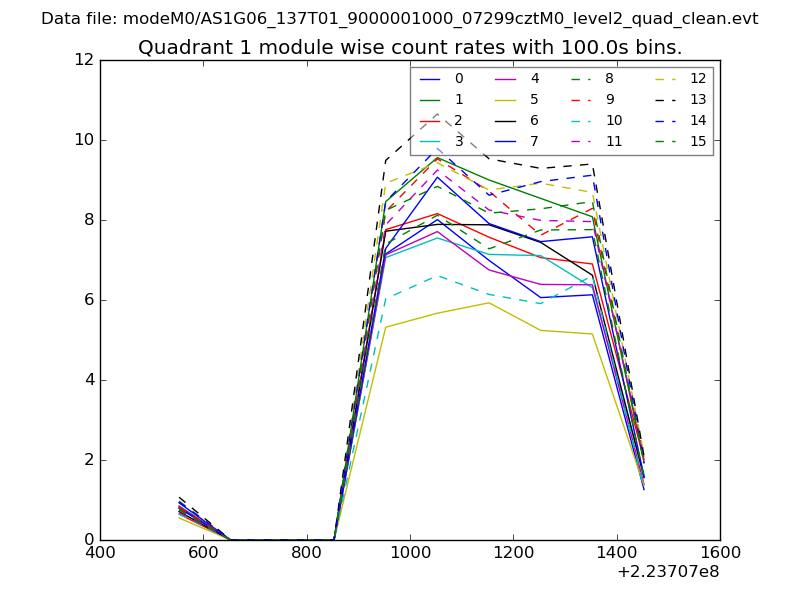
| Module-wise count rates for Quadrant A Data is divided into 100 sec bins |
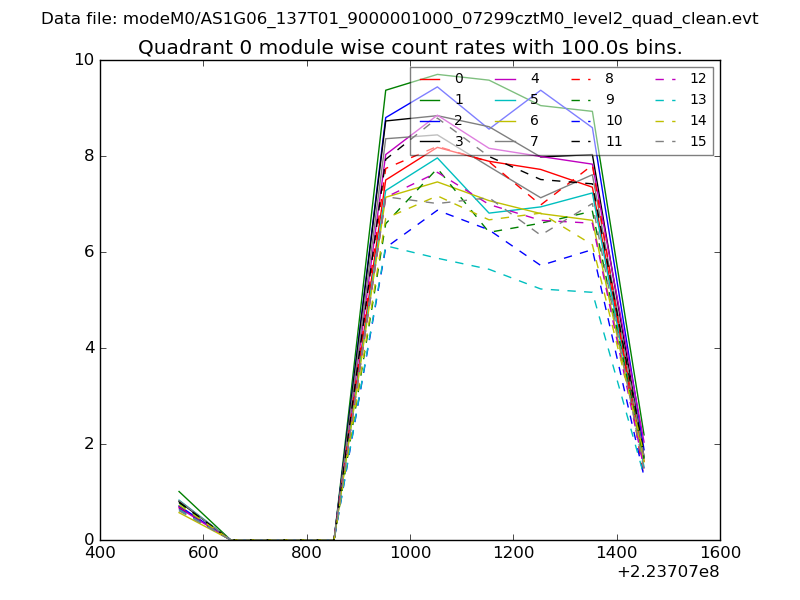 |
 |
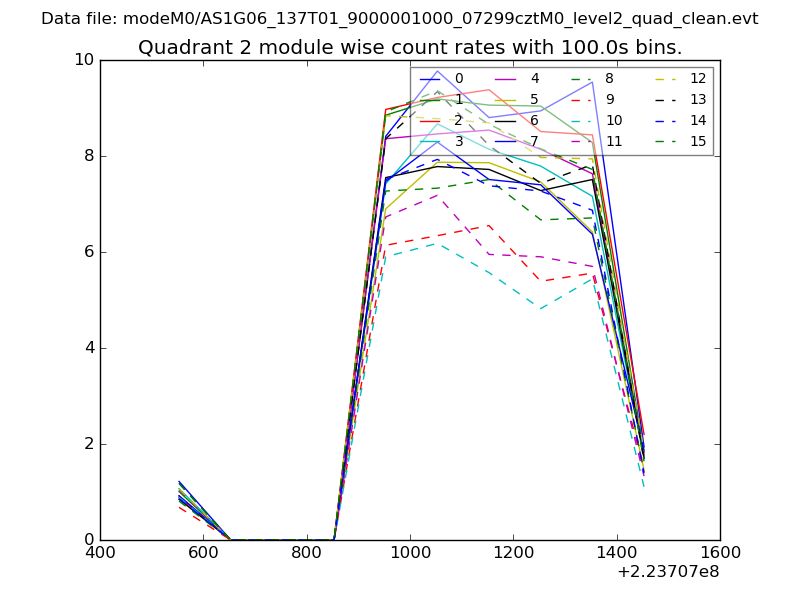
| Module-wise count rates for Quadrant B Data is divided into 100 sec bins |
 |
 |
| Module-wise count rates for Quadrant C Data is divided into 100 sec bins |
 |
 |
| Module-wise count rates for Quadrant D Data is divided into 100 sec bins |
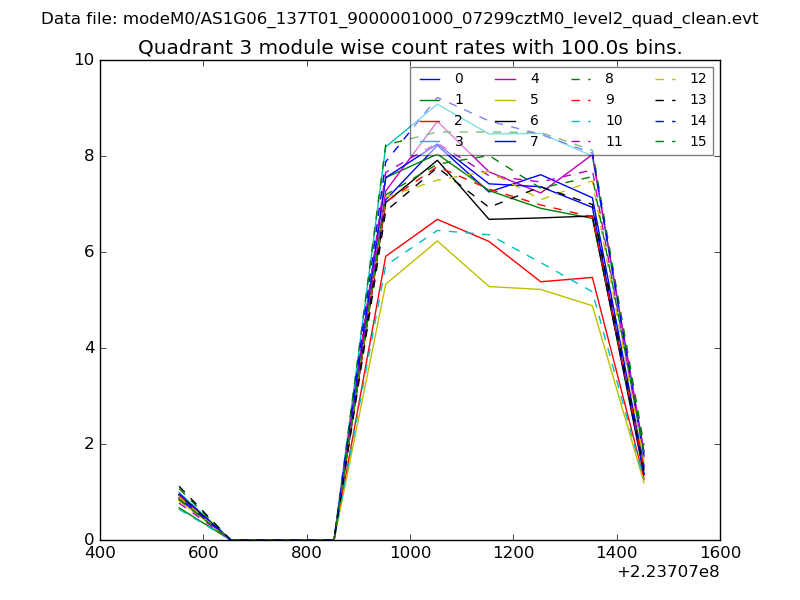 |
 |
| Parameter | Plot |
|---|---|
| CZT HV Monitor | 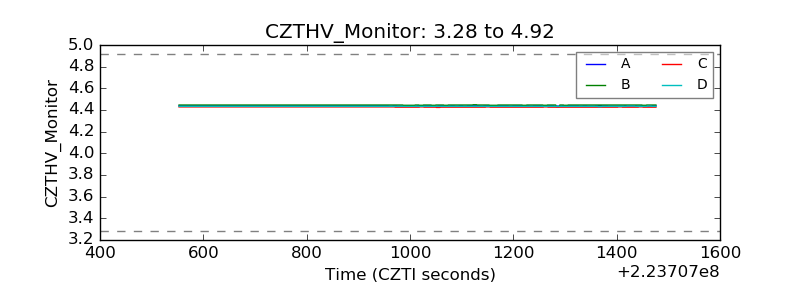 |
| D_VDD | 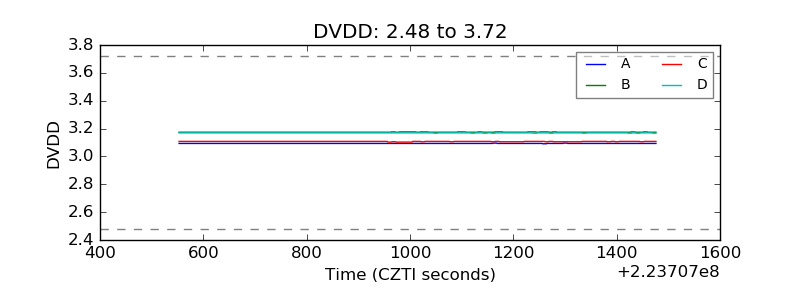 |
| Temperature 1 | 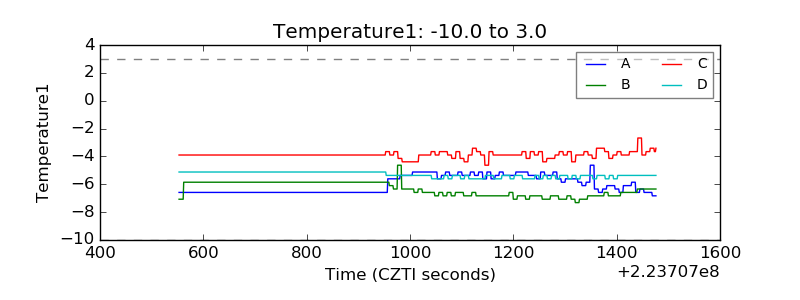 |
| Veto HV Monitor | 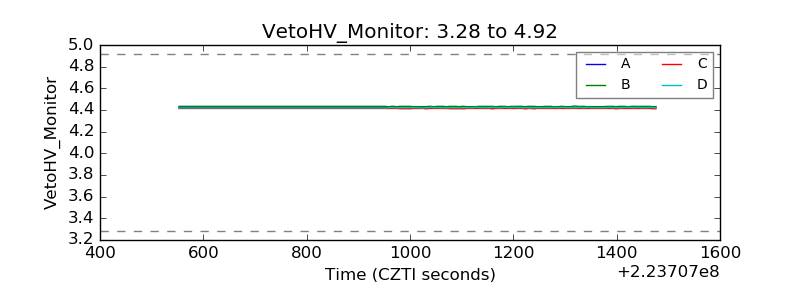 |
| Veto LLD | 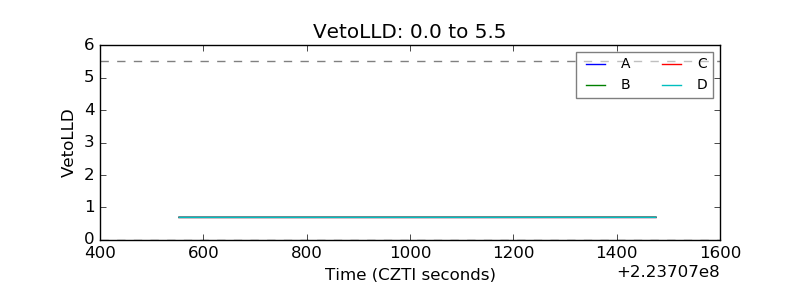 |
| Alpha Counter | 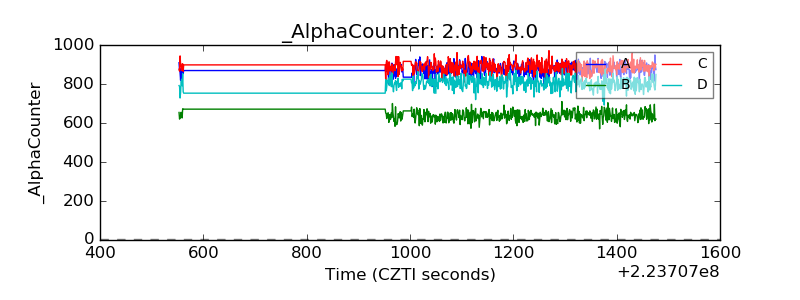 |
| _CPM_Rate | 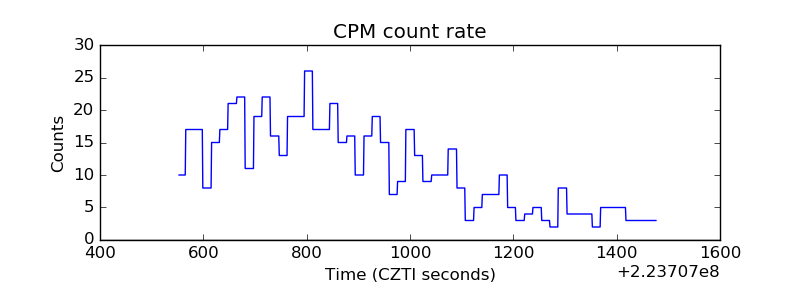 |
| CZT Counter |  |
| +2.5 Volts monitor |  |
| +5 Volts monitor |  |
| _ROLL_ROT | 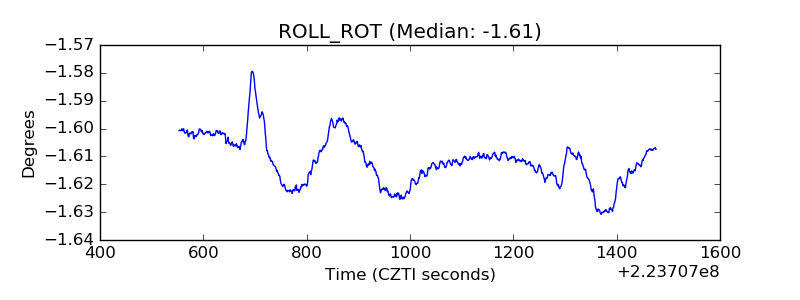 |
| _Roll_DEC | 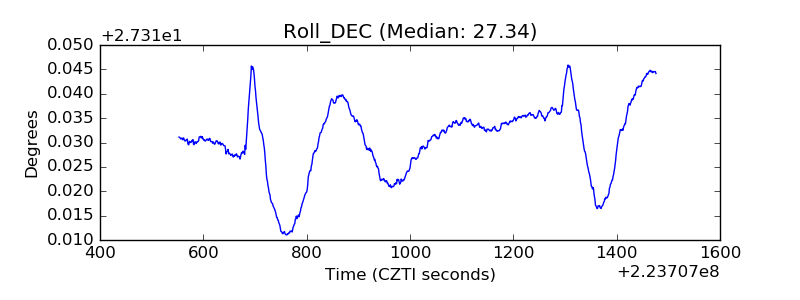 |
| _Roll_RA |  |
| Veto Counter | 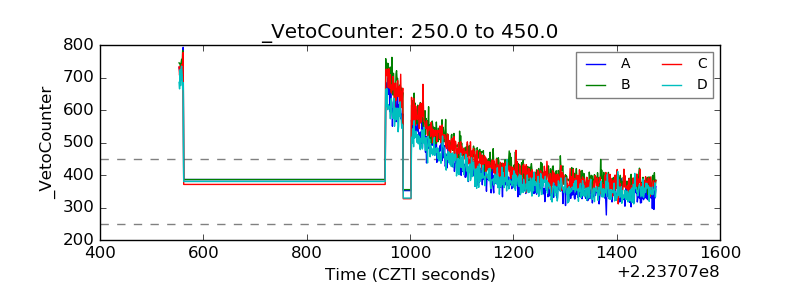 |