| Param | Original file | Final file |
|---|---|---|
| Filename | modeM0/AS1G06_137T01_9000001000_07300cztM0_level2.fits | modeM0/AS1G06_137T01_9000001000_07300cztM0_level2_quad_clean.evt |
| Size (bytes) | 619,456,320 | 111,637,440 |
| Size | 590.8 MB | 106.5 MB |
| Events in quadrant A | 5,569,455 | 666,152 |
| Events in quadrant B | 5,286,829 | 689,294 |
| Events in quadrant C | 5,499,294 | 654,612 |
| Events in quadrant D | 5,710,941 | 601,112 |
| Mode M9 | |||
|---|---|---|---|
| Quadrant | BADHDUFLAG | Total packets | Discarded packets |
| A | 0 | 5 | 0 |
| B | 0 | 5 | 0 |
| C | 0 | 5 | 0 |
| D | 0 | 5 | 0 |
| Mode M0 | |||
|---|---|---|---|
| Quadrant | BADHDUFLAG | Total packets | Discarded packets |
| A | 0 | 24311 | 146 |
| B | 0 | 23405 | 180 |
| C | 0 | 24204 | 139 |
| D | 0 | 25331 | 158 |
| Mode SS | |||
|---|---|---|---|
| Quadrant | BADHDUFLAG | Total packets | Discarded packets |
| A | 0 | 226 | 2 |
| B | 0 | 226 | 2 |
| C | 0 | 226 | 2 |
| D | 0 | 226 | 4 |
| Quadrant | Total seconds | Saturated seconds | Saturation percentage |
|---|---|---|---|
| A | 11118 | 339 | 3.049110% |
| B | 11111 | 193 | 1.737017% |
| C | 11121 | 161 | 1.447712% |
| D | 11116 | 257 | 2.311983% |
Noise dominated data is calculated using 1-second bins in cleaned event files. If a bin has >2000 counts, and if more than 50% of those come from <1% of pixels, then it is considered to be noise-dominated and hence unusable.
| Quadrant | # 1 sec bins | Bins with >0 counts | Bins with >2000 counts | High rate bins dominated by noise | Noise dominated (total time) | Noise dominated (detector-on time) | Marked lightcurve |
|---|---|---|---|---|---|---|---|
| A | 11596 | 11141 | 130 | 130 | 1.12% | 1.17% | 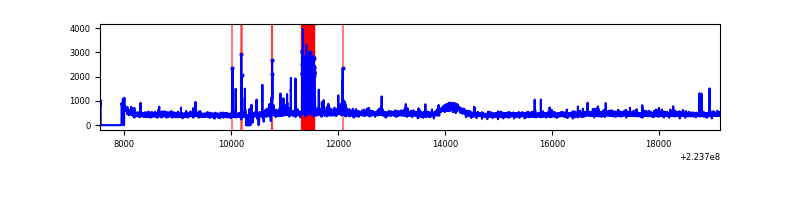 |
| B | 11596 | 11140 | 9 | 9 | 0.08% | 0.08% | 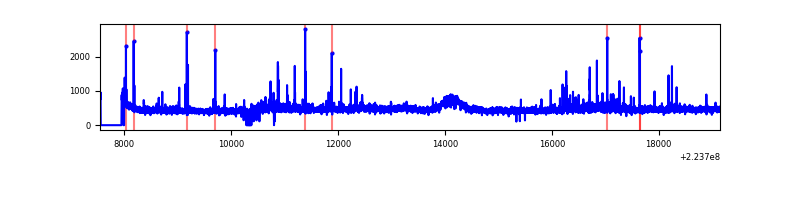 |
| C | 11596 | 11147 | 82 | 82 | 0.71% | 0.74% | 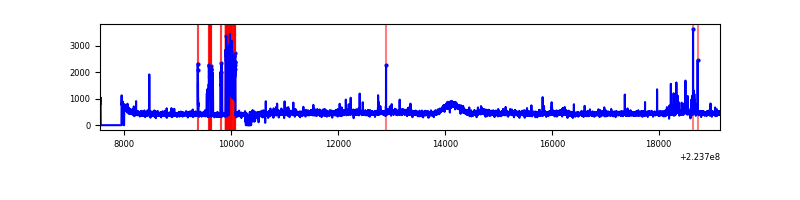 |
| D | 11596 | 11147 | 91 | 91 | 0.78% | 0.82% | 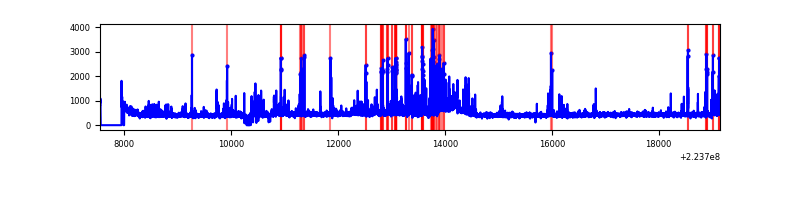 |
Top three noisy pixels from each quadrant. If the there are fewer than three noisy pixels in the level2.evt file, extra rows are filled as -1
| Pixel properties | Quadrant properties | ||||||
|---|---|---|---|---|---|---|---|
| Quadrant | DetID | PixID | Counts | Sigma | Mean | Median | Sigma |
| A | 15 | 234 | 353296 | 1328.03 | 1287 | 1257 | 265.1 |
| A | 8 | 15 | 187881 | 704.02 | 1287 | 1257 | 265.1 |
| A | 15 | 239 | 31396 | 113.69 | 1287 | 1257 | 265.1 |
| B | 0 | 214 | 153677 | 612.23 | 1302 | 1270 | 248.9 |
| B | 4 | 81 | 68148 | 268.65 | 1302 | 1270 | 248.9 |
| B | 12 | 111 | 25928 | 99.05 | 1302 | 1270 | 248.9 |
| C | 9 | 68 | 536219 | 1842.26 | 1255 | 1261 | 290.4 |
| C | 7 | 247 | 38248 | 127.37 | 1255 | 1261 | 290.4 |
| C | 1 | 16 | 28428 | 93.56 | 1255 | 1261 | 290.4 |
| D | 2 | 216 | 379389 | 1223.1 | 1254 | 1214 | 309.2 |
| D | 2 | 14 | 316285 | 1019.01 | 1254 | 1214 | 309.2 |
| D | 12 | 233 | 123740 | 396.28 | 1254 | 1214 | 309.2 |
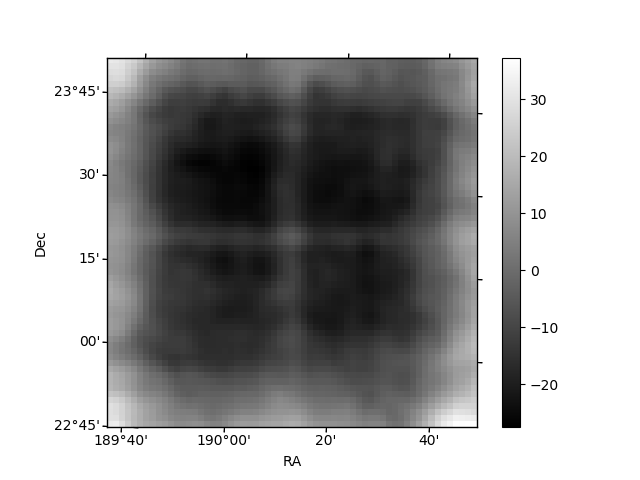
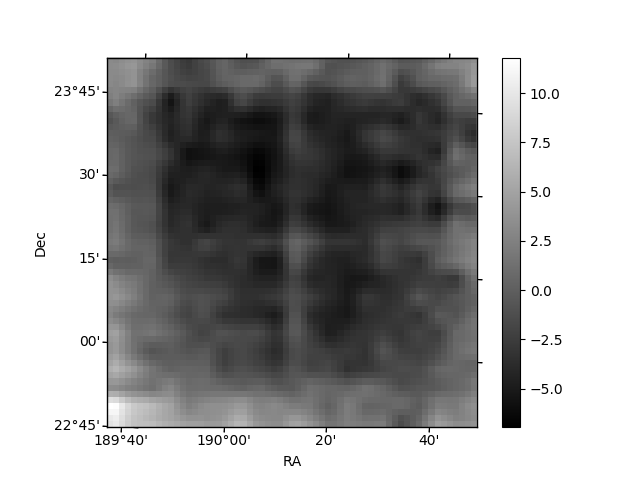
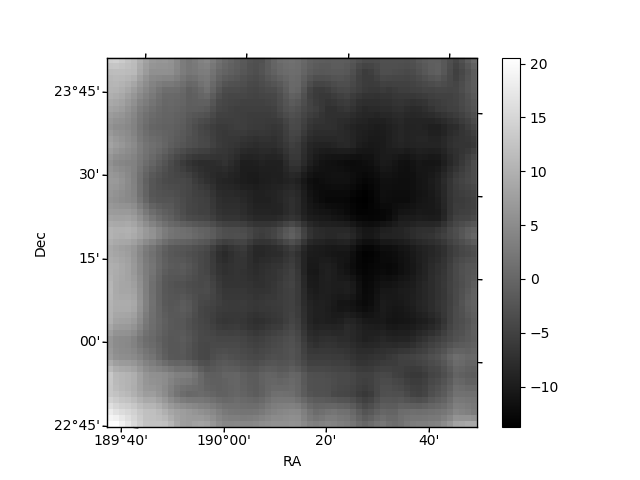
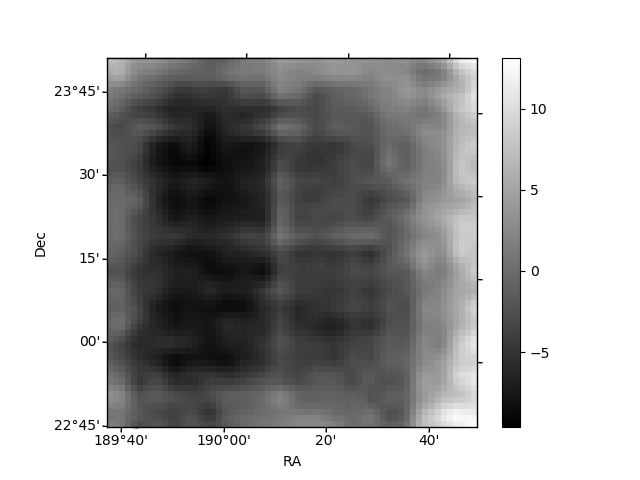
Histogram calculated using DETX and DETY for each event in the final _common_clean file
| Quadrant A | 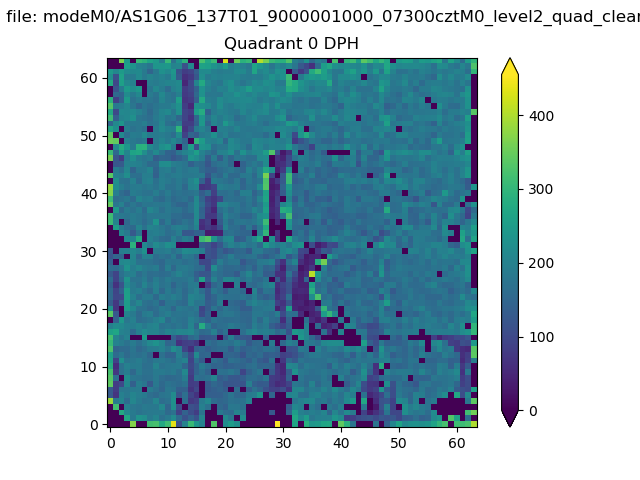 |
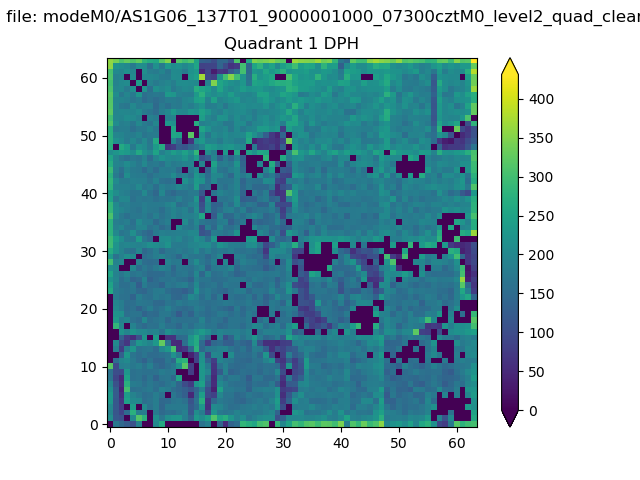 |
Quadrant B |
|---|---|---|---|
| Quadrant D | 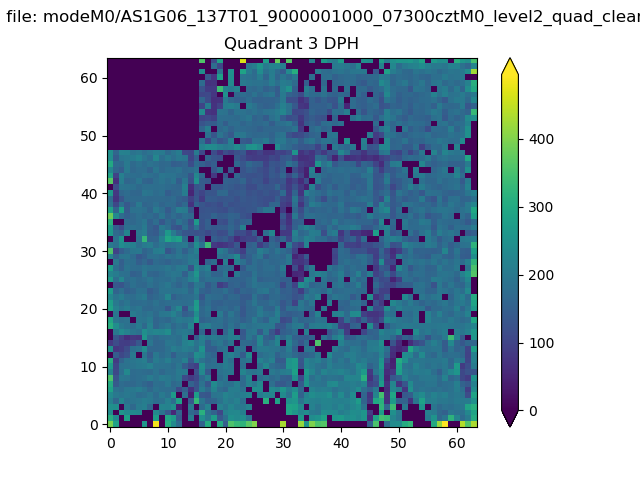 |
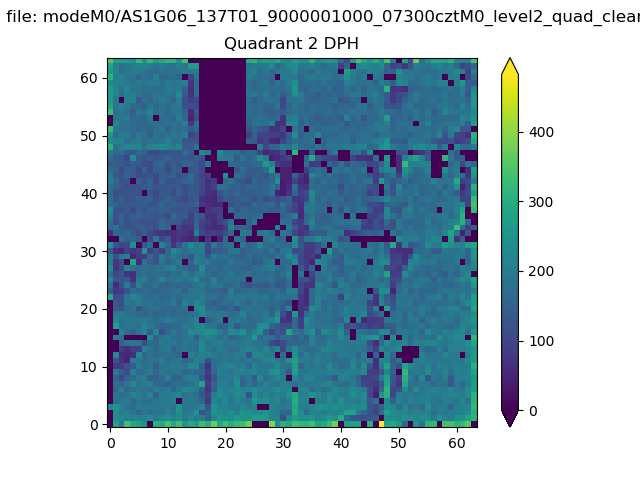 |
Quadrant C |
| Plot type | Count rate plots | Images |
|---|---|---|
| Comparison with Poisson distribution Blue bars denote a histogram of data divided into 1 sec bins. Red curve is a Poisson curve with rate = median count rate of data. |
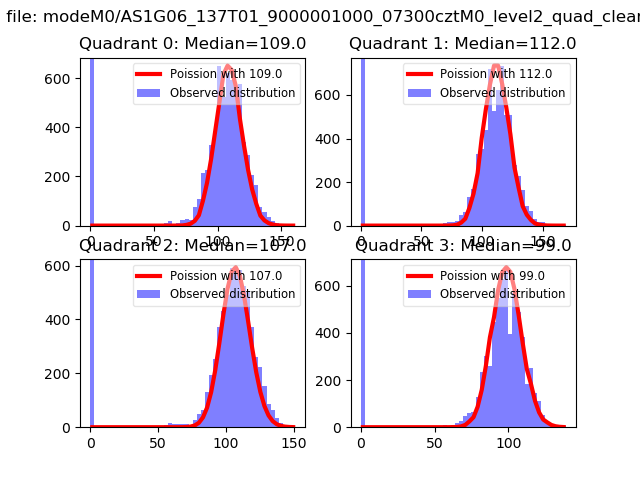 |
 |
| Quadrant-wise count rates Data is divided into 100 sec bins |
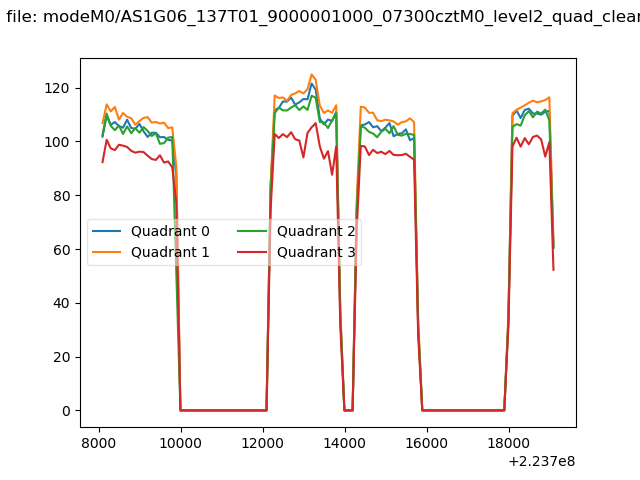 |
|
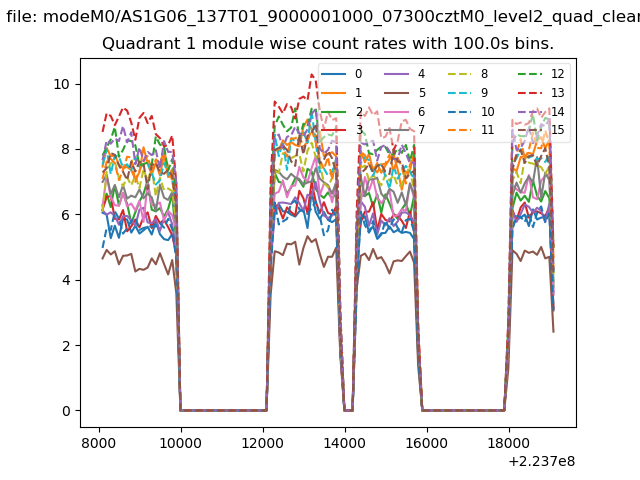
| Module-wise count rates for Quadrant A Data is divided into 100 sec bins |
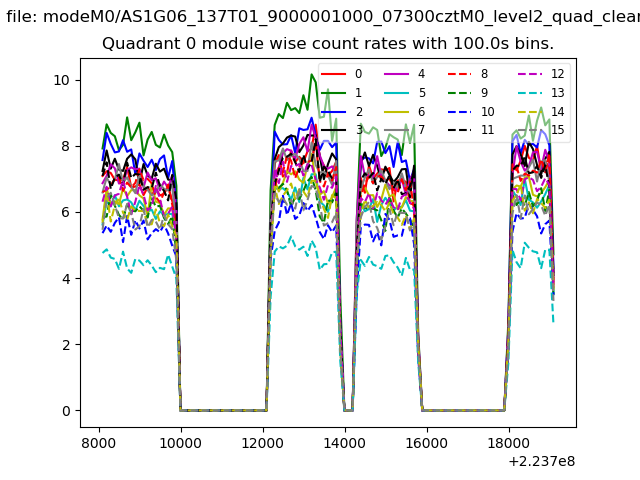 |
 |
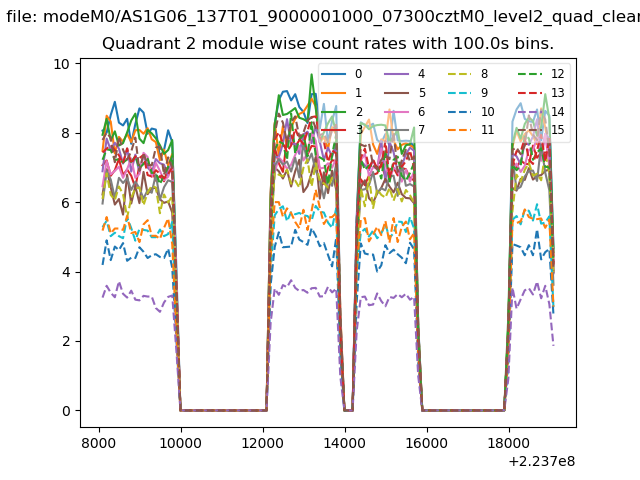
| Module-wise count rates for Quadrant B Data is divided into 100 sec bins |
 |
 |
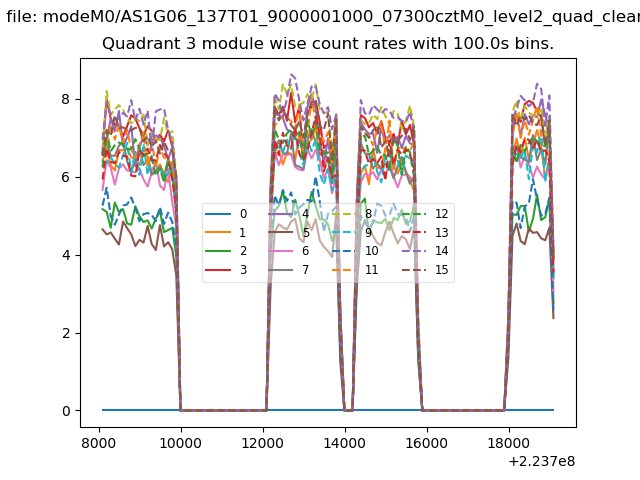
| Module-wise count rates for Quadrant C Data is divided into 100 sec bins |
 |
 |
| Module-wise count rates for Quadrant D Data is divided into 100 sec bins |
 |
 |
| Parameter | Plot |
|---|---|
| CZT HV Monitor | 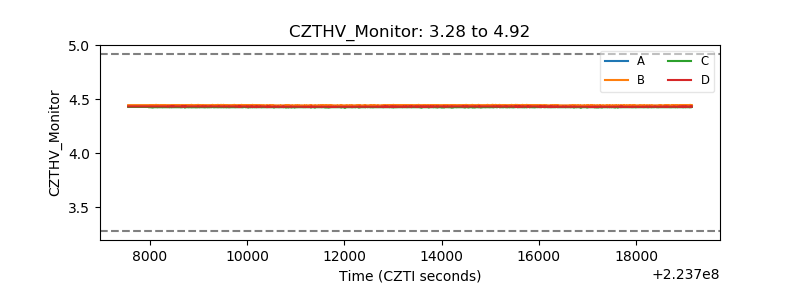 |
| D_VDD | 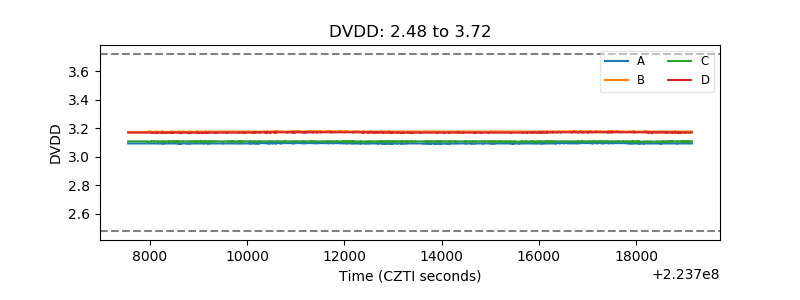 |
| Temperature 1 | 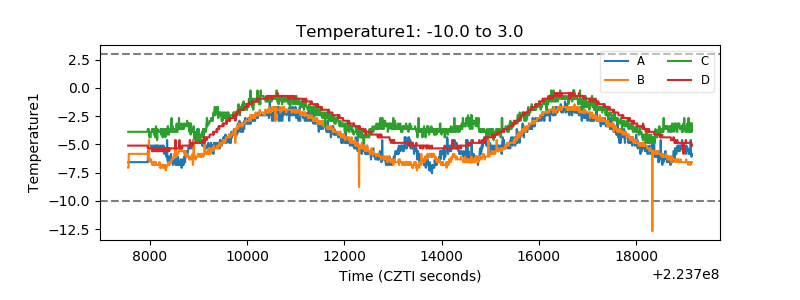 |
| Veto HV Monitor | 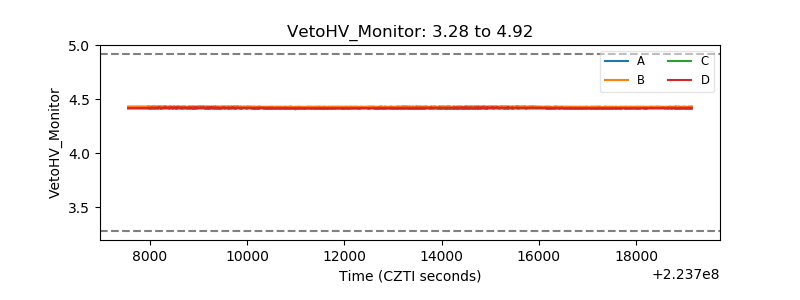 |
| Veto LLD | 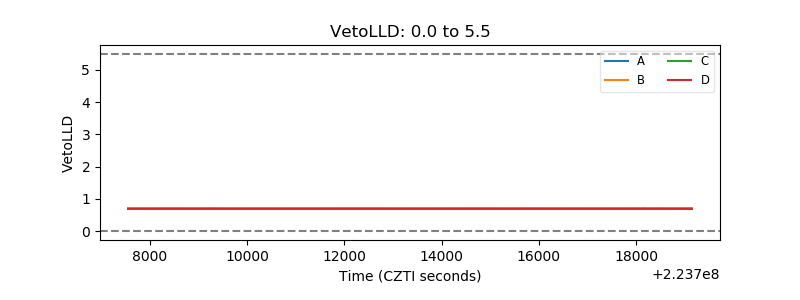 |
| Alpha Counter | 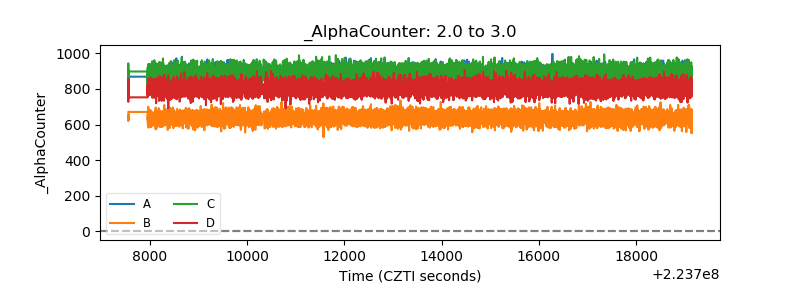 |
| _CPM_Rate | 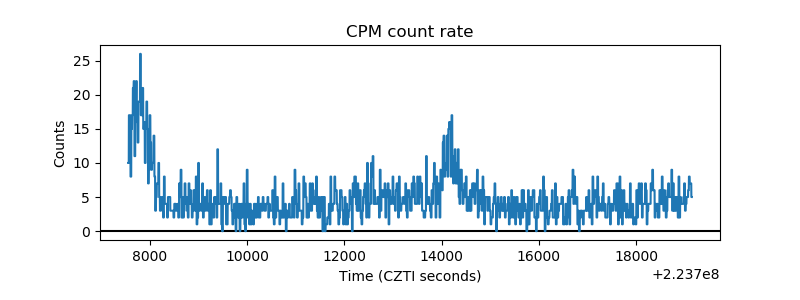 |
| CZT Counter |  |
| +2.5 Volts monitor |  |
| +5 Volts monitor |  |
| _ROLL_ROT | 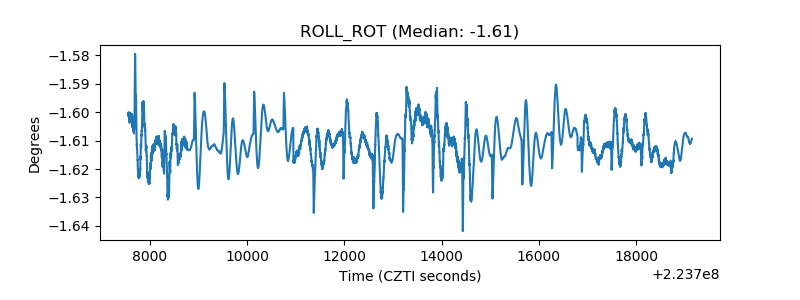 |
| _Roll_DEC | 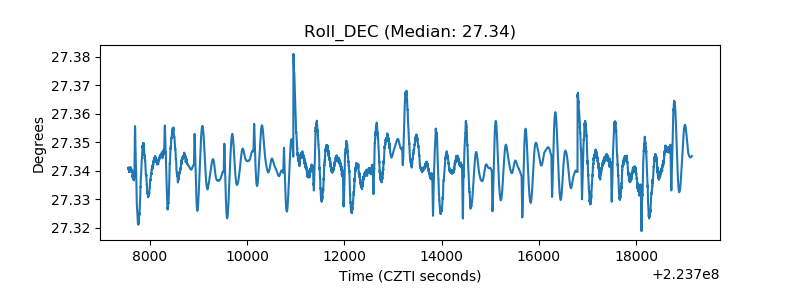 |
| _Roll_RA | 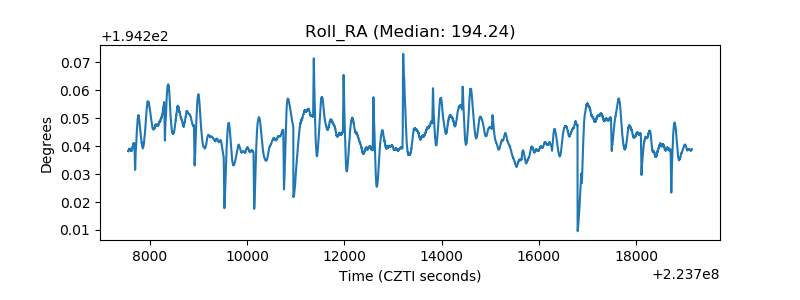 |
| Veto Counter | 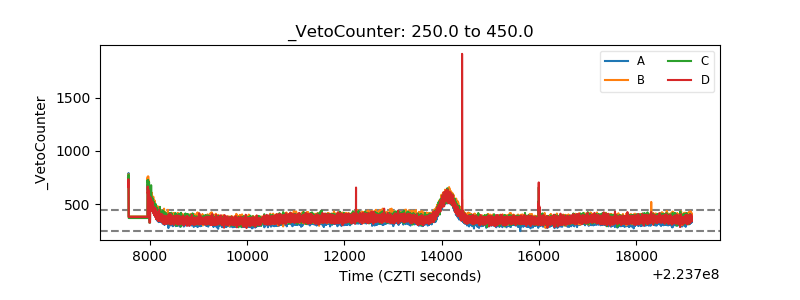 |