| Param | Original file | Final file |
|---|---|---|
| Filename | modeM0/AS1G06_154T04_9000000998_07285cztM0_level2.evt | modeM0/AS1G06_154T04_9000000998_07285cztM0_level2_quad_clean.evt |
| Size (bytes) | 212,898,240 | 47,813,760 |
| Size | 203.0 MB | 45.6 MB |
| Events in quadrant A | 1,528,553 | 306,486 |
| Events in quadrant B | 1,533,927 | 315,441 |
| Events in quadrant C | 1,515,371 | 311,646 |
| Events in quadrant D | 1,658,592 | 295,009 |
| Mode SS | |||
|---|---|---|---|
| Quadrant | BADHDUFLAG | Total packets | Discarded packets |
| A | 0 | 62 | 0 |
| B | 0 | 62 | 0 |
| C | 0 | 62 | 0 |
| D | 0 | 62 | 0 |
| Mode M0 | |||
|---|---|---|---|
| Quadrant | BADHDUFLAG | Total packets | Discarded packets |
| A | 0 | 6640 | 1 |
| B | 0 | 6590 | 0 |
| C | 0 | 6651 | 0 |
| D | 0 | 7106 | 0 |
| Quadrant | Total seconds | Saturated seconds | Saturation percentage |
|---|---|---|---|
| A | 3072 | 174 | 5.664062% |
| B | 3072 | 168 | 5.468750% |
| C | 3072 | 120 | 3.906250% |
| D | 3072 | 146 | 4.752604% |
Noise dominated data is calculated using 1-second bins in cleaned event files. If a bin has >2000 counts, and if more than 50% of those come from <1% of pixels, then it is considered to be noise-dominated and hence unusable.
| Quadrant | # 1 sec bins | Bins with >0 counts | Bins with >2000 counts | High rate bins dominated by noise | Noise dominated (total time) | Noise dominated (detector-on time) | Marked lightcurve |
|---|---|---|---|---|---|---|---|
| A | 3072 | 3072 | 0 | 0 | 0.00% | 0.00% | 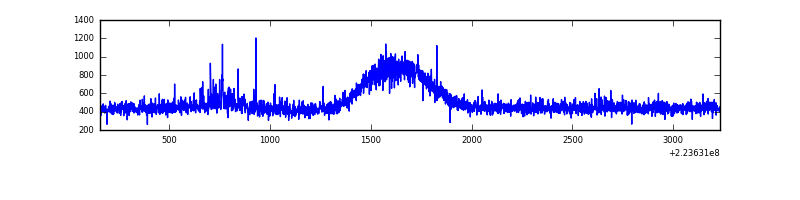 |
| B | 3072 | 3072 | 0 | 0 | 0.00% | 0.00% | 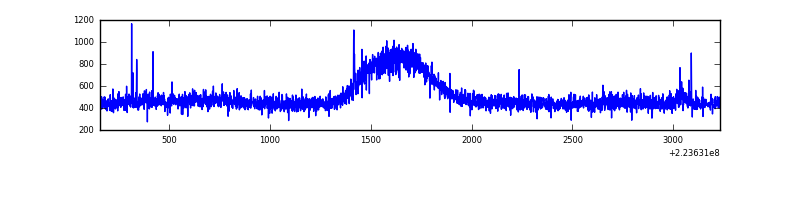 |
| C | 3072 | 3072 | 0 | 0 | 0.00% | 0.00% | 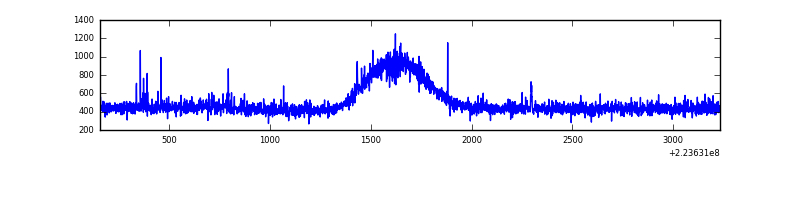 |
| D | 3072 | 3072 | 14 | 14 | 0.46% | 0.46% | 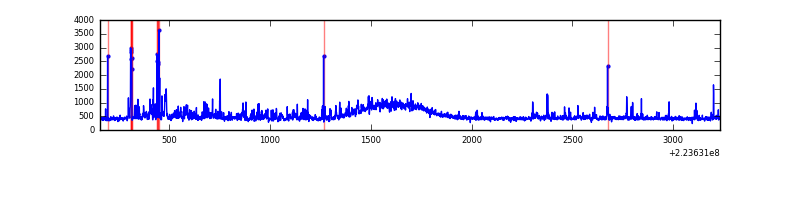 |
Top three noisy pixels from each quadrant. If the there are fewer than three noisy pixels in the level2.evt file, extra rows are filled as -1
| Pixel properties | Quadrant properties | ||||||
|---|---|---|---|---|---|---|---|
| Quadrant | DetID | PixID | Counts | Sigma | Mean | Median | Sigma |
| A | 13 | 248 | 16103 | 188.37 | 392 | 381 | 83.5 |
| A | 0 | 226 | 3657 | 39.25 | 392 | 381 | 83.5 |
| A | 12 | 194 | 3463 | 36.93 | 392 | 381 | 83.5 |
| B | 12 | 111 | 8748 | 104.89 | 393 | 382 | 79.8 |
| B | 11 | 111 | 6900 | 81.72 | 393 | 382 | 79.8 |
| B | 0 | 214 | 5212 | 60.56 | 393 | 382 | 79.8 |
| C | 1 | 16 | 12770 | 134.49 | 383 | 383 | 92.1 |
| C | 9 | 68 | 5522 | 55.79 | 383 | 383 | 92.1 |
| C | 13 | 61 | 2965 | 28.03 | 383 | 383 | 92.1 |
| D | 2 | 216 | 139677 | 1461.56 | 379 | 366 | 95.3 |
| D | 2 | 14 | 74359 | 776.29 | 379 | 366 | 95.3 |
| D | 1 | 52 | 12417 | 126.43 | 379 | 366 | 95.3 |
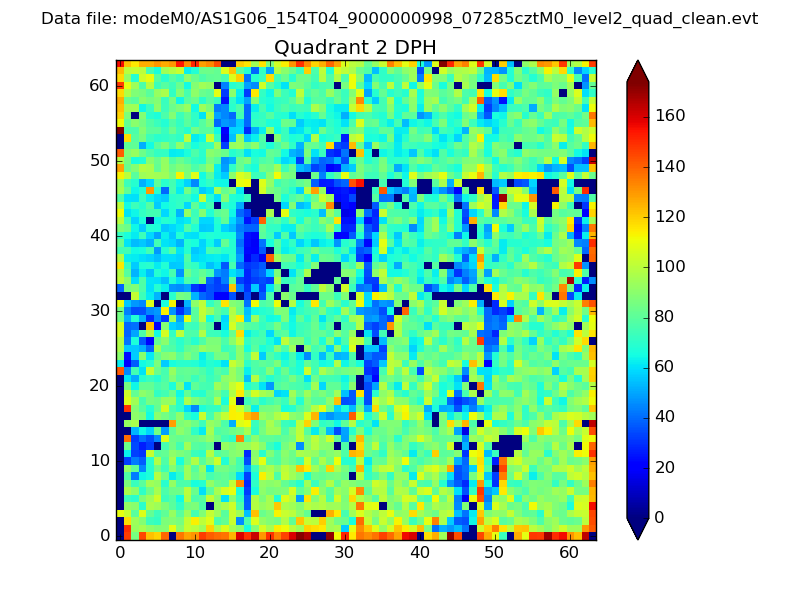
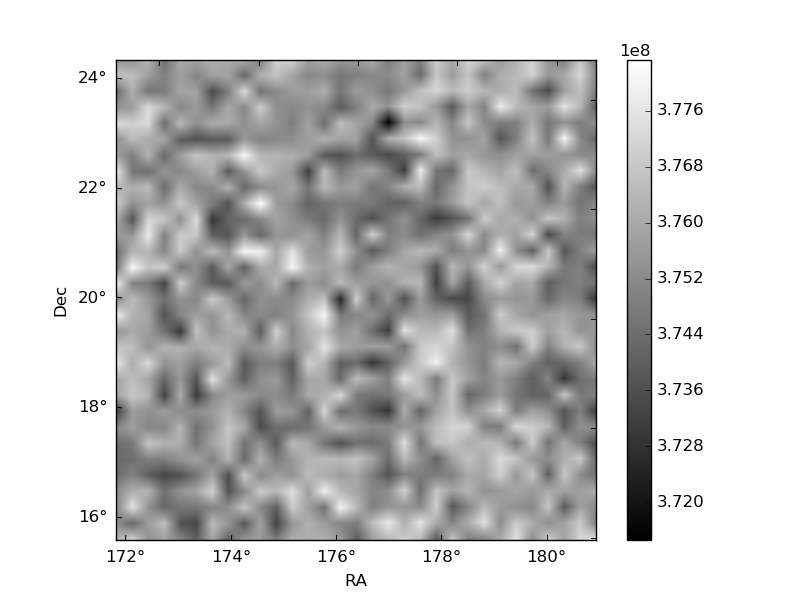
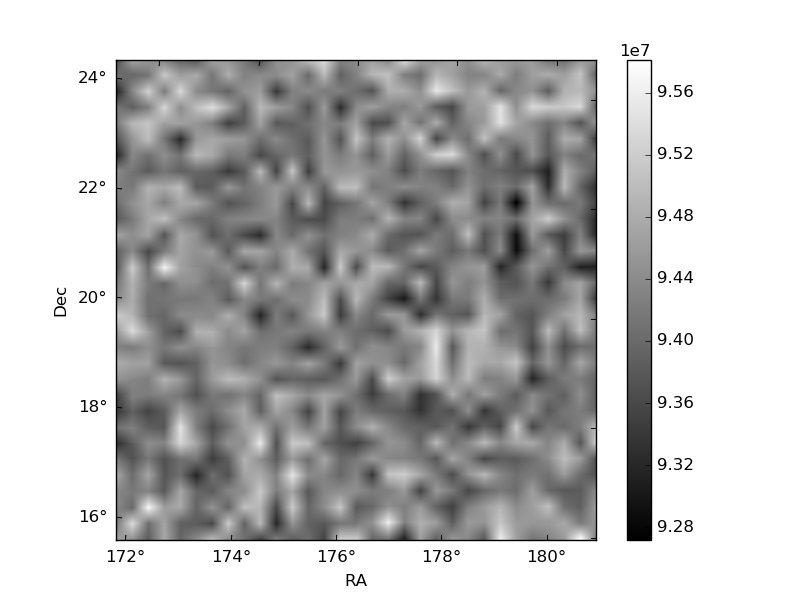
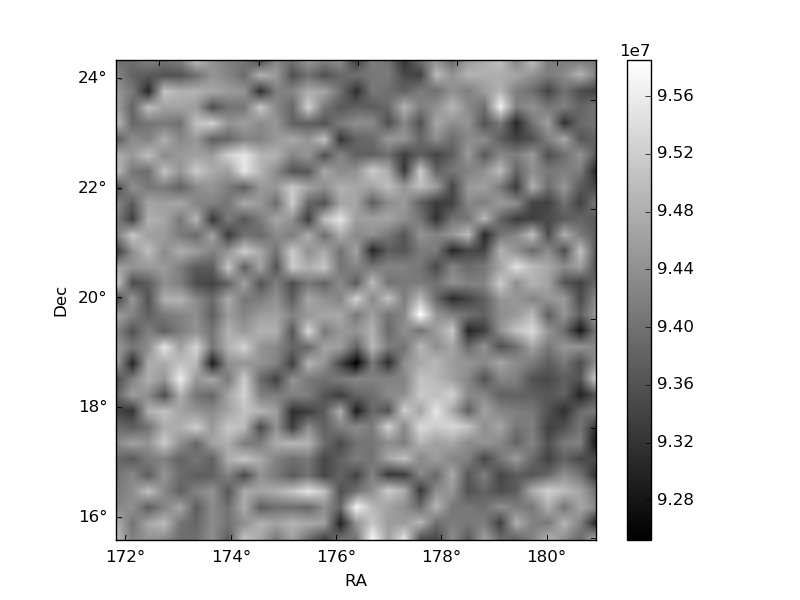
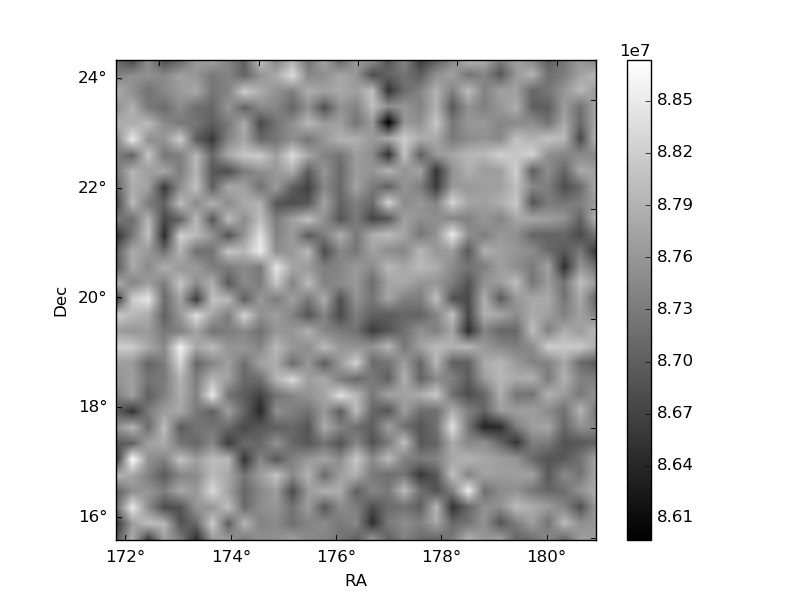
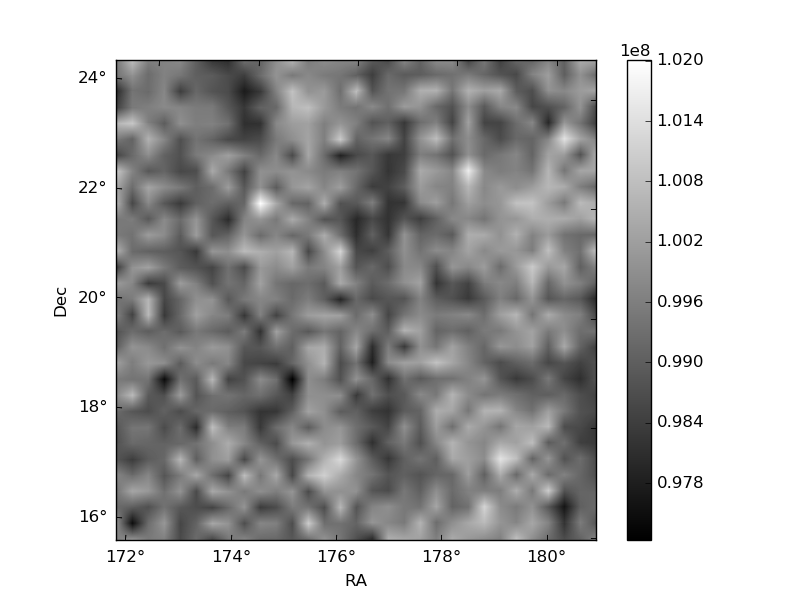
Histogram calculated using DETX and DETY for each event in the final _common_clean file
| Quadrant A | 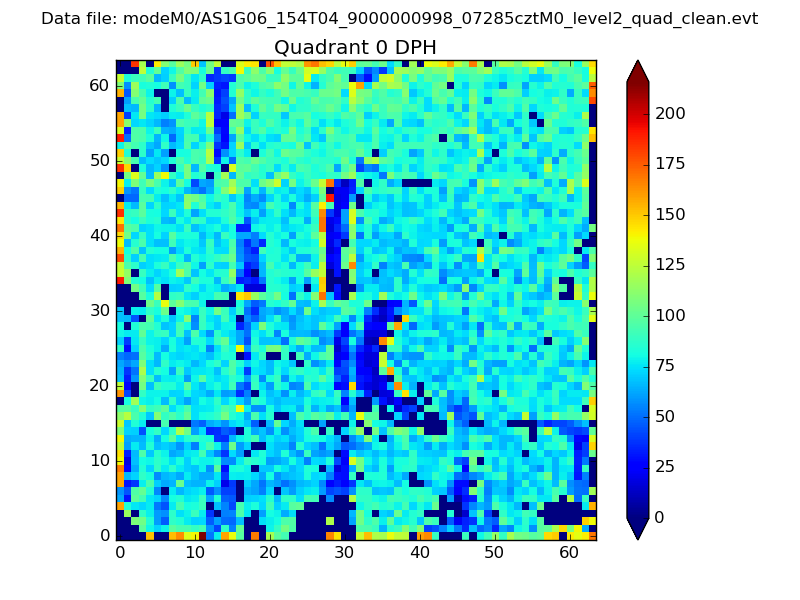 |
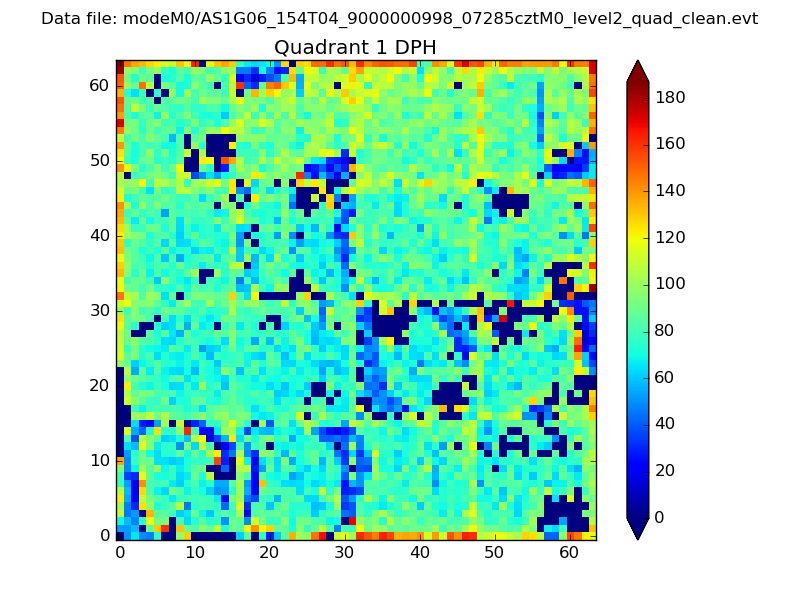 |
Quadrant B |
|---|---|---|---|
| Quadrant D | 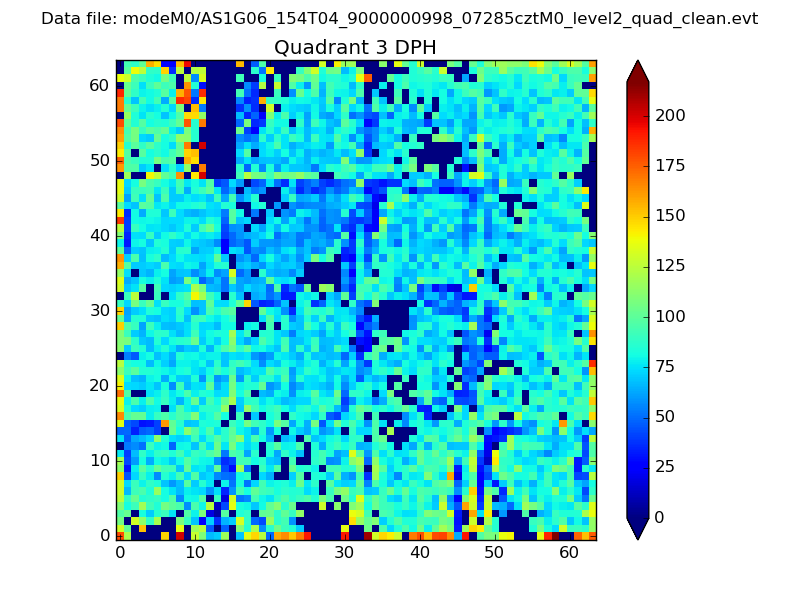 |
 |
Quadrant C |
| Plot type | Count rate plots | Images |
|---|---|---|
| Comparison with Poisson distribution Blue bars denote a histogram of data divided into 1 sec bins. Red curve is a Poisson curve with rate = median count rate of data. |
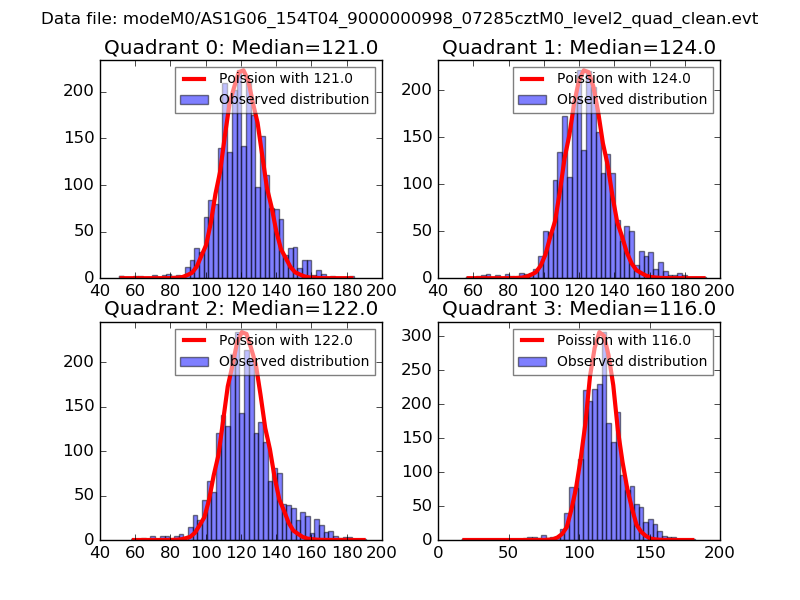 |
 |
| Quadrant-wise count rates Data is divided into 100 sec bins |
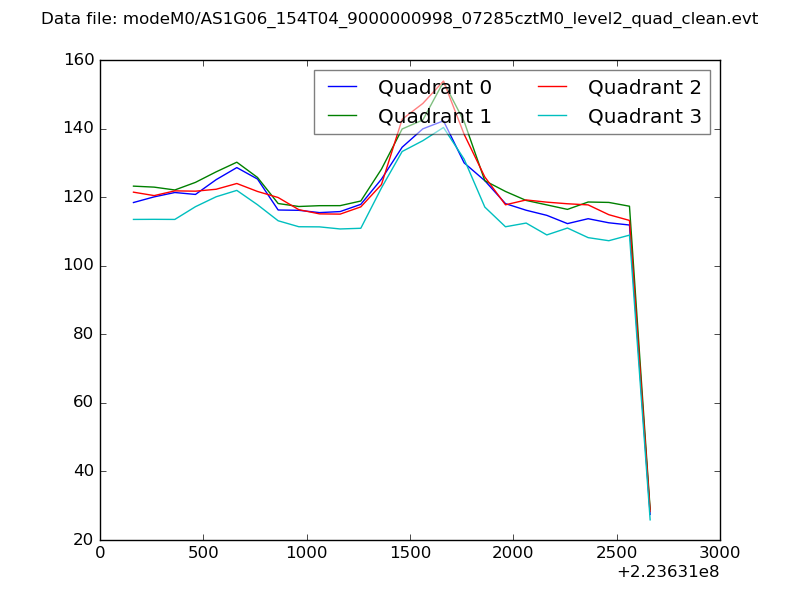 |
|
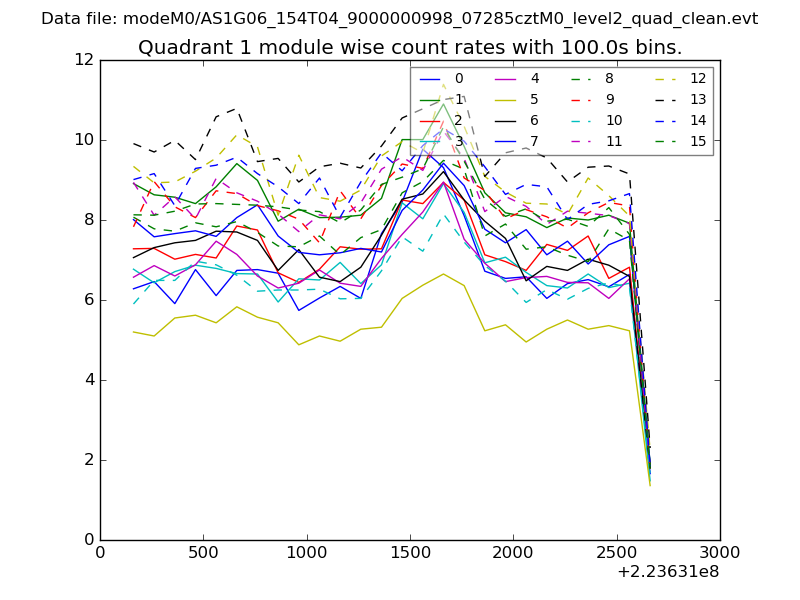
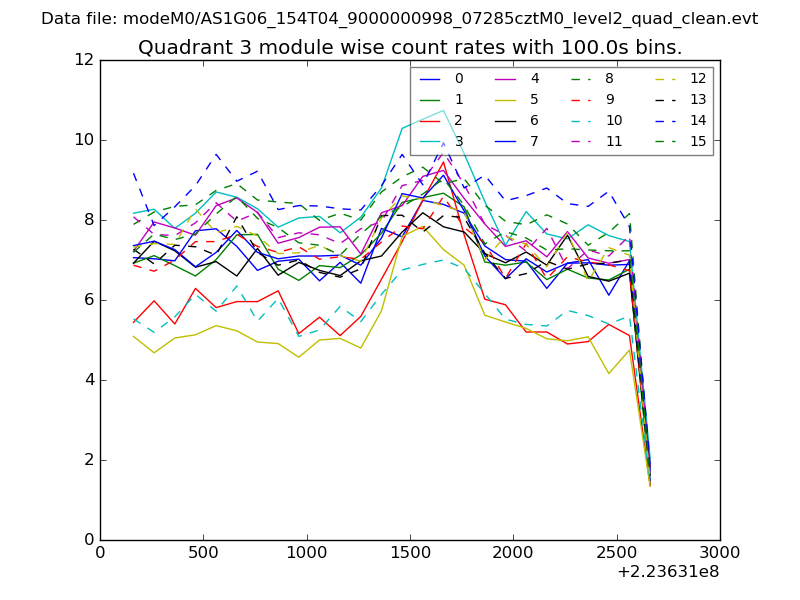
| Module-wise count rates for Quadrant A Data is divided into 100 sec bins |
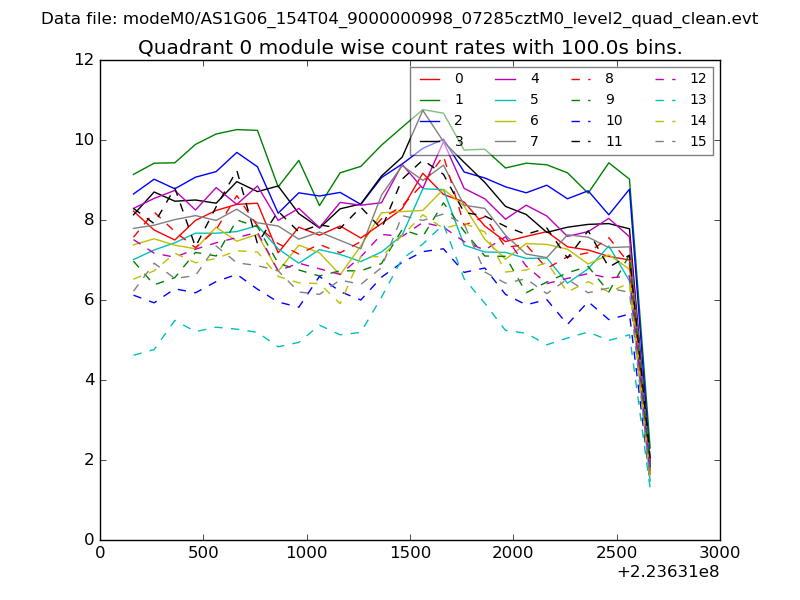 |
 |
| Module-wise count rates for Quadrant B Data is divided into 100 sec bins |
 |
 |
| Module-wise count rates for Quadrant C Data is divided into 100 sec bins |
 |
 |
| Module-wise count rates for Quadrant D Data is divided into 100 sec bins |
 |
 |
| Parameter | Plot |
|---|---|
| CZT HV Monitor | 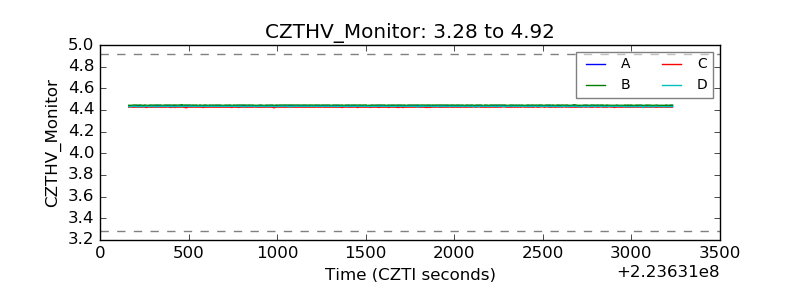 |
| D_VDD | 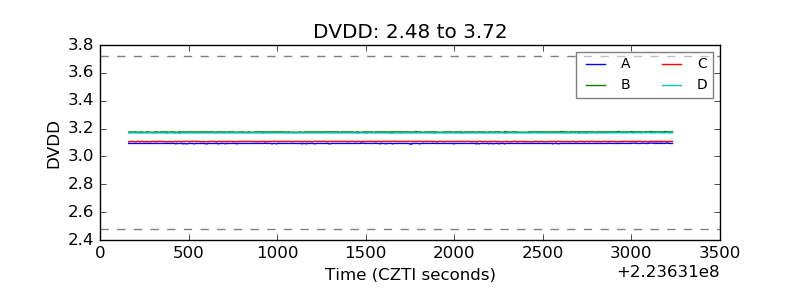 |
| Temperature 1 | 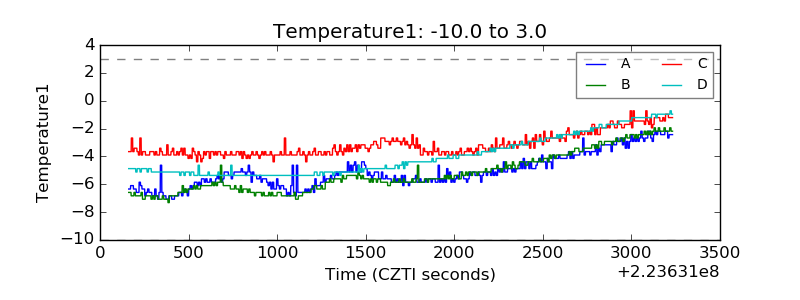 |
| Veto HV Monitor | 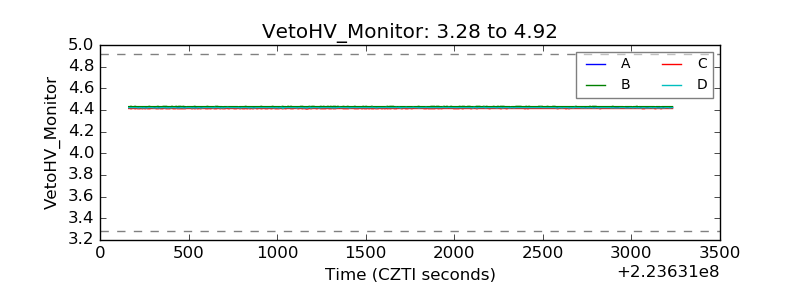 |
| Veto LLD | 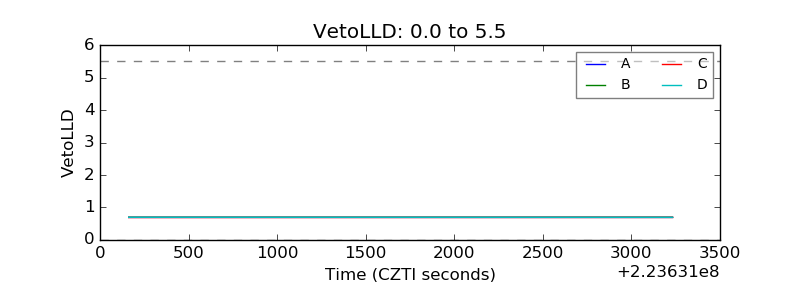 |
| Alpha Counter | 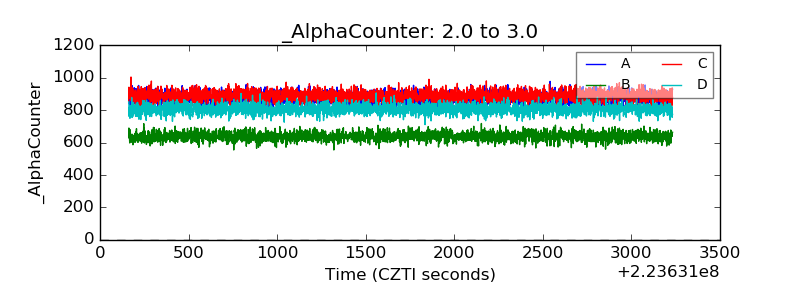 |
| _CPM_Rate | 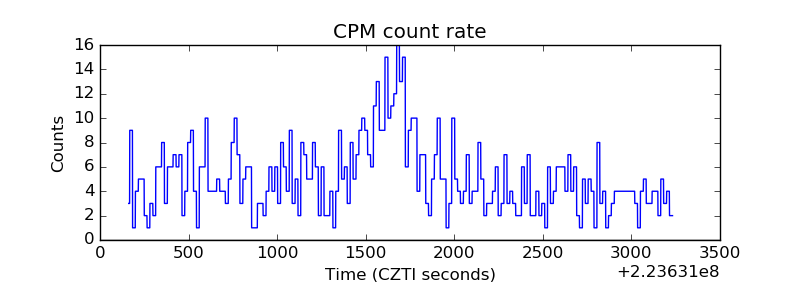 |
| CZT Counter | 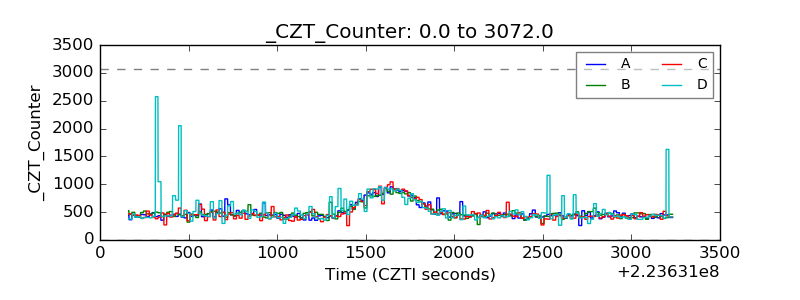 |
| +2.5 Volts monitor |  |
| +5 Volts monitor |  |
| _ROLL_ROT | 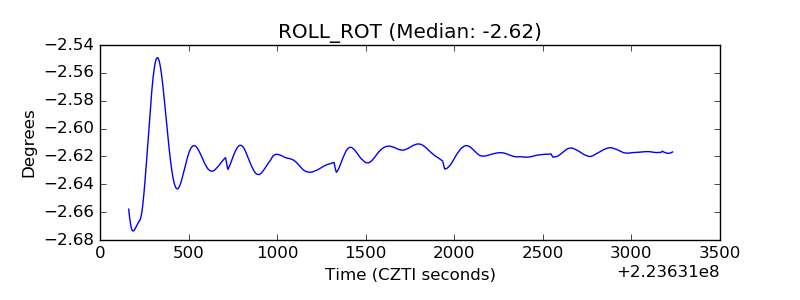 |
| _Roll_DEC | 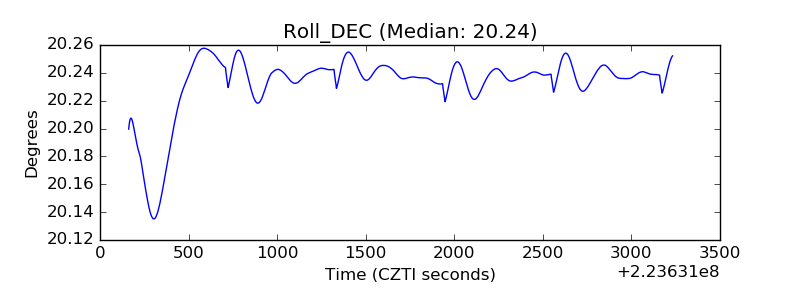 |
| _Roll_RA | 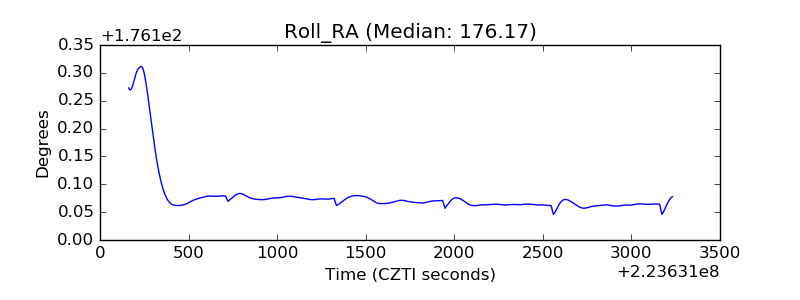 |
| Veto Counter | 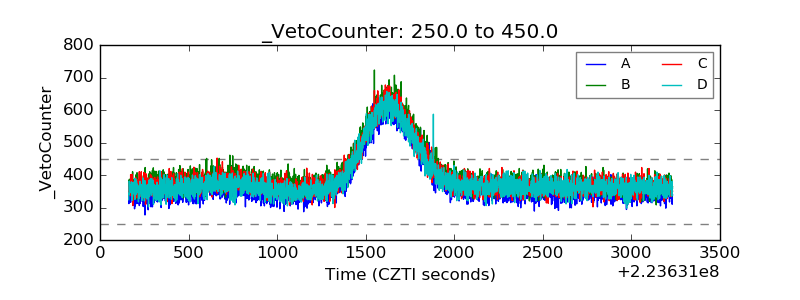 |