| Param | Original file | Final file |
|---|---|---|
| Filename | modeM0/AS1G06_154T04_9000000998_07288cztM0_level2.evt | modeM0/AS1G06_154T04_9000000998_07288cztM0_level2_quad_clean.evt |
| Size (bytes) | 122,374,080 | 19,307,520 |
| Size | 116.7 MB | 18.4 MB |
| Events in quadrant A | 887,507 | 109,881 |
| Events in quadrant B | 916,680 | 114,158 |
| Events in quadrant C | 873,662 | 113,078 |
| Events in quadrant D | 894,175 | 106,143 |
| Mode SS | |||
|---|---|---|---|
| Quadrant | BADHDUFLAG | Total packets | Discarded packets |
| A | 0 | 38 | 0 |
| B | 0 | 38 | 0 |
| C | 0 | 38 | 0 |
| D | 0 | 38 | 0 |
| Mode M0 | |||
|---|---|---|---|
| Quadrant | BADHDUFLAG | Total packets | Discarded packets |
| A | 0 | 3972 | 1 |
| B | 0 | 4005 | 0 |
| C | 0 | 3980 | 0 |
| D | 0 | 4059 | 0 |
| Quadrant | Total seconds | Saturated seconds | Saturation percentage |
|---|---|---|---|
| A | 1932 | 9 | 0.465839% |
| B | 1932 | 4 | 0.207039% |
| C | 1932 | 5 | 0.258799% |
| D | 1932 | 5 | 0.258799% |
Noise dominated data is calculated using 1-second bins in cleaned event files. If a bin has >2000 counts, and if more than 50% of those come from <1% of pixels, then it is considered to be noise-dominated and hence unusable.
| Quadrant | # 1 sec bins | Bins with >0 counts | Bins with >2000 counts | High rate bins dominated by noise | Noise dominated (total time) | Noise dominated (detector-on time) | Marked lightcurve |
|---|---|---|---|---|---|---|---|
| A | 1932 | 1932 | 0 | 0 | 0.00% | 0.00% | 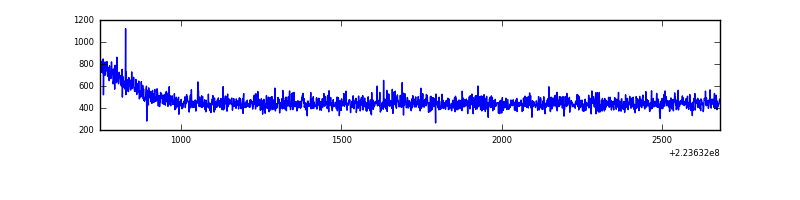 |
| B | 1932 | 1932 | 0 | 0 | 0.00% | 0.00% | 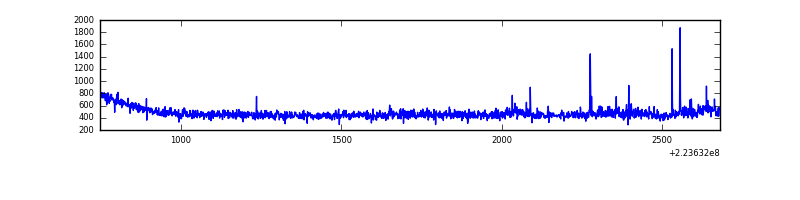 |
| C | 1932 | 1932 | 0 | 0 | 0.00% | 0.00% | 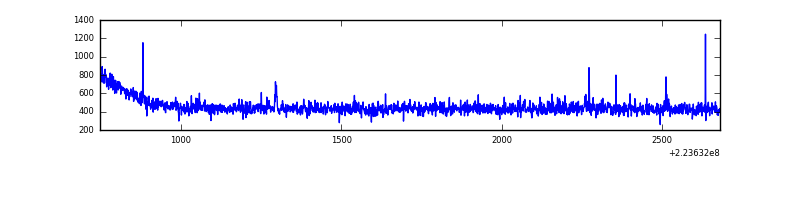 |
| D | 1932 | 1932 | 2 | 2 | 0.10% | 0.10% | 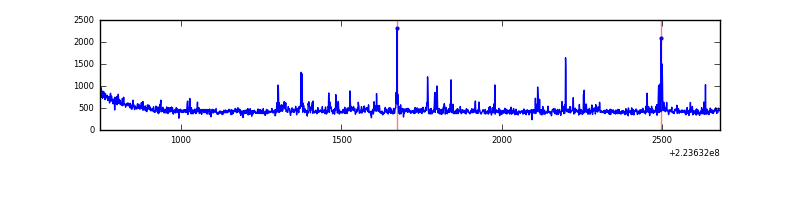 |
Top three noisy pixels from each quadrant. If the there are fewer than three noisy pixels in the level2.evt file, extra rows are filled as -1
| Pixel properties | Quadrant properties | ||||||
|---|---|---|---|---|---|---|---|
| Quadrant | DetID | PixID | Counts | Sigma | Mean | Median | Sigma |
| A | 0 | 226 | 2170 | 39.5 | 229 | 224 | 49.3 |
| A | 8 | 15 | 2045 | 36.96 | 229 | 224 | 49.3 |
| A | 12 | 194 | 1937 | 34.77 | 229 | 224 | 49.3 |
| B | 0 | 214 | 31110 | 663.79 | 228 | 222 | 46.5 |
| B | 12 | 111 | 4741 | 97.11 | 228 | 222 | 46.5 |
| B | 11 | 111 | 3838 | 77.71 | 228 | 222 | 46.5 |
| C | 1 | 16 | 6105 | 109.74 | 221 | 221 | 53.6 |
| C | 9 | 68 | 4459 | 79.04 | 221 | 221 | 53.6 |
| C | 13 | 61 | 1647 | 26.6 | 221 | 221 | 53.6 |
| D | 2 | 216 | 21350 | 377.84 | 221 | 213 | 55.9 |
| D | 1 | 52 | 20454 | 361.82 | 221 | 213 | 55.9 |
| D | 14 | 34 | 12603 | 221.48 | 221 | 213 | 55.9 |
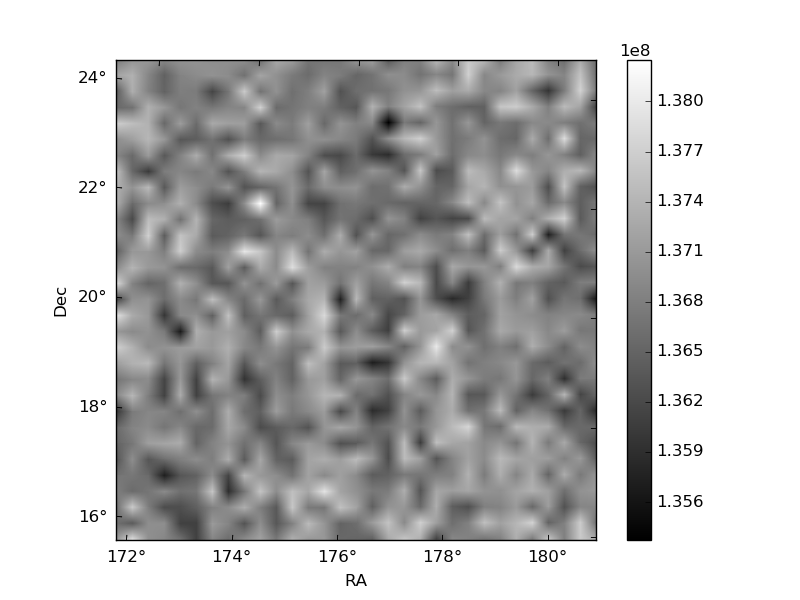
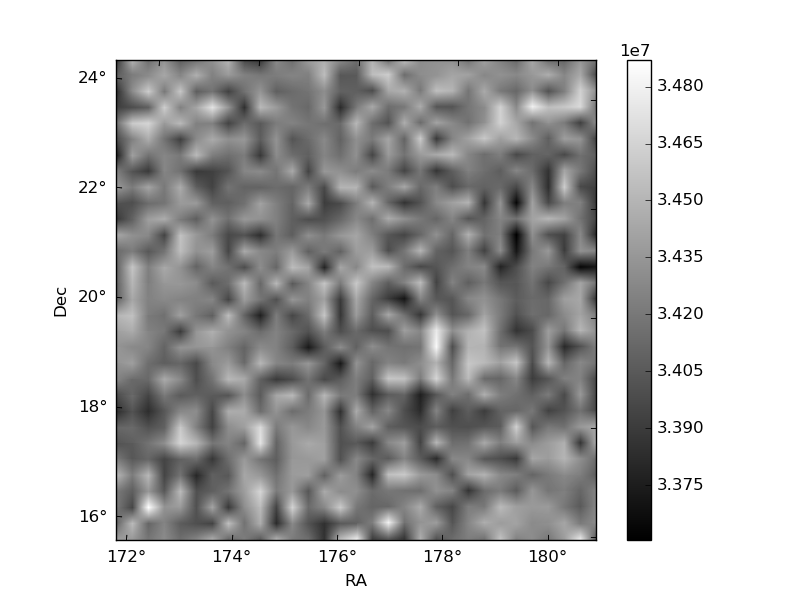
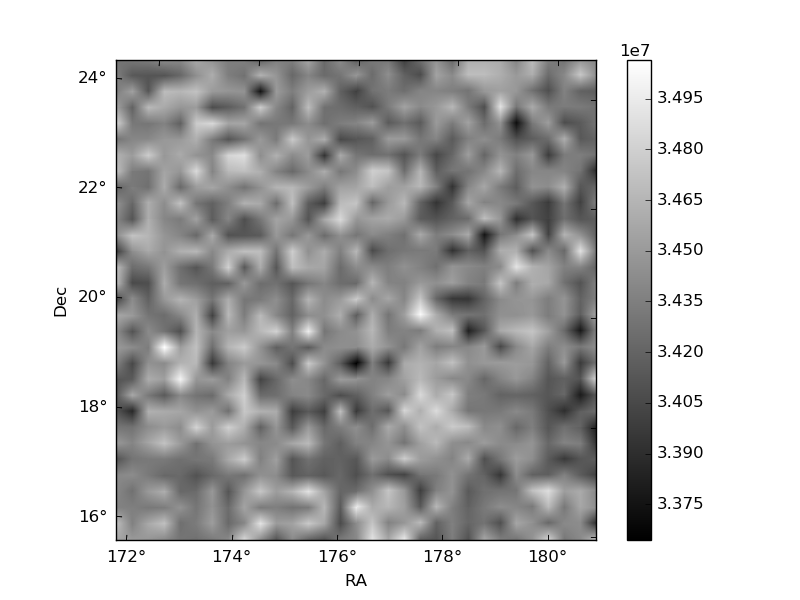
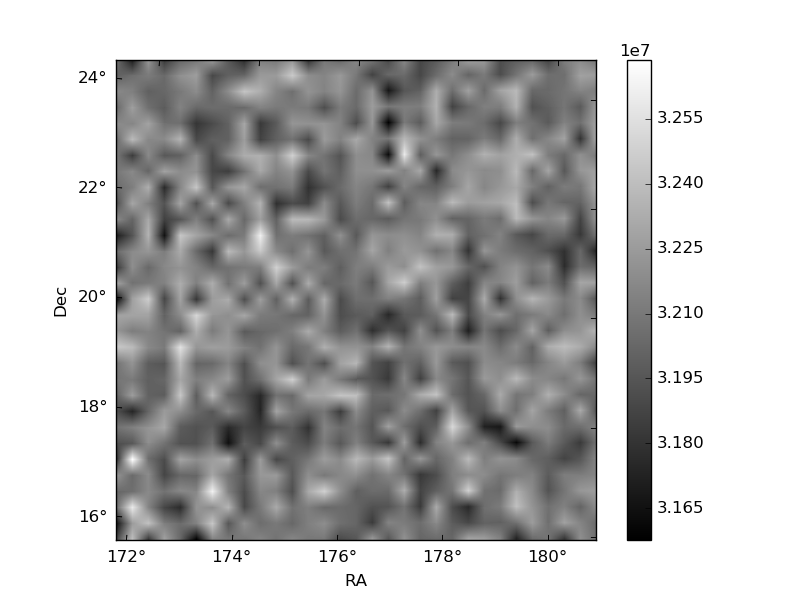
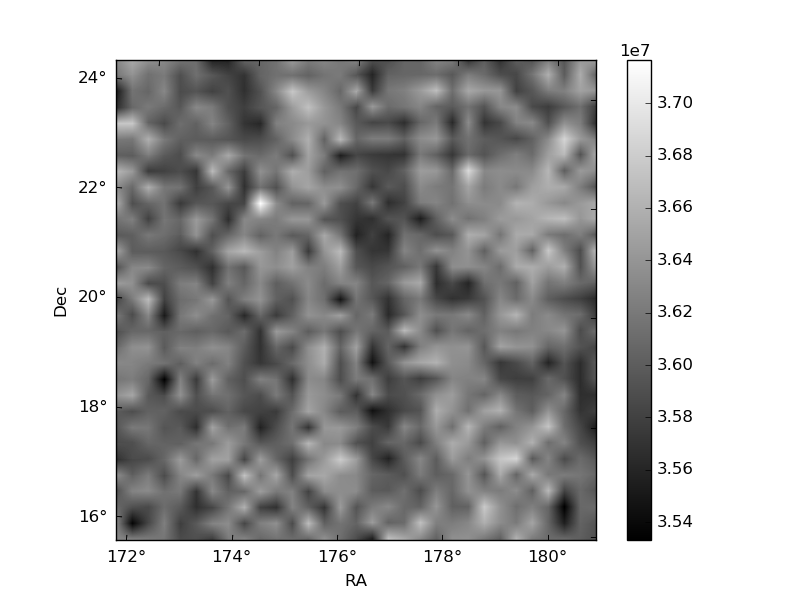
Histogram calculated using DETX and DETY for each event in the final _common_clean file
| Quadrant A | 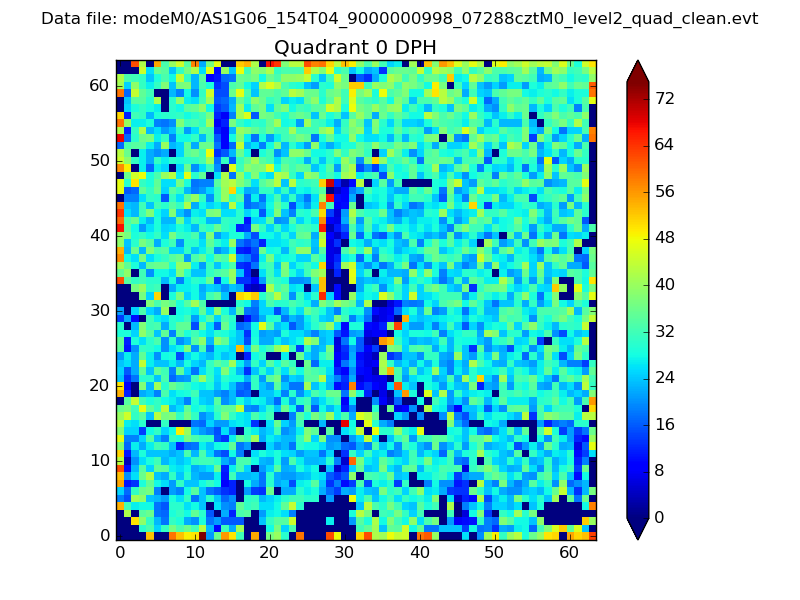 |
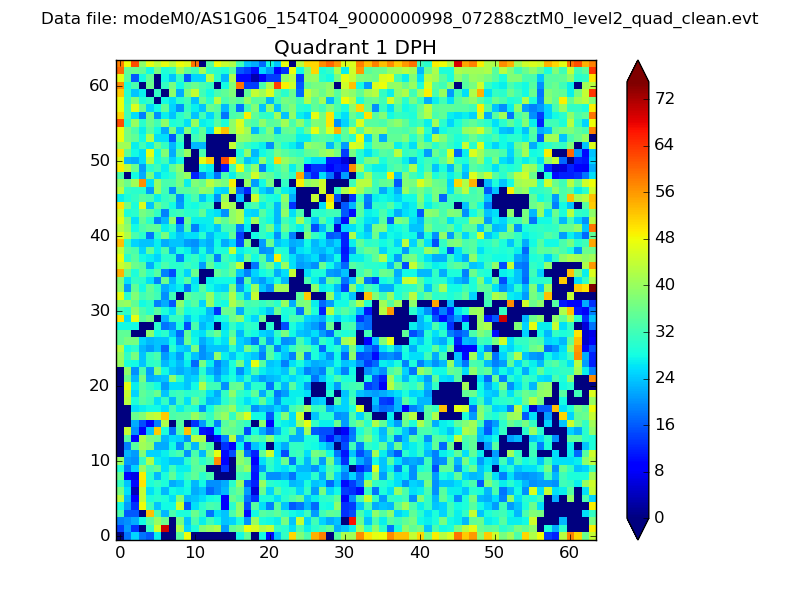 |
Quadrant B |
|---|---|---|---|
| Quadrant D | 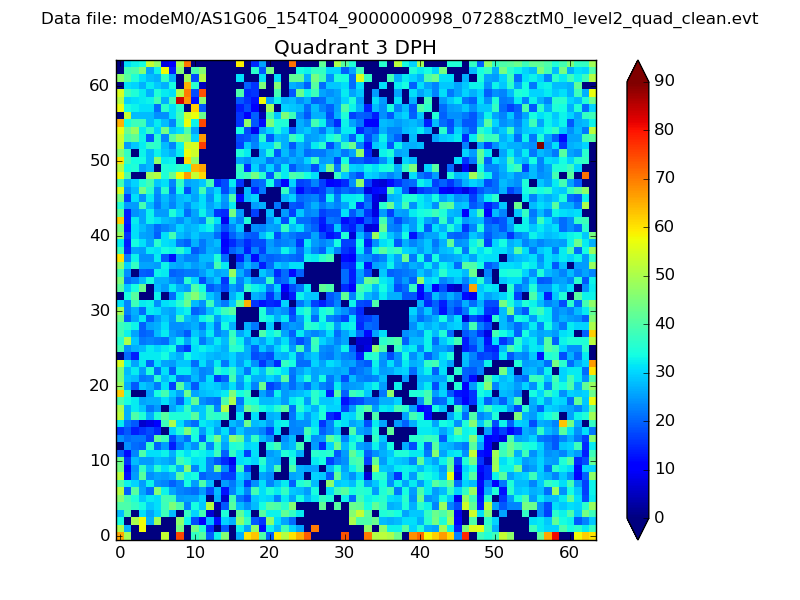 |
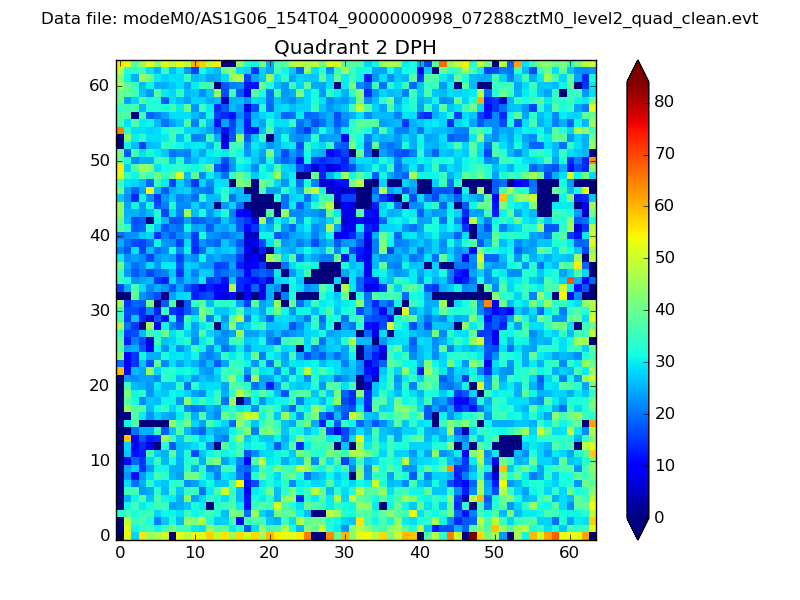 |
Quadrant C |
| Plot type | Count rate plots | Images |
|---|---|---|
| Comparison with Poisson distribution Blue bars denote a histogram of data divided into 1 sec bins. Red curve is a Poisson curve with rate = median count rate of data. |
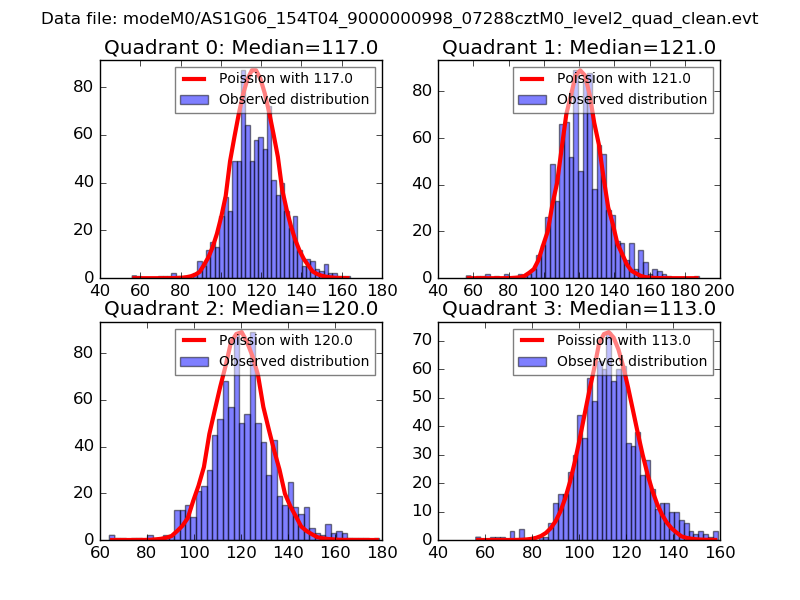 |
 |
| Quadrant-wise count rates Data is divided into 100 sec bins |
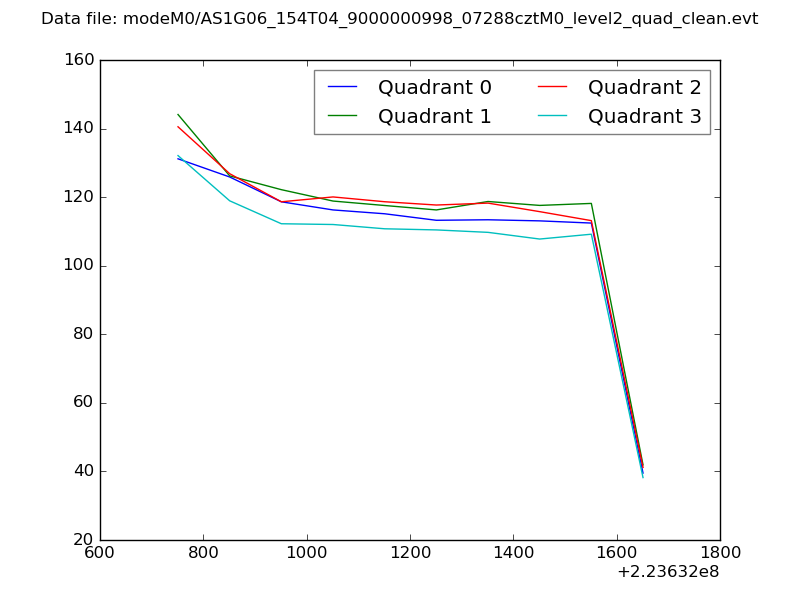 |
|
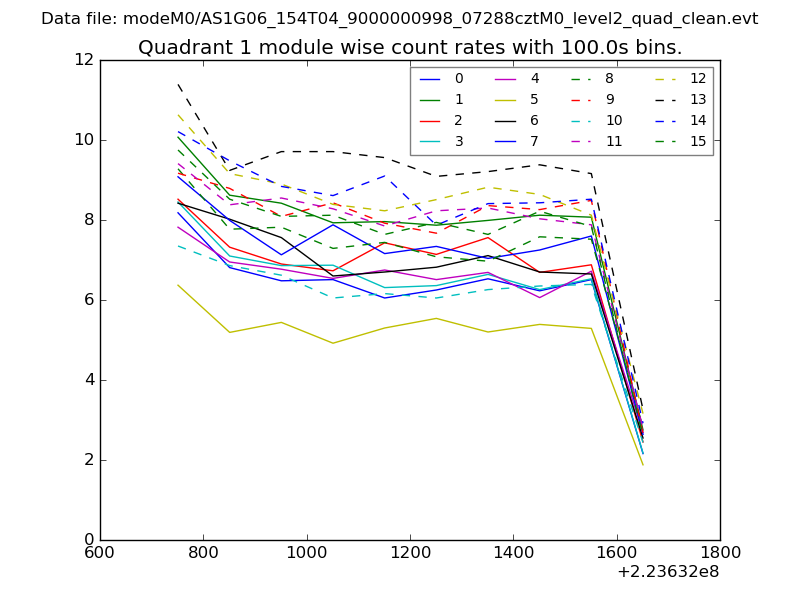
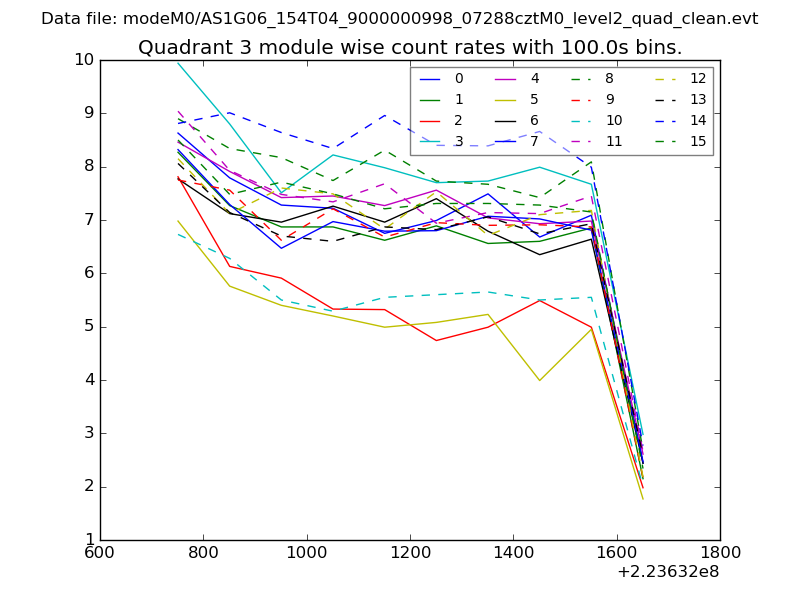
| Module-wise count rates for Quadrant A Data is divided into 100 sec bins |
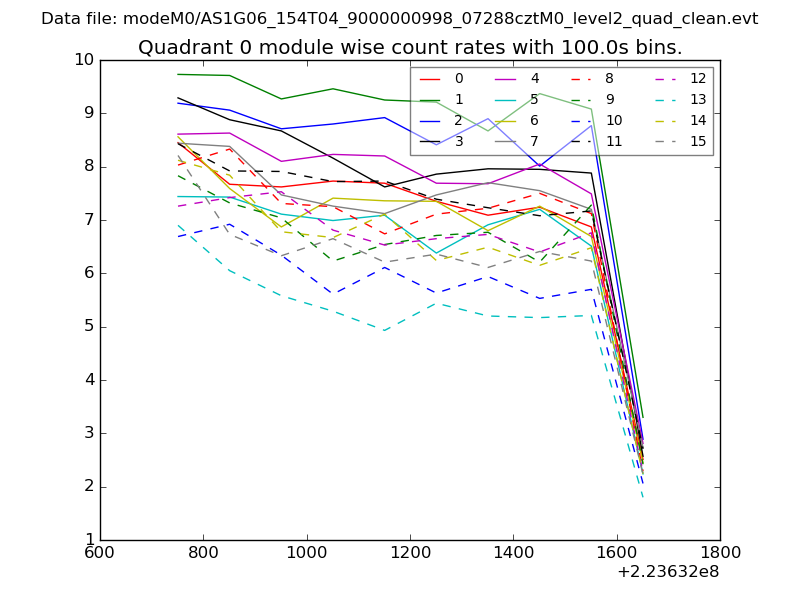 |
 |
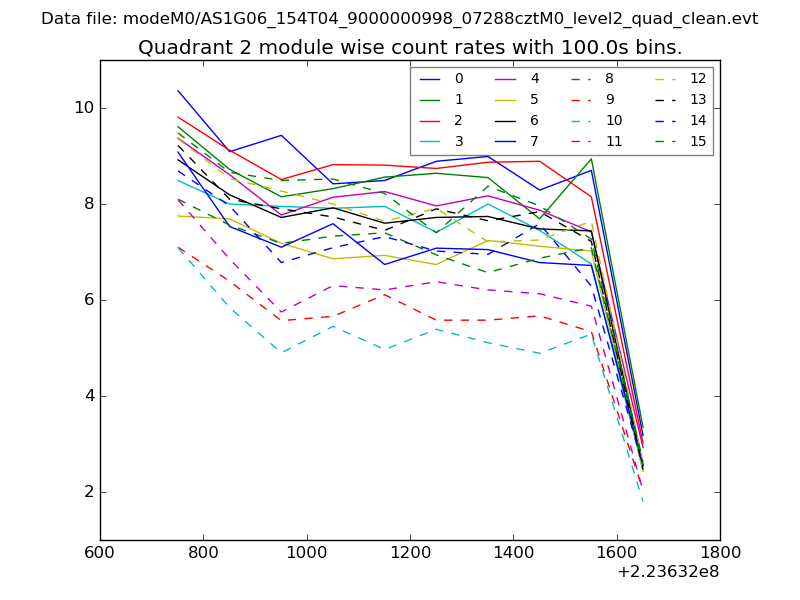
| Module-wise count rates for Quadrant B Data is divided into 100 sec bins |
 |
 |
| Module-wise count rates for Quadrant C Data is divided into 100 sec bins |
 |
 |
| Module-wise count rates for Quadrant D Data is divided into 100 sec bins |
 |
 |
| Parameter | Plot |
|---|---|
| CZT HV Monitor | 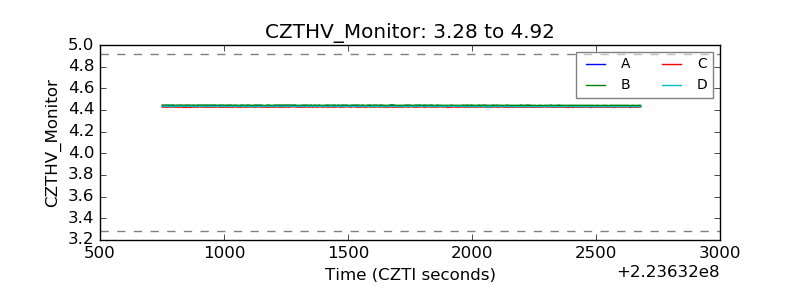 |
| D_VDD | 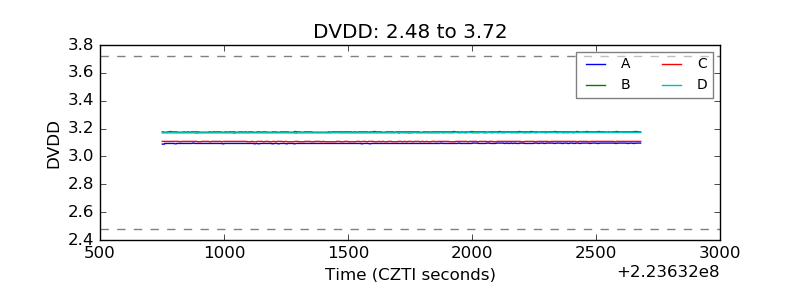 |
| Temperature 1 | 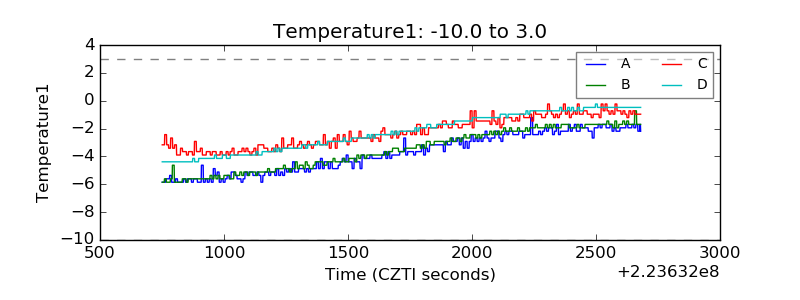 |
| Veto HV Monitor | 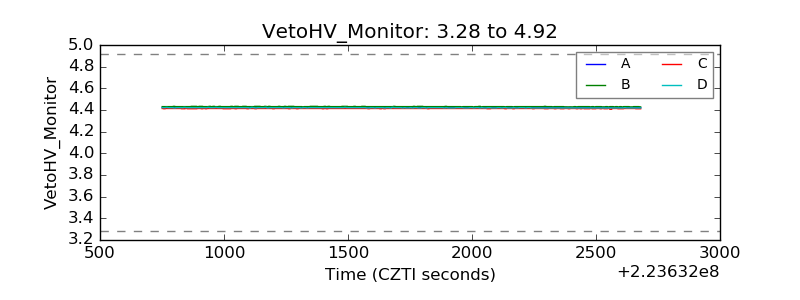 |
| Veto LLD | 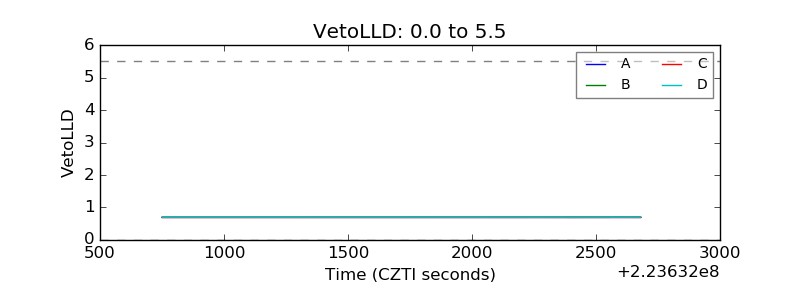 |
| Alpha Counter | 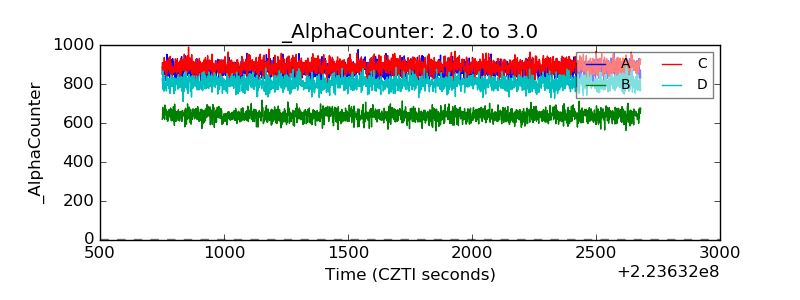 |
| _CPM_Rate | 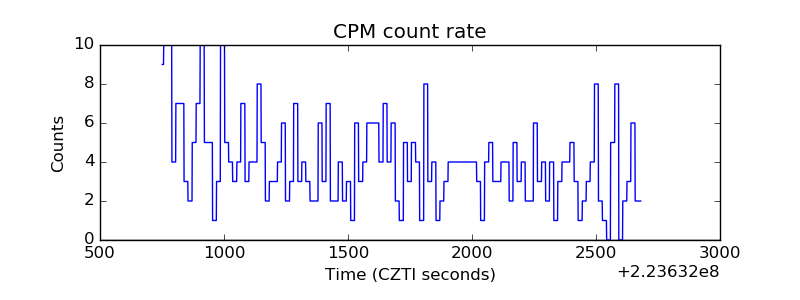 |
| CZT Counter | 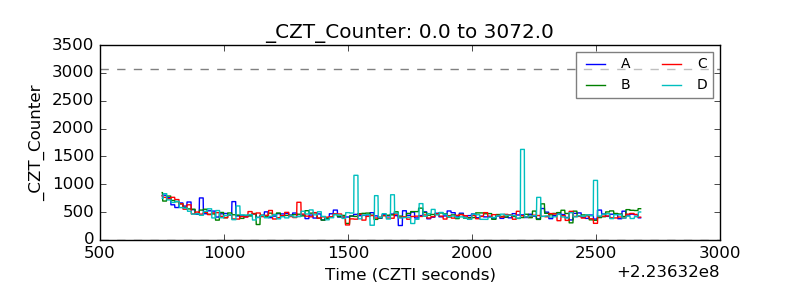 |
| +2.5 Volts monitor |  |
| +5 Volts monitor |  |
| _ROLL_ROT | 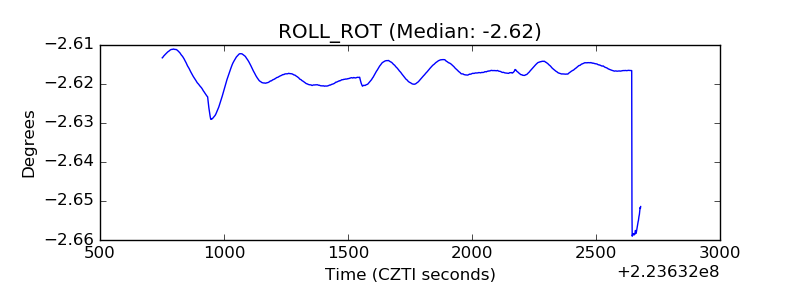 |
| _Roll_DEC | 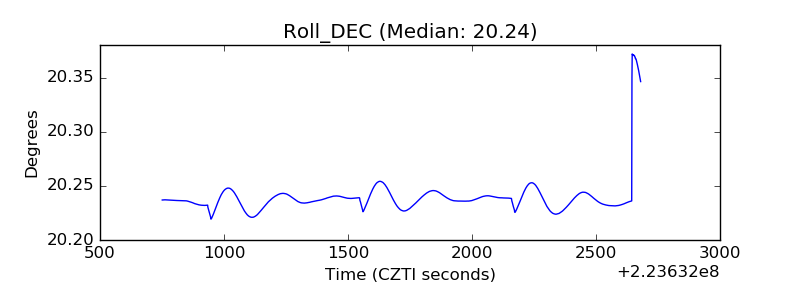 |
| _Roll_RA | 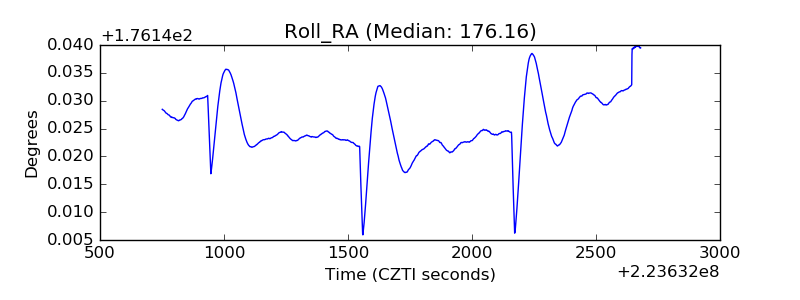 |
| Veto Counter | 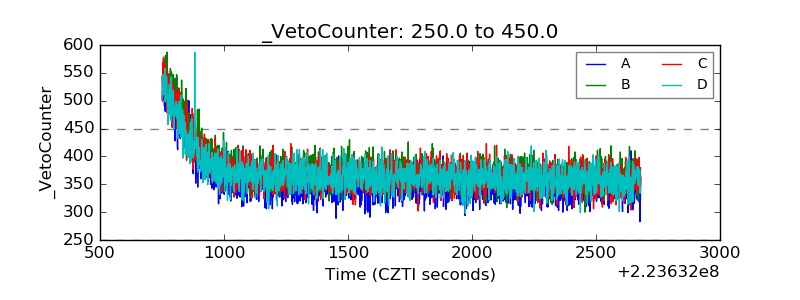 |