| Param | Original file | Final file |
|---|---|---|
| Filename | modeM0/AS1G06_154T04_9000000998_07290cztM0_level2.evt | modeM0/AS1G06_154T04_9000000998_07290cztM0_level2_quad_clean.evt |
| Size (bytes) | 659,989,440 | 77,676,480 |
| Size | 629.4 MB | 74.1 MB |
| Events in quadrant A | 4,018,133 | 486,072 |
| Events in quadrant B | 3,349,739 | 494,241 |
| Events in quadrant C | 3,257,614 | 489,154 |
| Events in quadrant D | 8,902,995 | 409,664 |
| Mode M9 | |||
|---|---|---|---|
| Quadrant | BADHDUFLAG | Total packets | Discarded packets |
| A | 0 | 20 | 0 |
| B | 0 | 20 | 0 |
| C | 0 | 20 | 0 |
| D | 0 | 20 | 0 |
| Mode SS | |||
|---|---|---|---|
| Quadrant | BADHDUFLAG | Total packets | Discarded packets |
| A | 0 | 138 | 0 |
| B | 0 | 138 | 0 |
| C | 0 | 138 | 0 |
| D | 0 | 138 | 0 |
| Mode M0 | |||
|---|---|---|---|
| Quadrant | BADHDUFLAG | Total packets | Discarded packets |
| A | 0 | 16747 | 3 |
| B | 0 | 14514 | 2 |
| C | 0 | 14260 | 2 |
| D | 0 | 31025 | 2 |
| Quadrant | Total seconds | Saturated seconds | Saturation percentage |
|---|---|---|---|
| A | 6782 | 672 | 9.908582% |
| B | 6782 | 70 | 1.032144% |
| C | 6782 | 64 | 0.943674% |
| D | 6782 | 2186 | 32.232380% |
Noise dominated data is calculated using 1-second bins in cleaned event files. If a bin has >2000 counts, and if more than 50% of those come from <1% of pixels, then it is considered to be noise-dominated and hence unusable.
| Quadrant | # 1 sec bins | Bins with >0 counts | Bins with >2000 counts | High rate bins dominated by noise | Noise dominated (total time) | Noise dominated (detector-on time) | Marked lightcurve |
|---|---|---|---|---|---|---|---|
| A | 8702 | 6782 | 158 | 158 | 1.82% | 2.33% | 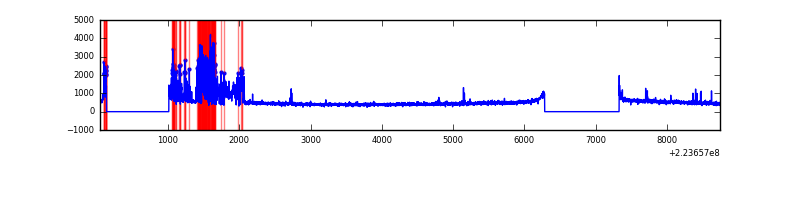 |
| B | 8702 | 6782 | 3 | 3 | 0.03% | 0.04% | 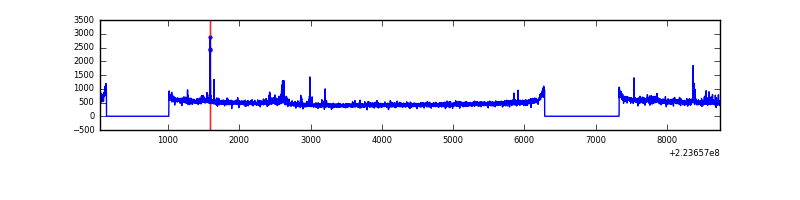 |
| C | 8702 | 6782 | 3 | 3 | 0.03% | 0.04% | 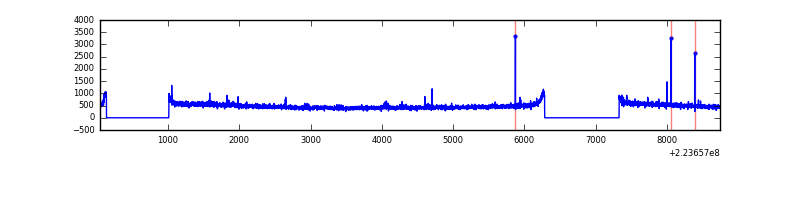 |
| D | 8702 | 6783 | 2131 | 2131 | 24.49% | 31.42% | 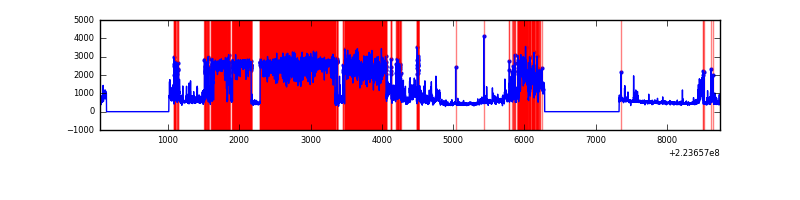 |
Top three noisy pixels from each quadrant. If the there are fewer than three noisy pixels in the level2.evt file, extra rows are filled as -1
| Pixel properties | Quadrant properties | ||||||
|---|---|---|---|---|---|---|---|
| Quadrant | DetID | PixID | Counts | Sigma | Mean | Median | Sigma |
| A | 15 | 239 | 984427 | 6242.3 | 771 | 755 | 157.6 |
| A | 14 | 111 | 29150 | 180.19 | 771 | 755 | 157.6 |
| A | 8 | 15 | 17101 | 103.73 | 771 | 755 | 157.6 |
| B | 0 | 214 | 47371 | 291.89 | 832 | 813 | 159.5 |
| B | 4 | 81 | 37046 | 227.16 | 832 | 813 | 159.5 |
| B | 0 | 213 | 29380 | 179.1 | 832 | 813 | 159.5 |
| C | 9 | 68 | 86116 | 452.43 | 808 | 814 | 188.5 |
| C | 13 | 61 | 6188 | 28.5 | 808 | 814 | 188.5 |
| C | 10 | 22 | 5377 | 24.2 | 808 | 814 | 188.5 |
| D | 12 | 221 | 5827289 | 32616.78 | 716 | 694 | 178.6 |
| D | 14 | 34 | 221314 | 1235.01 | 716 | 694 | 178.6 |
| D | 12 | 233 | 45873 | 252.91 | 716 | 694 | 178.6 |
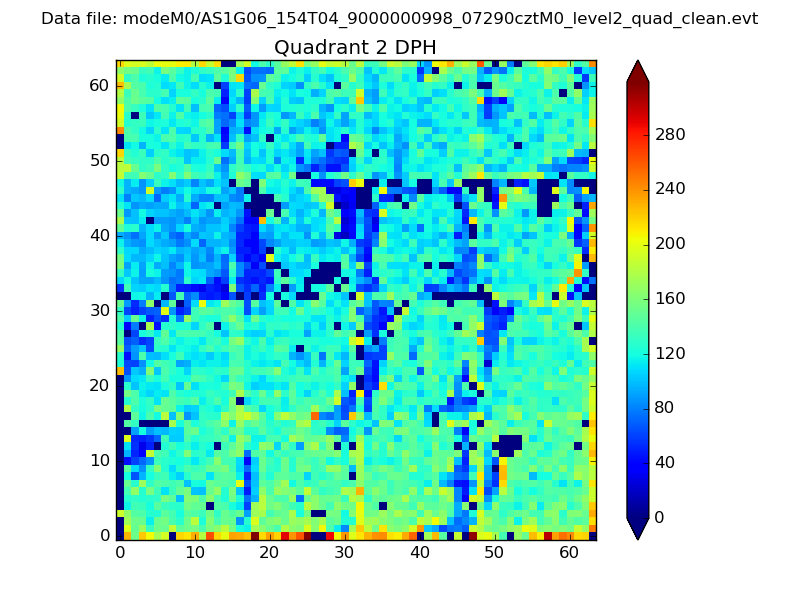
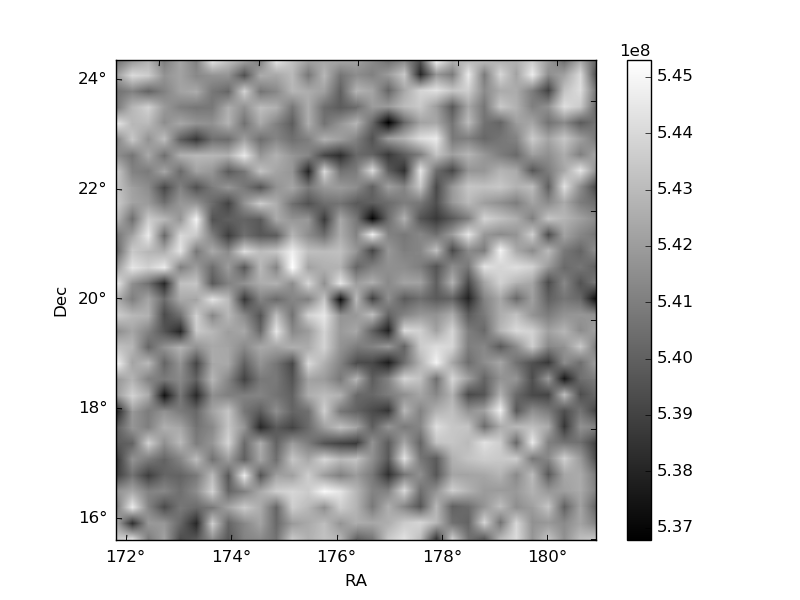
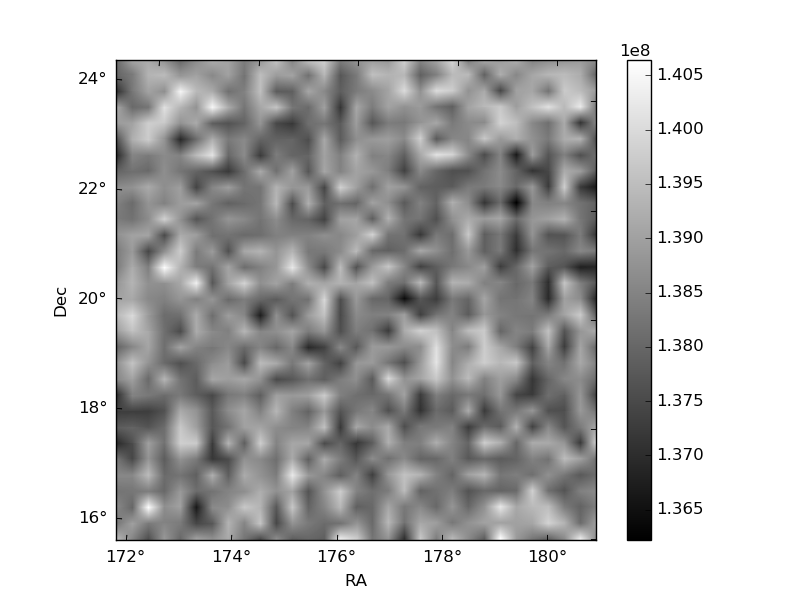
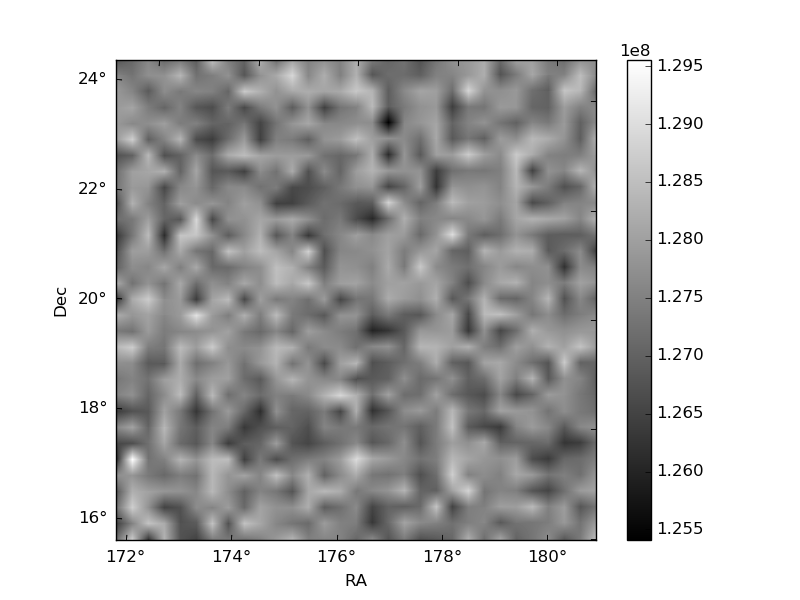
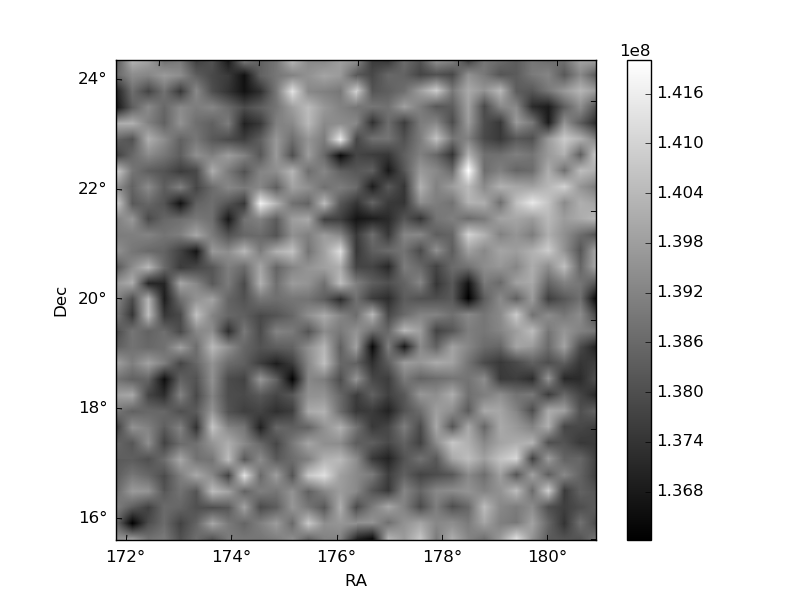
Histogram calculated using DETX and DETY for each event in the final _common_clean file
| Quadrant A | 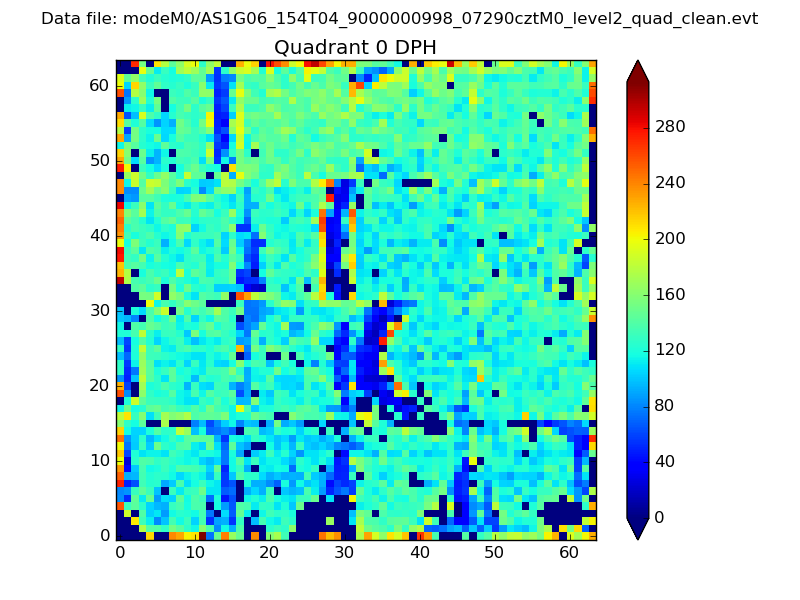 |
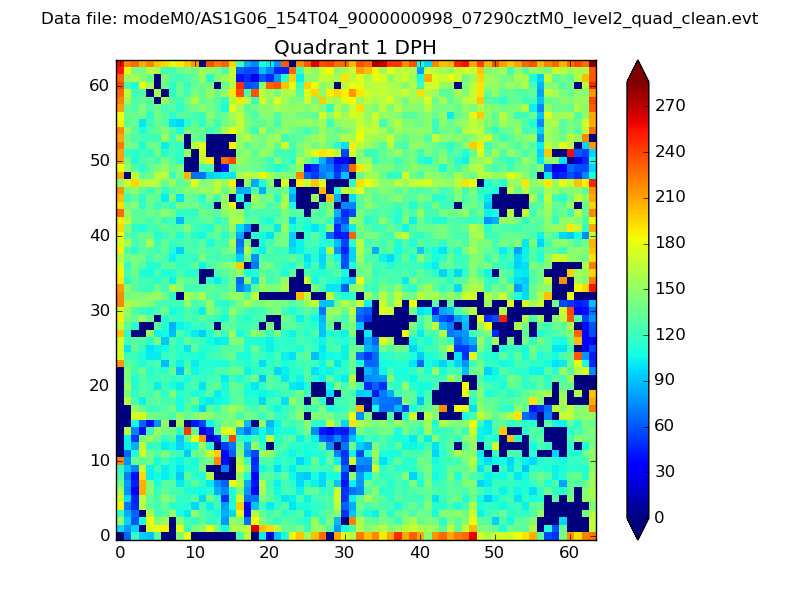 |
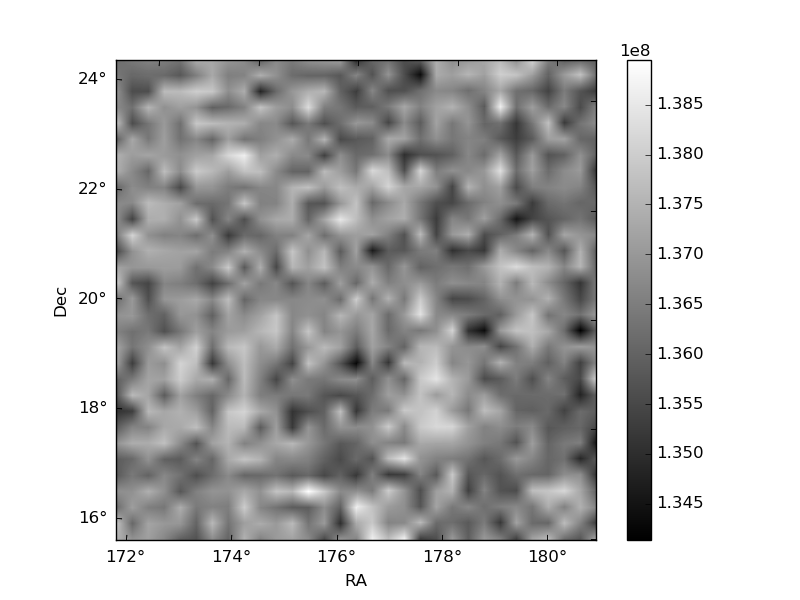
Quadrant B |
|---|---|---|---|
| Quadrant D | 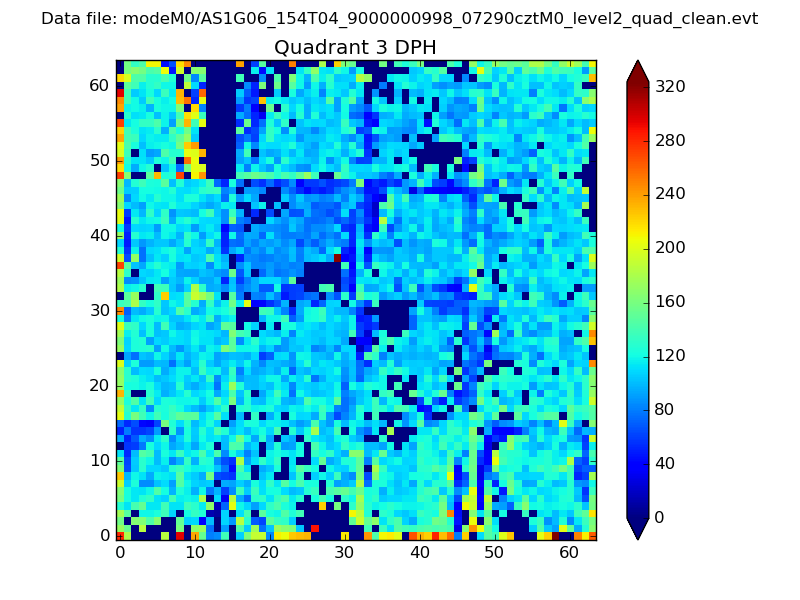 |
 |
Quadrant C |
| Plot type | Count rate plots | Images |
|---|---|---|
| Comparison with Poisson distribution Blue bars denote a histogram of data divided into 1 sec bins. Red curve is a Poisson curve with rate = median count rate of data. |
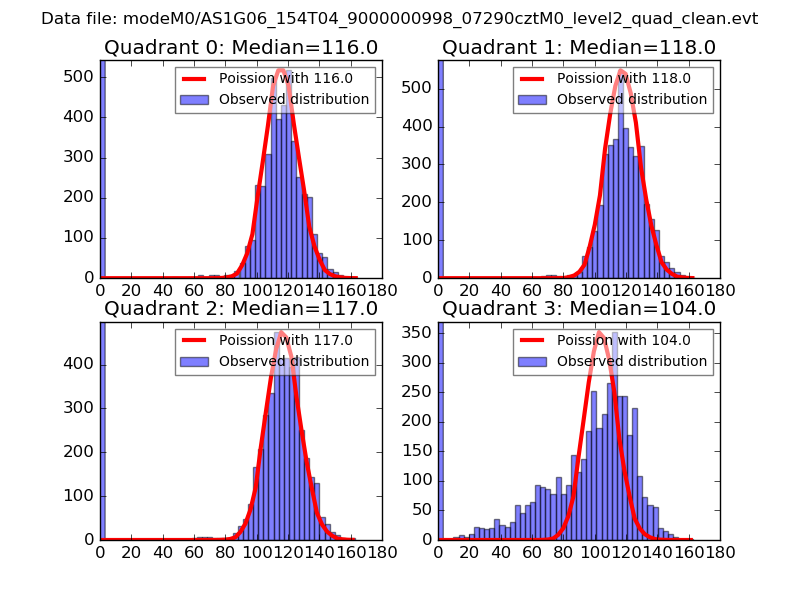 |
 |
| Quadrant-wise count rates Data is divided into 100 sec bins |
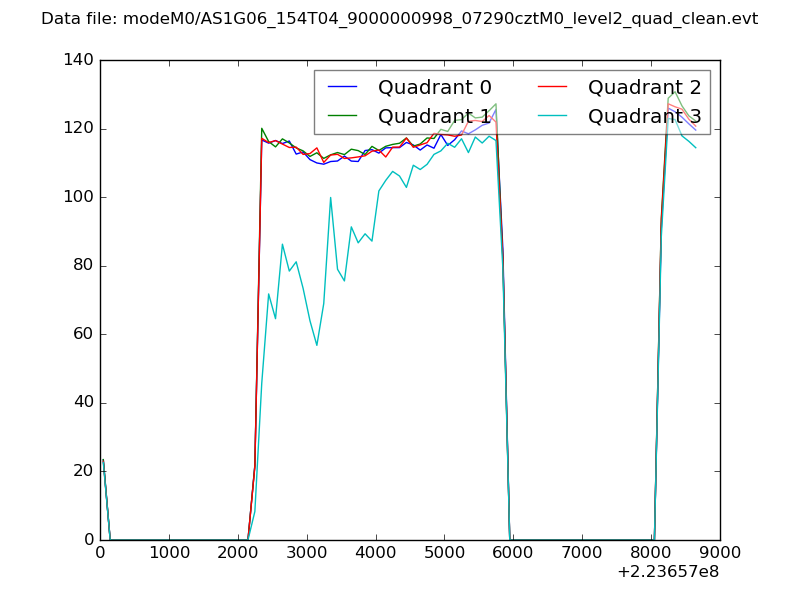 |
|
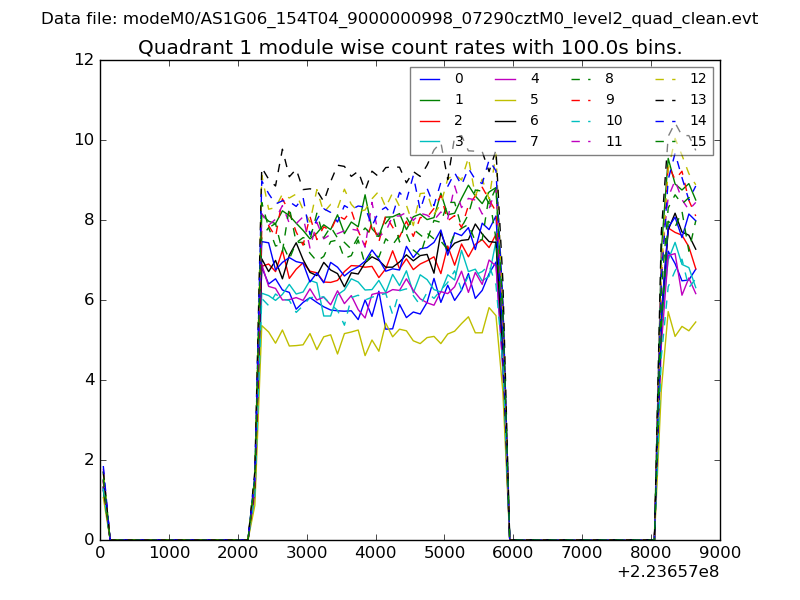
| Module-wise count rates for Quadrant A Data is divided into 100 sec bins |
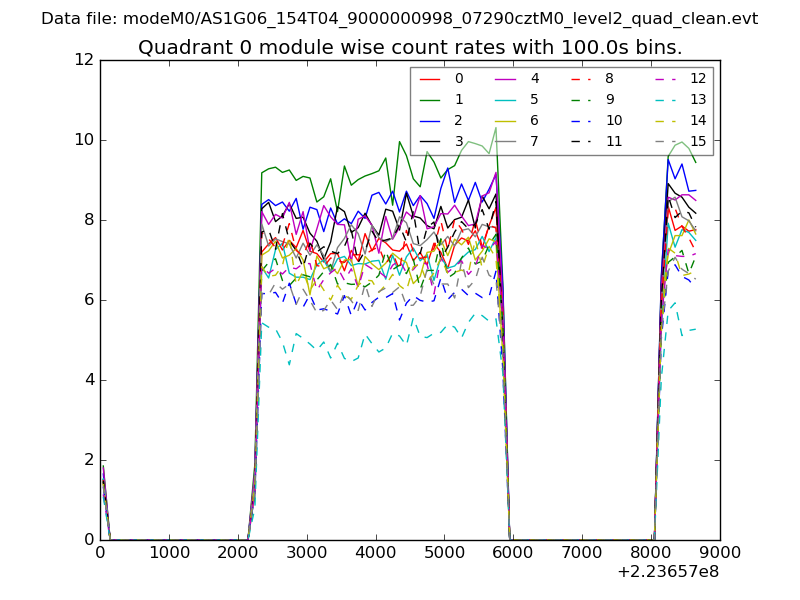 |
 |
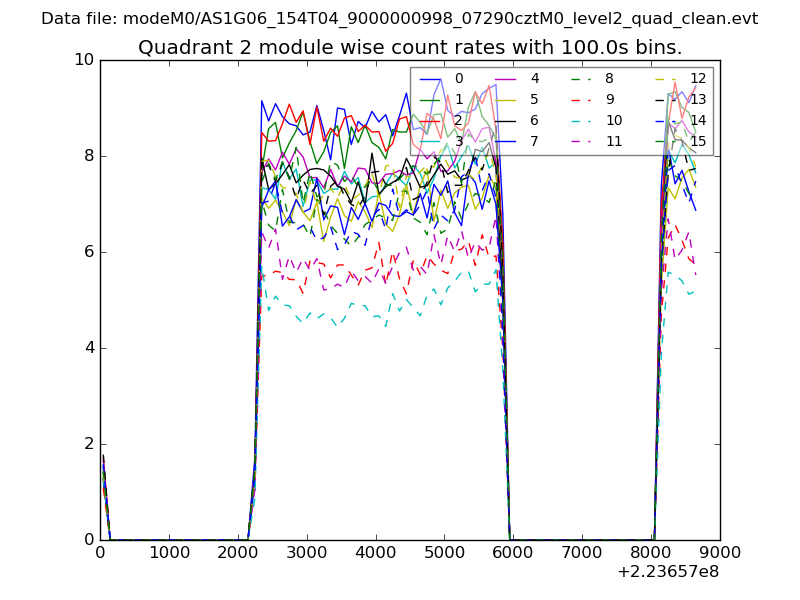
| Module-wise count rates for Quadrant B Data is divided into 100 sec bins |
 |
 |
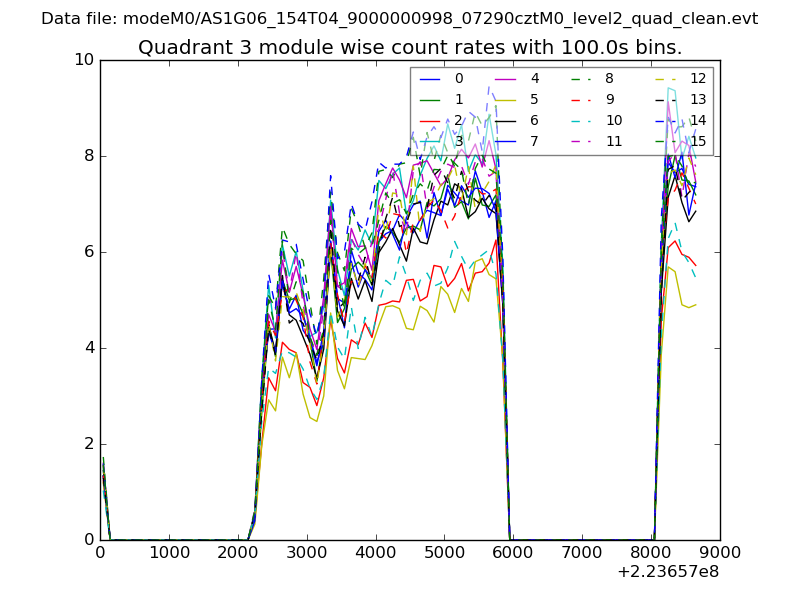
| Module-wise count rates for Quadrant C Data is divided into 100 sec bins |
 |
 |
| Module-wise count rates for Quadrant D Data is divided into 100 sec bins |
 |
 |
| Parameter | Plot |
|---|---|
| CZT HV Monitor | 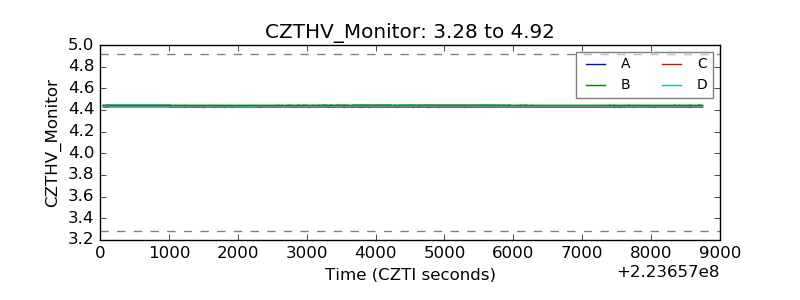 |
| D_VDD | 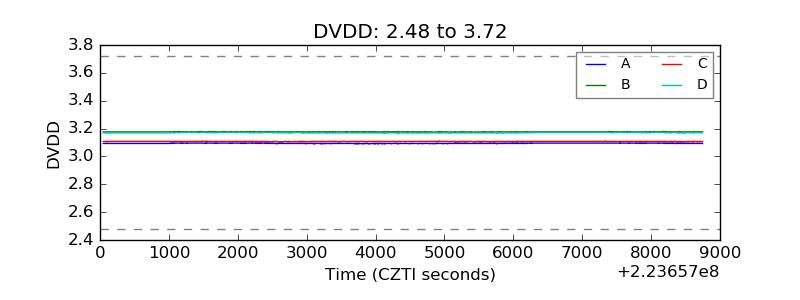 |
| Temperature 1 | 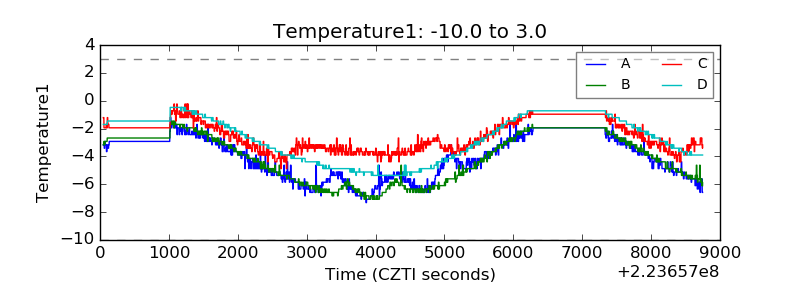 |
| Veto HV Monitor | 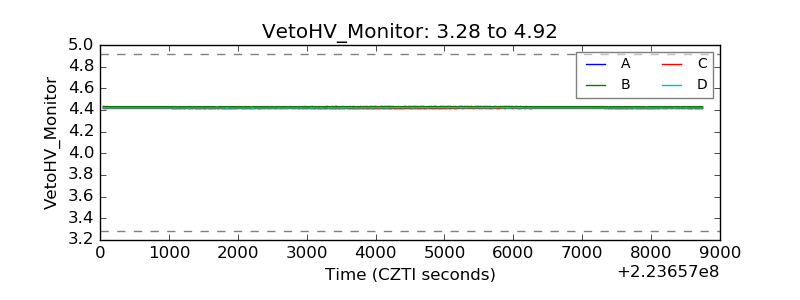 |
| Veto LLD | 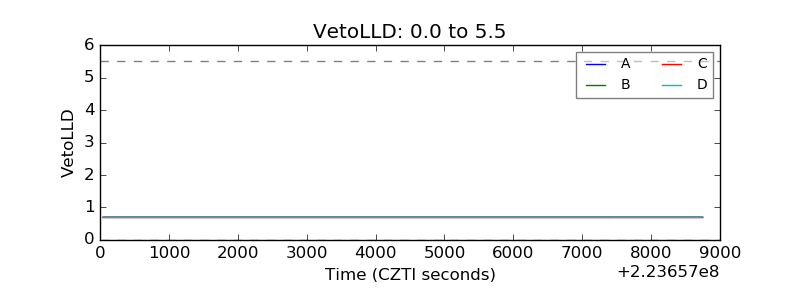 |
| Alpha Counter | 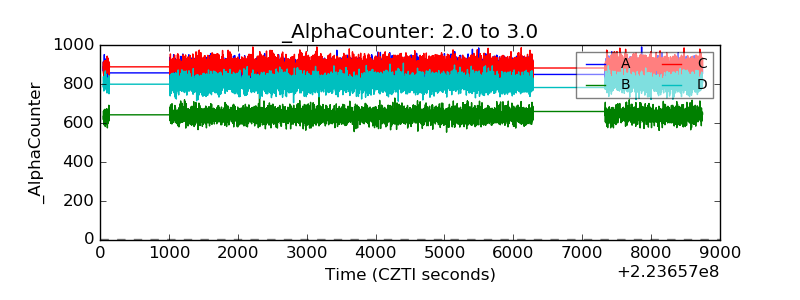 |
| _CPM_Rate | 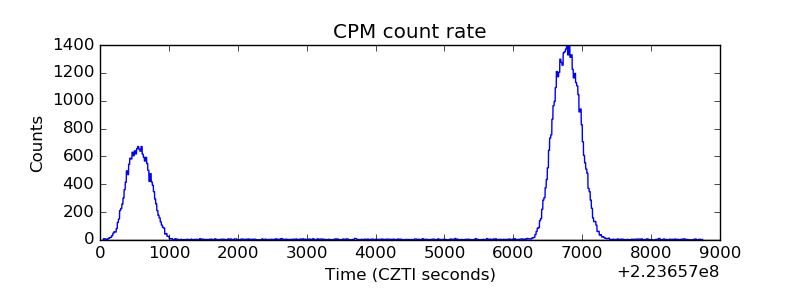 |
| CZT Counter | 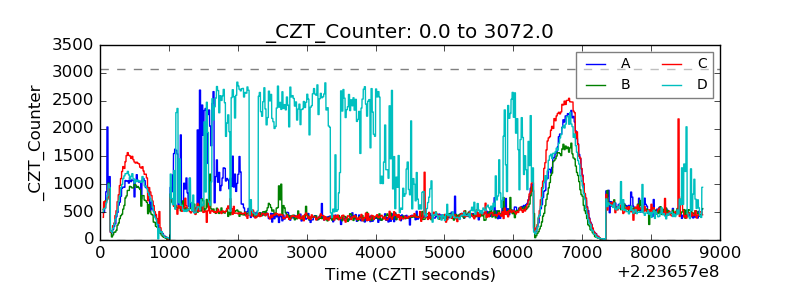 |
| +2.5 Volts monitor | 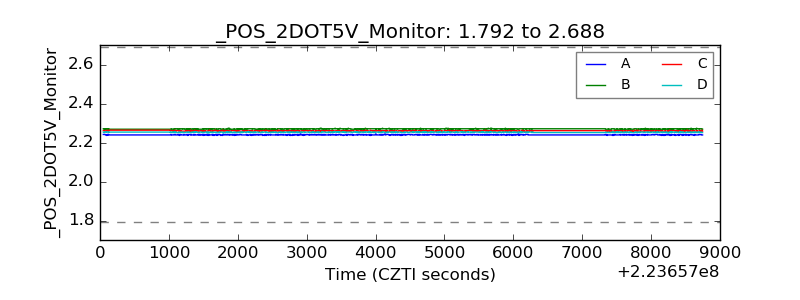 |
| +5 Volts monitor |  |
| _ROLL_ROT | 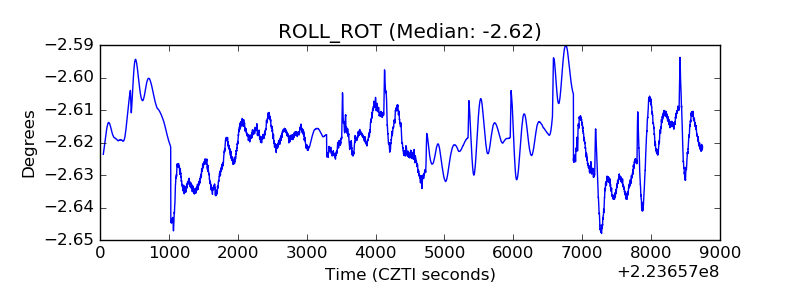 |
| _Roll_DEC | 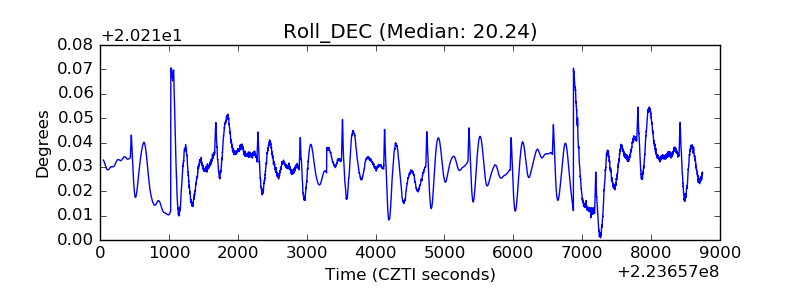 |
| _Roll_RA | 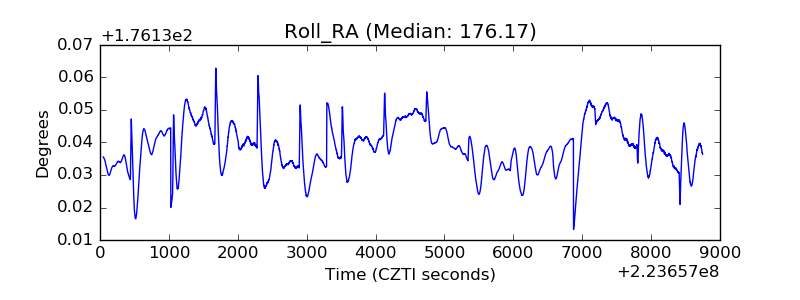 |
| Veto Counter | 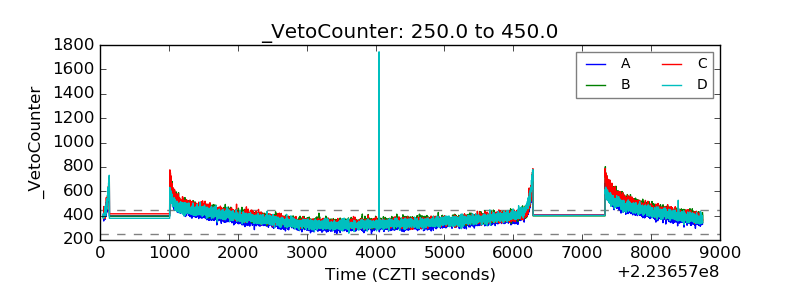 |