| Param | Original file | Final file |
|---|---|---|
| Filename | modeM0/AS1G06_154T04_9000000998_07293cztM0_level2.evt | modeM0/AS1G06_154T04_9000000998_07293cztM0_level2_quad_clean.evt |
| Size (bytes) | 443,557,440 | 87,134,400 |
| Size | 423.0 MB | 83.1 MB |
| Events in quadrant A | 3,149,748 | 551,964 |
| Events in quadrant B | 3,164,649 | 575,094 |
| Events in quadrant C | 2,933,395 | 562,517 |
| Events in quadrant D | 3,770,202 | 522,497 |
| Mode M9 | |||
|---|---|---|---|
| Quadrant | BADHDUFLAG | Total packets | Discarded packets |
| A | 0 | 24 | 0 |
| B | 0 | 24 | 0 |
| C | 0 | 24 | 0 |
| D | 0 | 24 | 0 |
| Mode SS | |||
|---|---|---|---|
| Quadrant | BADHDUFLAG | Total packets | Discarded packets |
| A | 0 | 128 | 0 |
| B | 0 | 128 | 0 |
| C | 0 | 128 | 0 |
| D | 0 | 128 | 0 |
| Mode M0 | |||
|---|---|---|---|
| Quadrant | BADHDUFLAG | Total packets | Discarded packets |
| A | 0 | 13641 | 2 |
| B | 0 | 13523 | 2 |
| C | 0 | 12880 | 2 |
| D | 0 | 15382 | 2 |
| Quadrant | Total seconds | Saturated seconds | Saturation percentage |
|---|---|---|---|
| A | 6103 | 53 | 0.868425% |
| B | 6103 | 69 | 1.130592% |
| C | 6103 | 33 | 0.540718% |
| D | 6103 | 251 | 4.112731% |
Noise dominated data is calculated using 1-second bins in cleaned event files. If a bin has >2000 counts, and if more than 50% of those come from <1% of pixels, then it is considered to be noise-dominated and hence unusable.
| Quadrant | # 1 sec bins | Bins with >0 counts | Bins with >2000 counts | High rate bins dominated by noise | Noise dominated (total time) | Noise dominated (detector-on time) | Marked lightcurve |
|---|---|---|---|---|---|---|---|
| A | 8563 | 6104 | 0 | 0 | 0.00% | 0.00% | 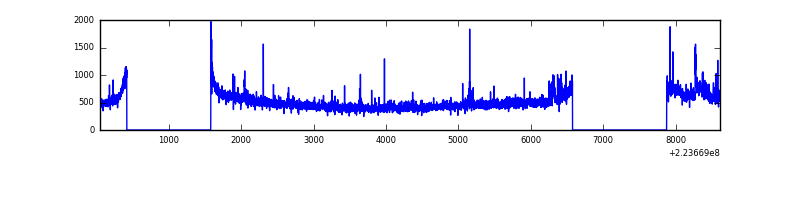 |
| B | 8563 | 6105 | 9 | 9 | 0.11% | 0.15% | 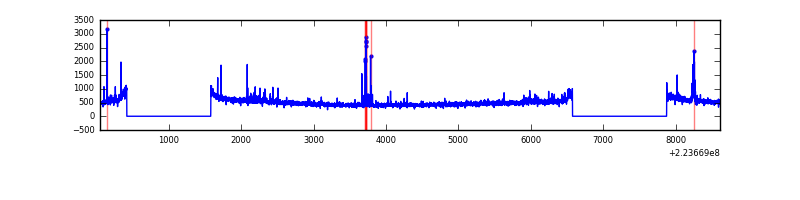 |
| C | 8563 | 6105 | 0 | 0 | 0.00% | 0.00% | 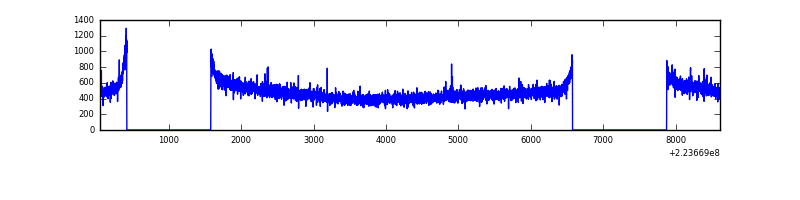 |
| D | 8563 | 6105 | 176 | 176 | 2.06% | 2.88% | 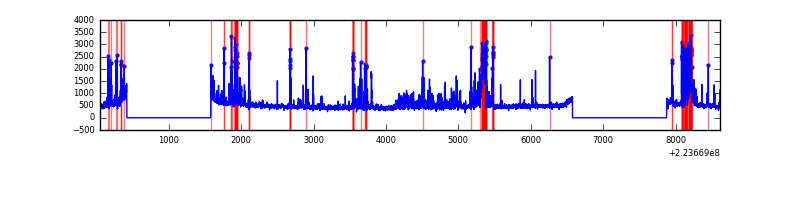 |
Top three noisy pixels from each quadrant. If the there are fewer than three noisy pixels in the level2.evt file, extra rows are filled as -1
| Pixel properties | Quadrant properties | ||||||
|---|---|---|---|---|---|---|---|
| Quadrant | DetID | PixID | Counts | Sigma | Mean | Median | Sigma |
| A | 15 | 234 | 127496 | 817.03 | 760 | 745 | 155.1 |
| A | 8 | 15 | 75145 | 479.58 | 760 | 745 | 155.1 |
| A | 14 | 111 | 12883 | 78.24 | 760 | 745 | 155.1 |
| B | 0 | 214 | 72729 | 493.03 | 771 | 752 | 146.0 |
| B | 4 | 81 | 68172 | 461.81 | 771 | 752 | 146.0 |
| B | 0 | 213 | 31570 | 211.1 | 771 | 752 | 146.0 |
| C | 9 | 68 | 13331 | 72.74 | 746 | 751 | 173.0 |
| C | 1 | 16 | 7729 | 40.35 | 746 | 751 | 173.0 |
| C | 13 | 61 | 5746 | 28.88 | 746 | 751 | 173.0 |
| D | 14 | 34 | 364938 | 2008.05 | 732 | 710 | 181.4 |
| D | 2 | 216 | 287442 | 1580.8 | 732 | 710 | 181.4 |
| D | 13 | 112 | 157470 | 864.24 | 732 | 710 | 181.4 |
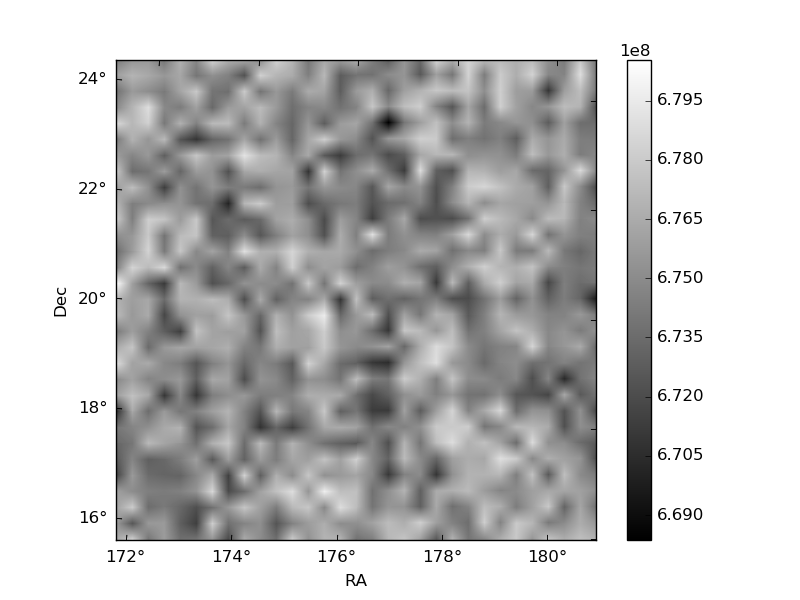
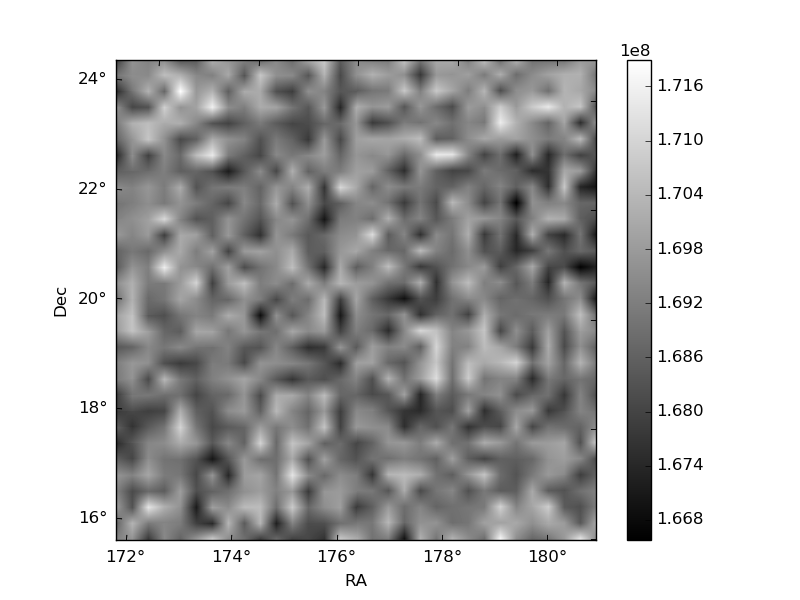
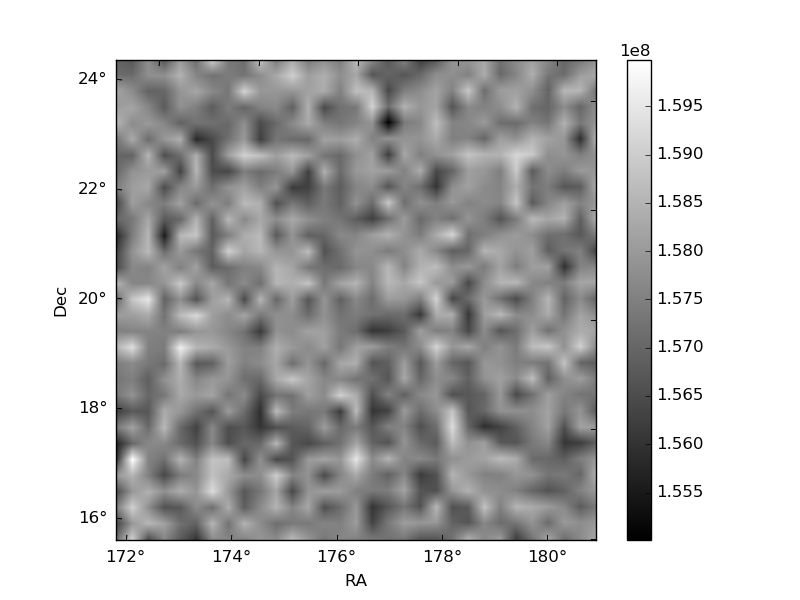
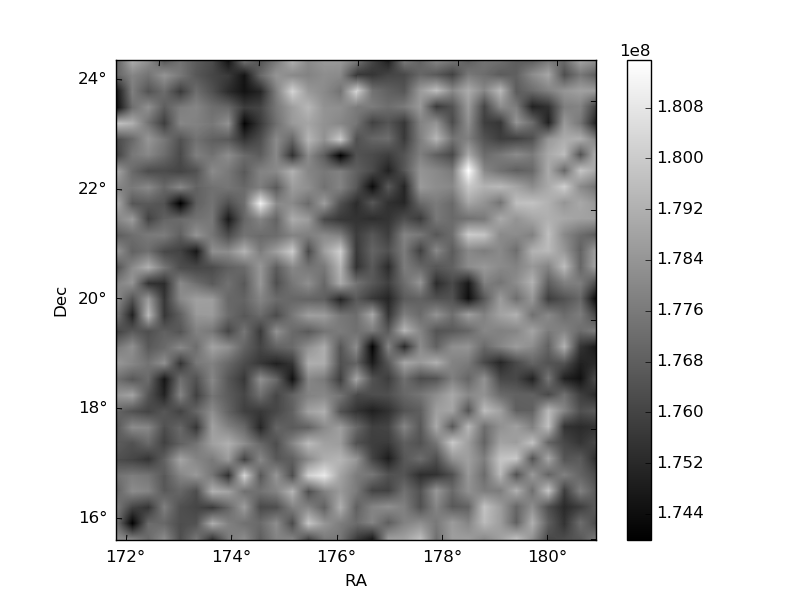
Histogram calculated using DETX and DETY for each event in the final _common_clean file
| Quadrant A | 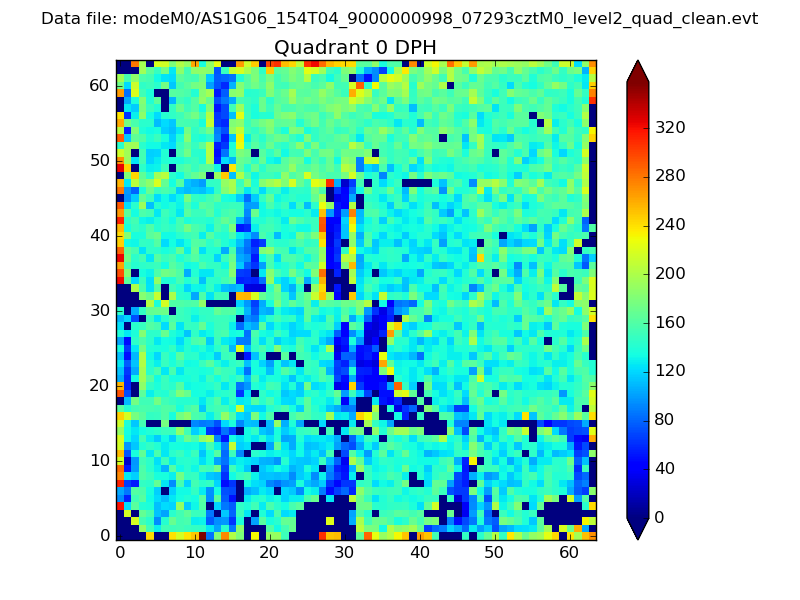 |
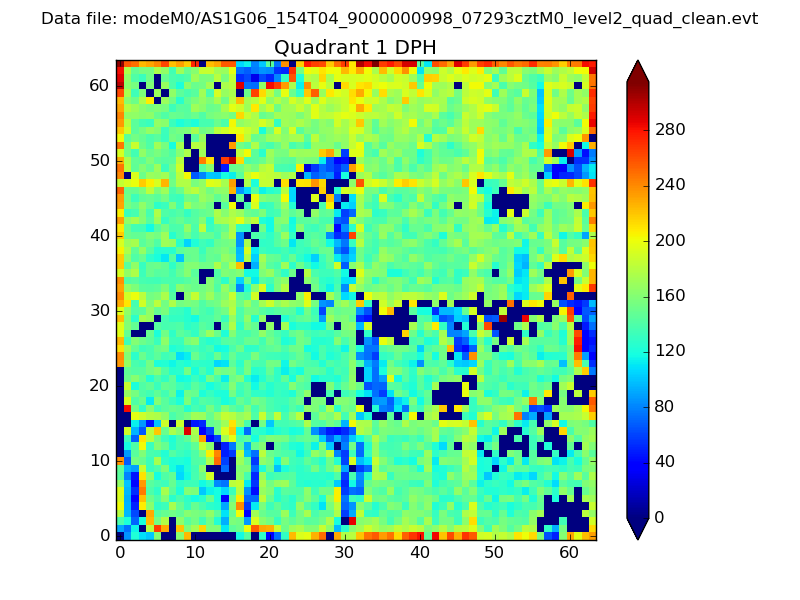 |
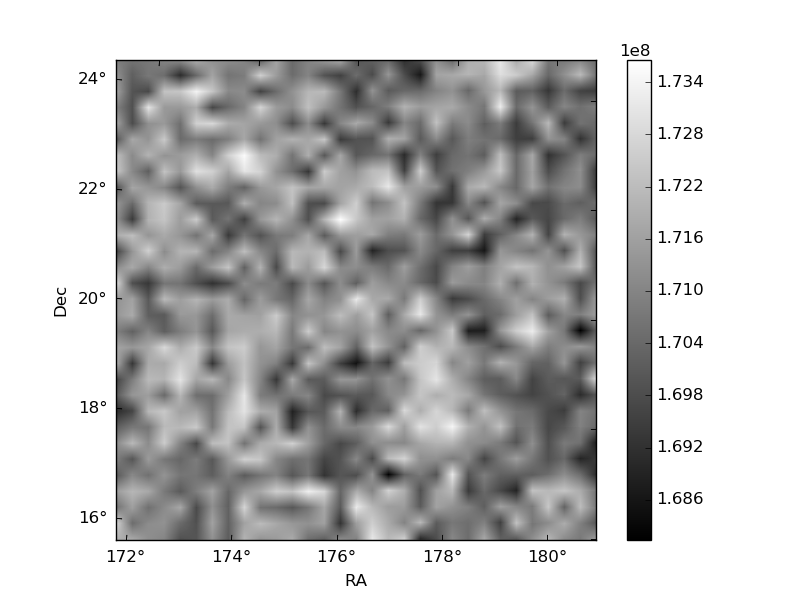
Quadrant B |
|---|---|---|---|
| Quadrant D | 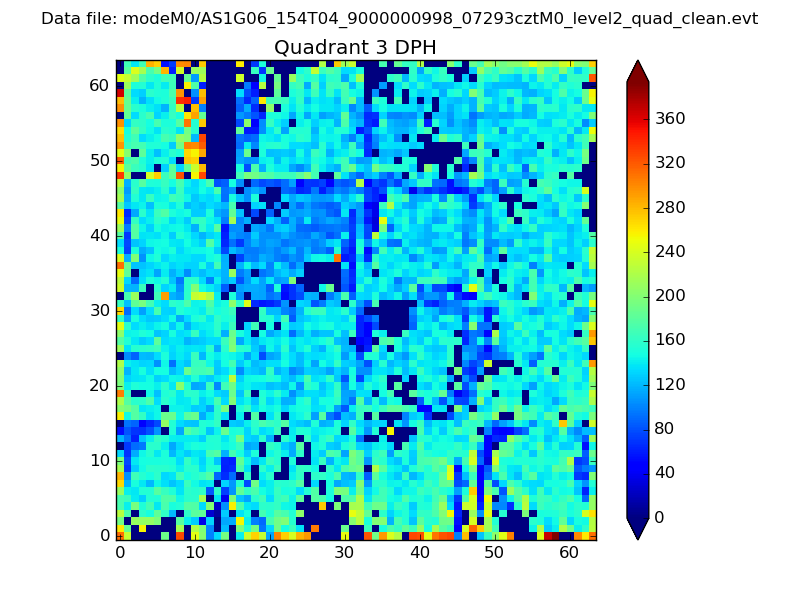 |
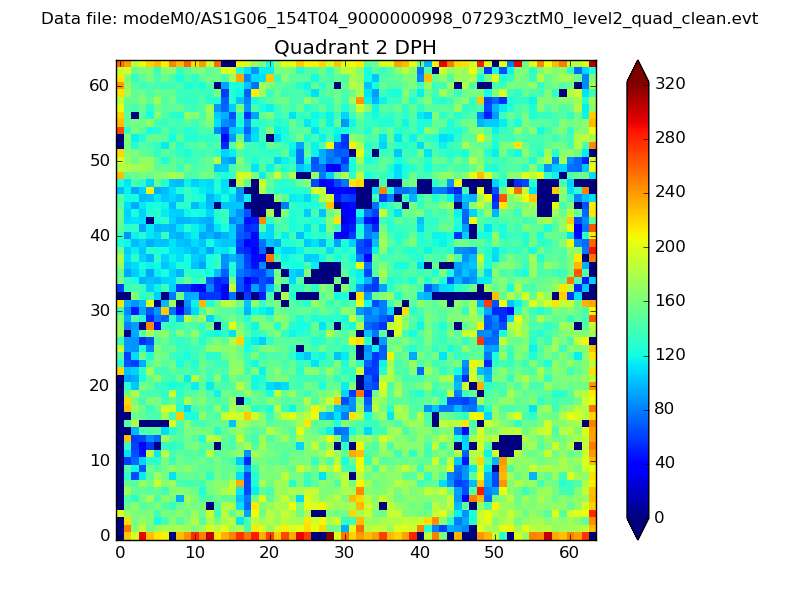 |
Quadrant C |
| Plot type | Count rate plots | Images |
|---|---|---|
| Comparison with Poisson distribution Blue bars denote a histogram of data divided into 1 sec bins. Red curve is a Poisson curve with rate = median count rate of data. |
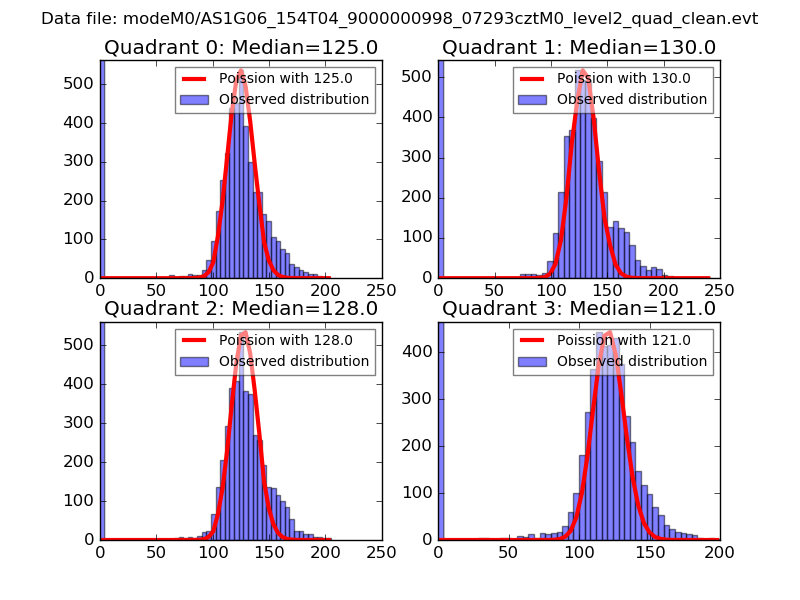 |
 |
| Quadrant-wise count rates Data is divided into 100 sec bins |
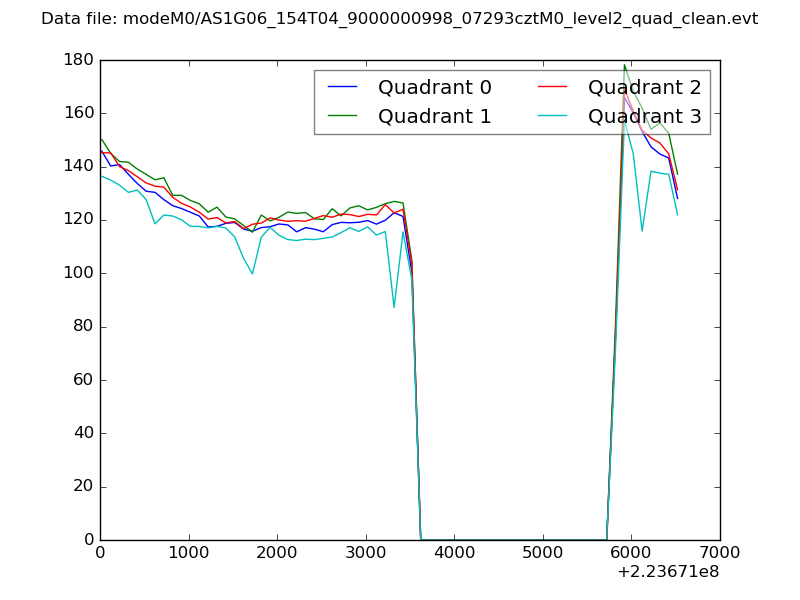 |
|
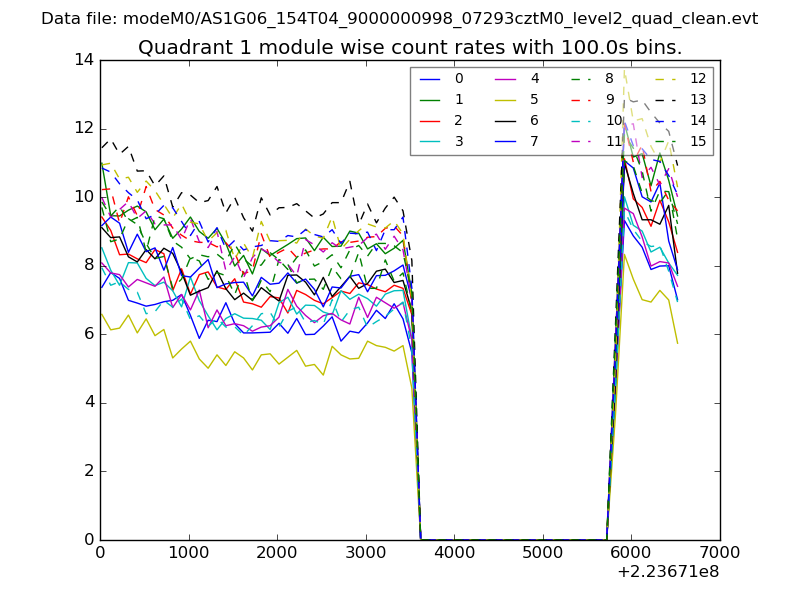
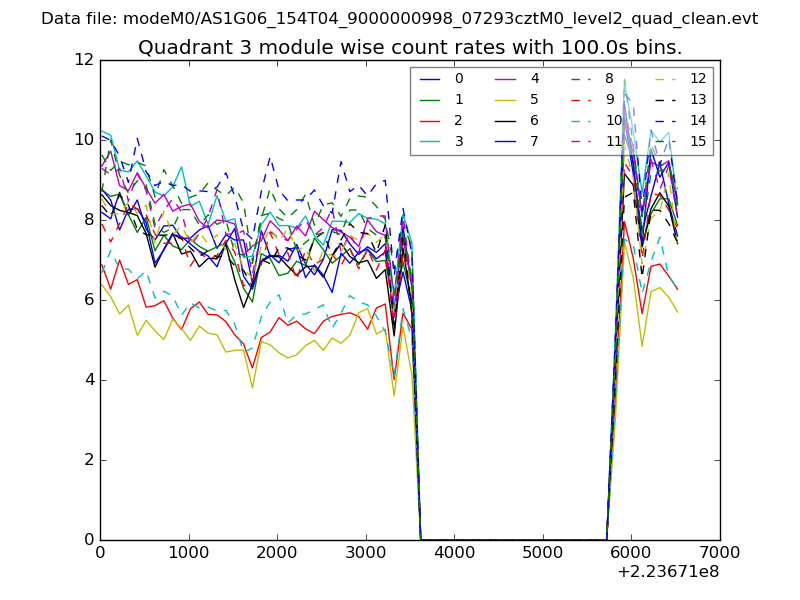
| Module-wise count rates for Quadrant A Data is divided into 100 sec bins |
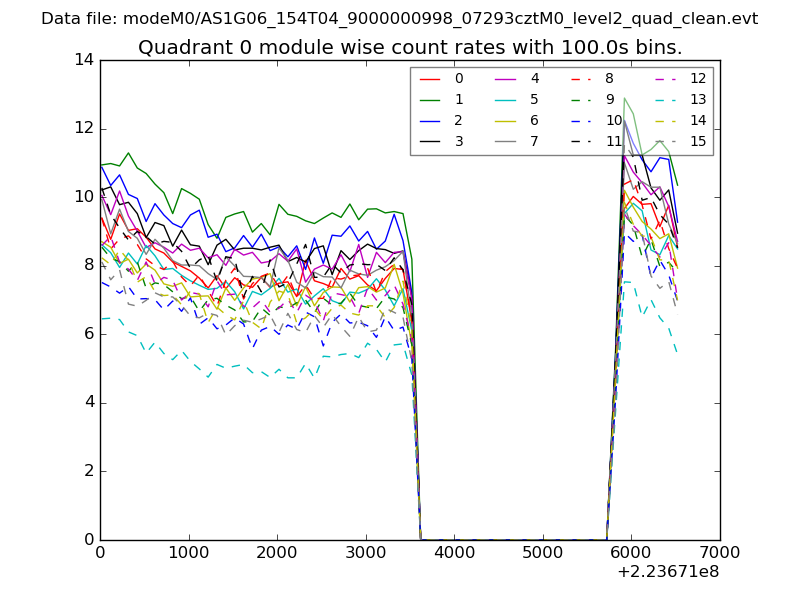 |
 |
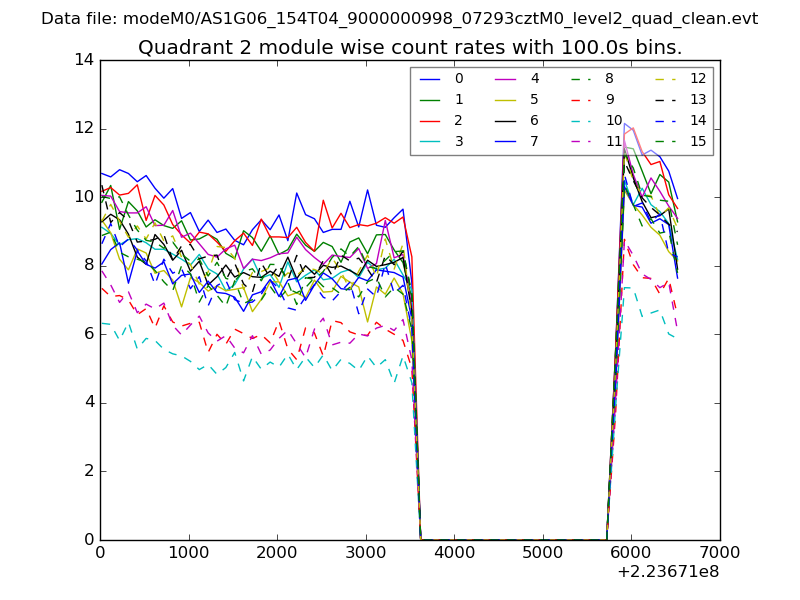
| Module-wise count rates for Quadrant B Data is divided into 100 sec bins |
 |
 |
| Module-wise count rates for Quadrant C Data is divided into 100 sec bins |
 |
 |
| Module-wise count rates for Quadrant D Data is divided into 100 sec bins |
 |
 |
| Parameter | Plot |
|---|---|
| CZT HV Monitor | 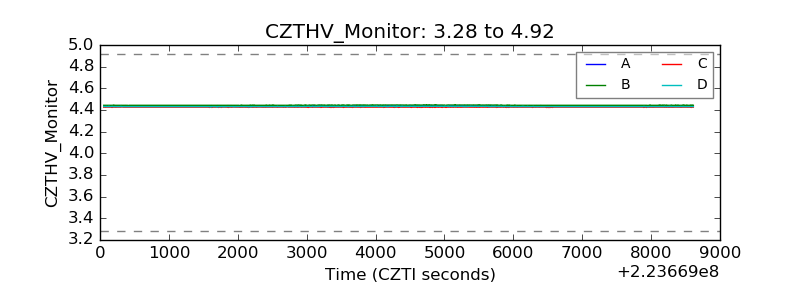 |
| D_VDD | 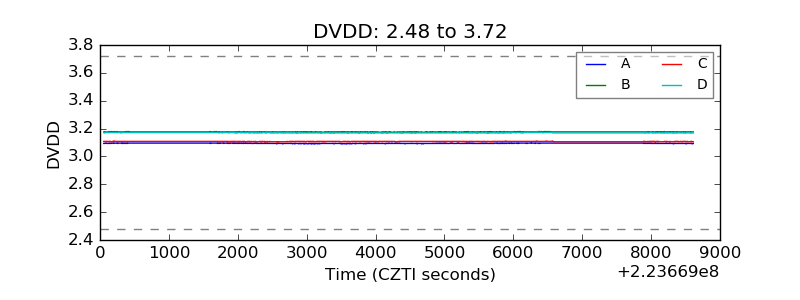 |
| Temperature 1 | 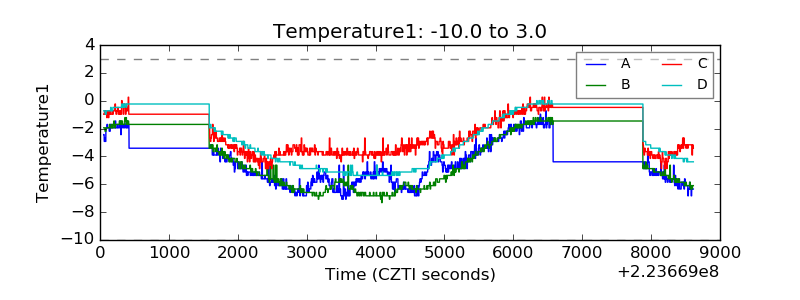 |
| Veto HV Monitor | 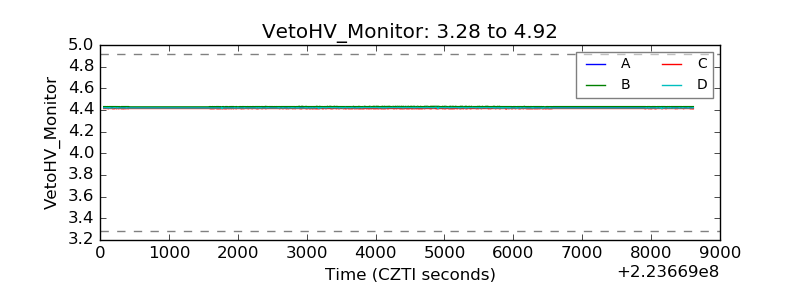 |
| Veto LLD | 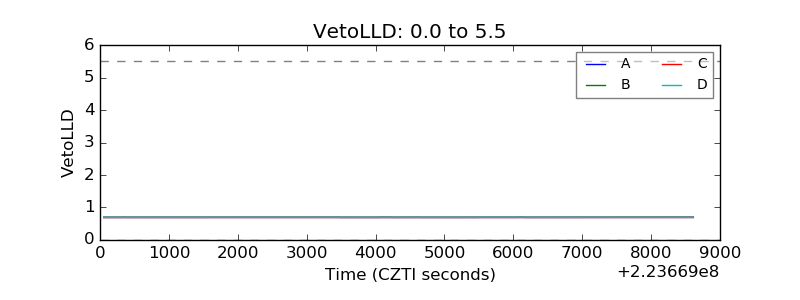 |
| Alpha Counter |  |
| _CPM_Rate | 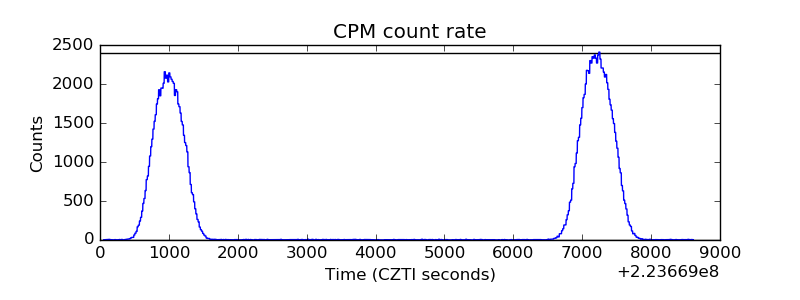 |
| CZT Counter | 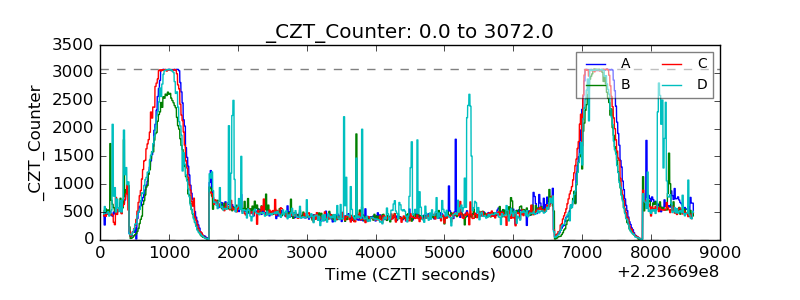 |
| +2.5 Volts monitor |  |
| +5 Volts monitor |  |
| _ROLL_ROT | 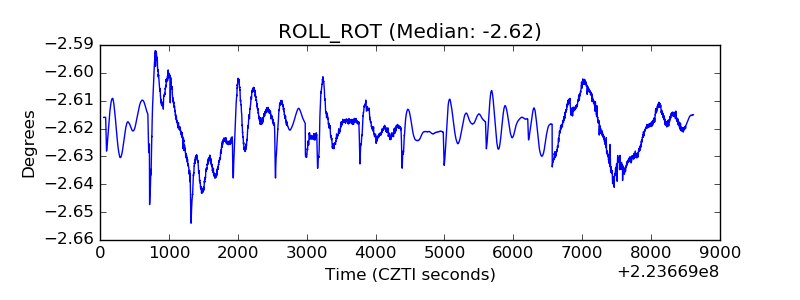 |
| _Roll_DEC | 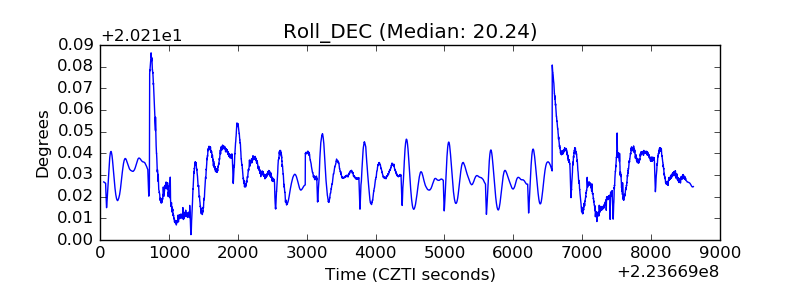 |
| _Roll_RA | 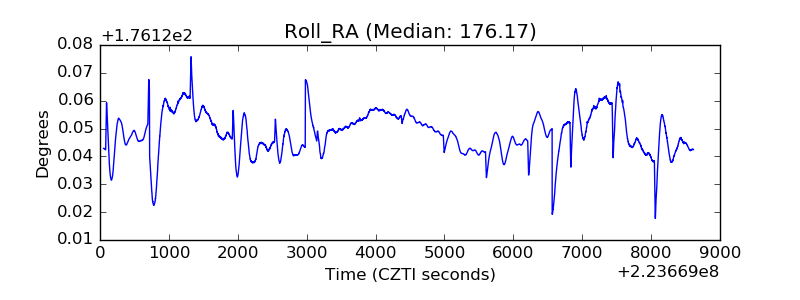 |
| Veto Counter | 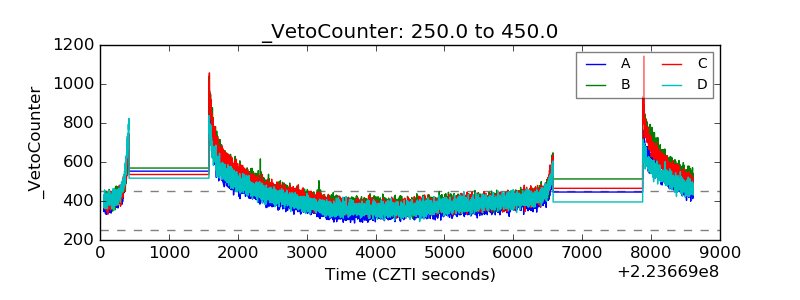 |