| Param | Original file | Final file |
|---|---|---|
| Filename | modeM0/AS1G06_154T04_9000000998_07294cztM0_level2.evt | modeM0/AS1G06_154T04_9000000998_07294cztM0_level2_quad_clean.evt |
| Size (bytes) | 127,831,680 | 18,671,040 |
| Size | 121.9 MB | 17.8 MB |
| Events in quadrant A | 987,094 | 112,092 |
| Events in quadrant B | 924,292 | 119,092 |
| Events in quadrant C | 836,134 | 113,674 |
| Events in quadrant D | 1,013,595 | 102,979 |
| Mode M9 | |||
|---|---|---|---|
| Quadrant | BADHDUFLAG | Total packets | Discarded packets |
| A | 0 | 13 | 0 |
| B | 0 | 13 | 0 |
| C | 0 | 13 | 0 |
| D | 0 | 13 | 0 |
| Mode SS | |||
|---|---|---|---|
| Quadrant | BADHDUFLAG | Total packets | Discarded packets |
| A | 0 | 34 | 0 |
| B | 0 | 34 | 0 |
| C | 0 | 34 | 0 |
| D | 0 | 34 | 0 |
| Mode M0 | |||
|---|---|---|---|
| Quadrant | BADHDUFLAG | Total packets | Discarded packets |
| A | 0 | 4024 | 1 |
| B | 0 | 3716 | 1 |
| C | 0 | 3428 | 1 |
| D | 0 | 4018 | 1 |
| Quadrant | Total seconds | Saturated seconds | Saturation percentage |
|---|---|---|---|
| A | 1583 | 19 | 1.200253% |
| B | 1583 | 24 | 1.516109% |
| C | 1583 | 12 | 0.758054% |
| D | 1583 | 76 | 4.801011% |
Noise dominated data is calculated using 1-second bins in cleaned event files. If a bin has >2000 counts, and if more than 50% of those come from <1% of pixels, then it is considered to be noise-dominated and hence unusable.
| Quadrant | # 1 sec bins | Bins with >0 counts | Bins with >2000 counts | High rate bins dominated by noise | Noise dominated (total time) | Noise dominated (detector-on time) | Marked lightcurve |
|---|---|---|---|---|---|---|---|
| A | 2883 | 1583 | 0 | 0 | 0.00% | 0.00% | 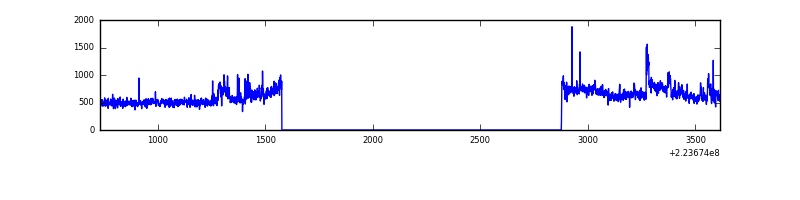 |
| B | 2883 | 1584 | 1 | 1 | 0.03% | 0.06% | 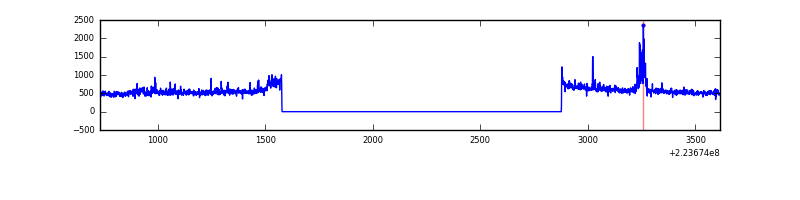 |
| C | 2883 | 1584 | 0 | 0 | 0.00% | 0.00% | 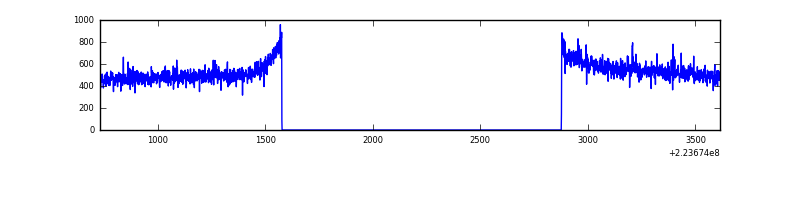 |
| D | 2883 | 1584 | 56 | 56 | 1.94% | 3.54% | 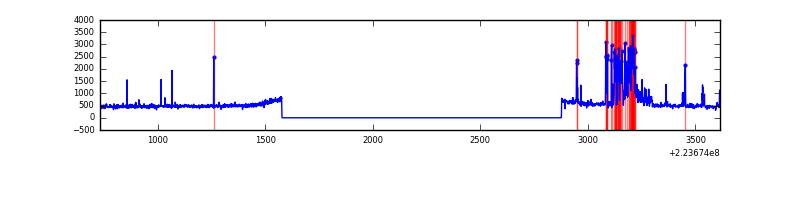 |
Top three noisy pixels from each quadrant. If the there are fewer than three noisy pixels in the level2.evt file, extra rows are filled as -1
| Pixel properties | Quadrant properties | ||||||
|---|---|---|---|---|---|---|---|
| Quadrant | DetID | PixID | Counts | Sigma | Mean | Median | Sigma |
| A | 15 | 234 | 119970 | 2595.33 | 217 | 212 | 46.1 |
| A | 8 | 15 | 27523 | 591.87 | 217 | 212 | 46.1 |
| A | 14 | 111 | 4240 | 87.29 | 217 | 212 | 46.1 |
| B | 0 | 214 | 30900 | 707.69 | 220 | 215 | 43.4 |
| B | 0 | 213 | 28274 | 647.13 | 220 | 215 | 43.4 |
| B | 4 | 81 | 6405 | 142.76 | 220 | 215 | 43.4 |
| C | 9 | 68 | 4060 | 76.37 | 212 | 213 | 50.4 |
| C | 1 | 16 | 1847 | 32.44 | 212 | 213 | 50.4 |
| C | 13 | 61 | 1594 | 27.41 | 212 | 213 | 50.4 |
| D | 14 | 34 | 207136 | 3840.71 | 209 | 202 | 53.9 |
| D | 1 | 52 | 11992 | 218.82 | 209 | 202 | 53.9 |
| D | 7 | 55 | 4213 | 74.44 | 209 | 202 | 53.9 |
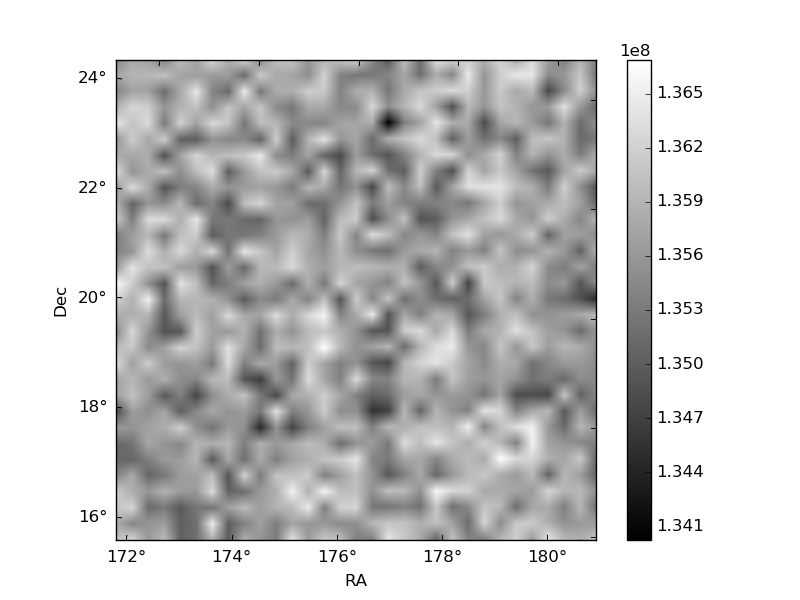
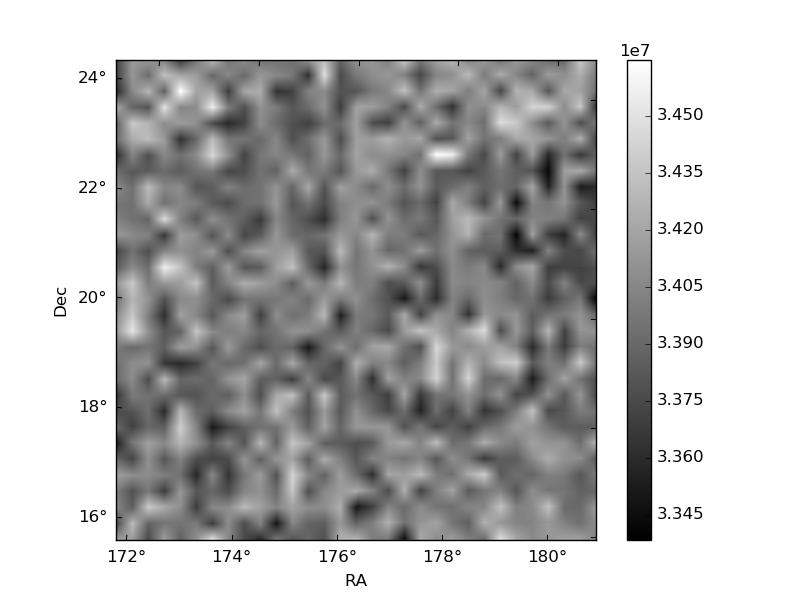
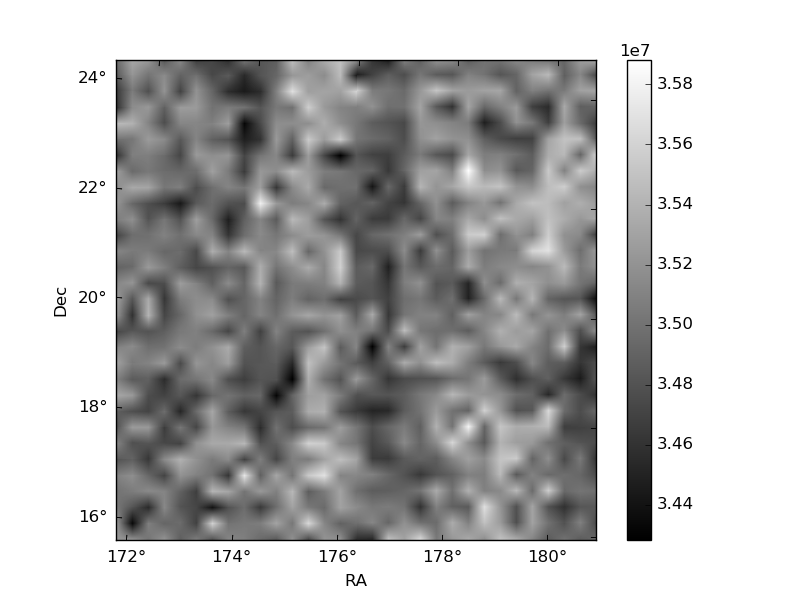
Histogram calculated using DETX and DETY for each event in the final _common_clean file
| Quadrant A | 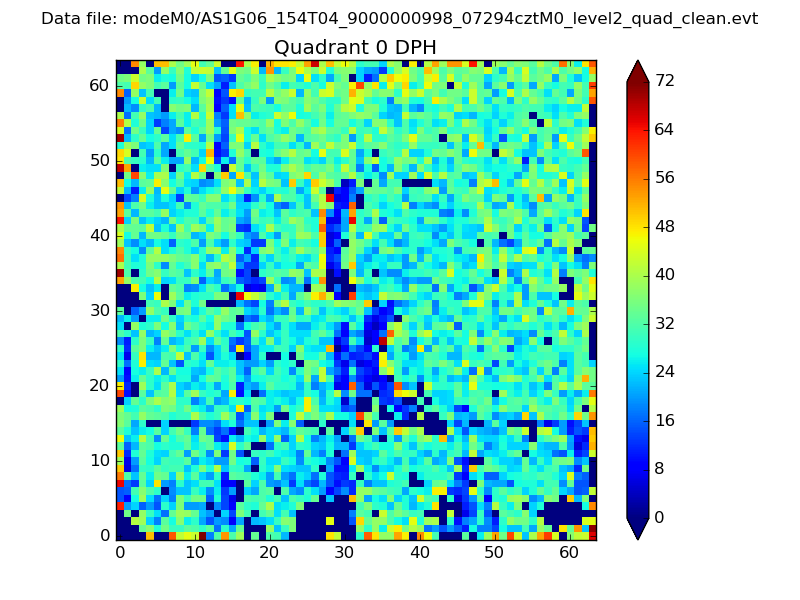 |
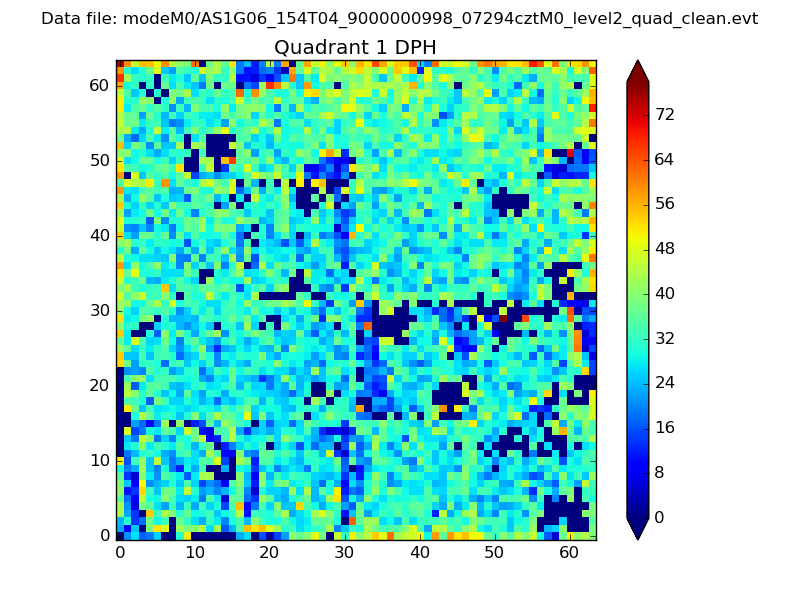 |
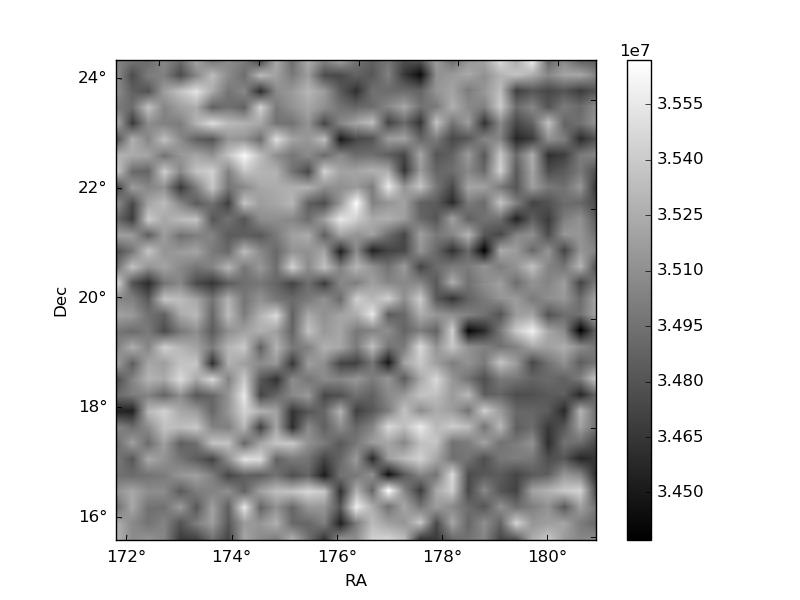
Quadrant B |
|---|---|---|---|
| Quadrant D | 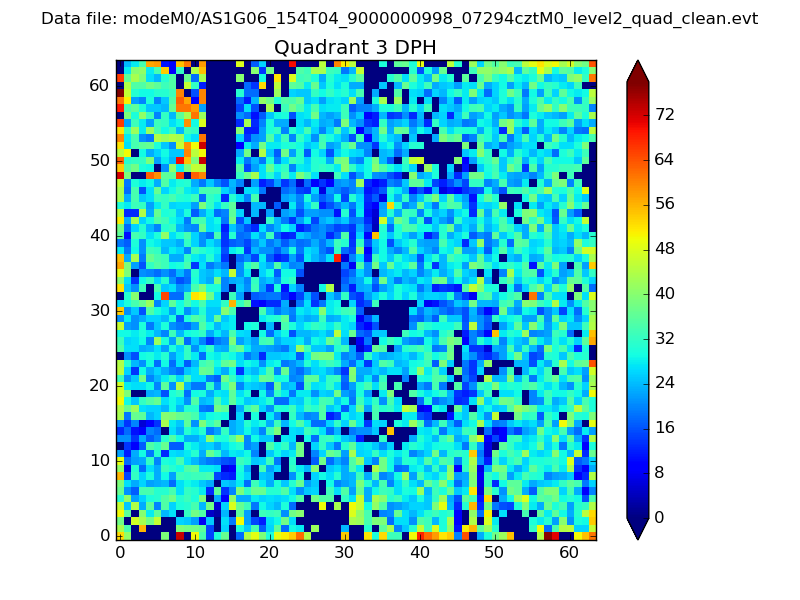 |
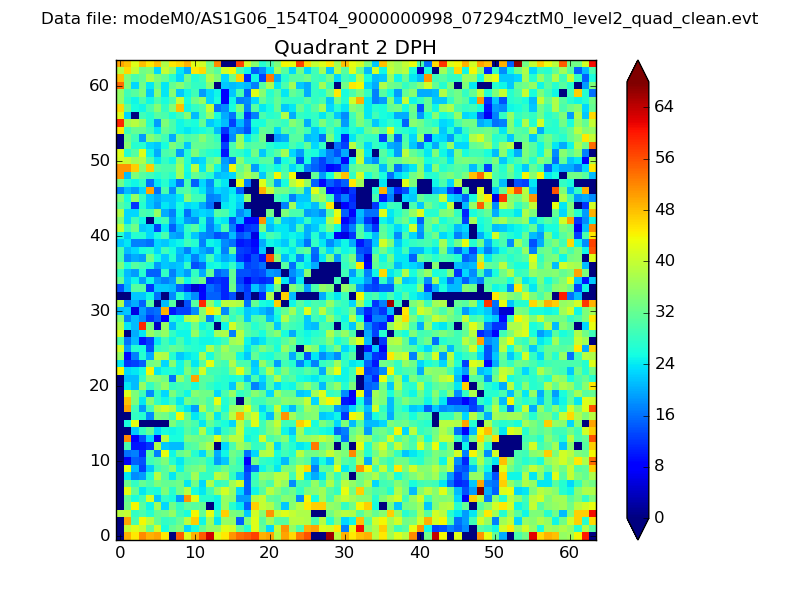 |
Quadrant C |
| Plot type | Count rate plots | Images |
|---|---|---|
| Comparison with Poisson distribution Blue bars denote a histogram of data divided into 1 sec bins. Red curve is a Poisson curve with rate = median count rate of data. |
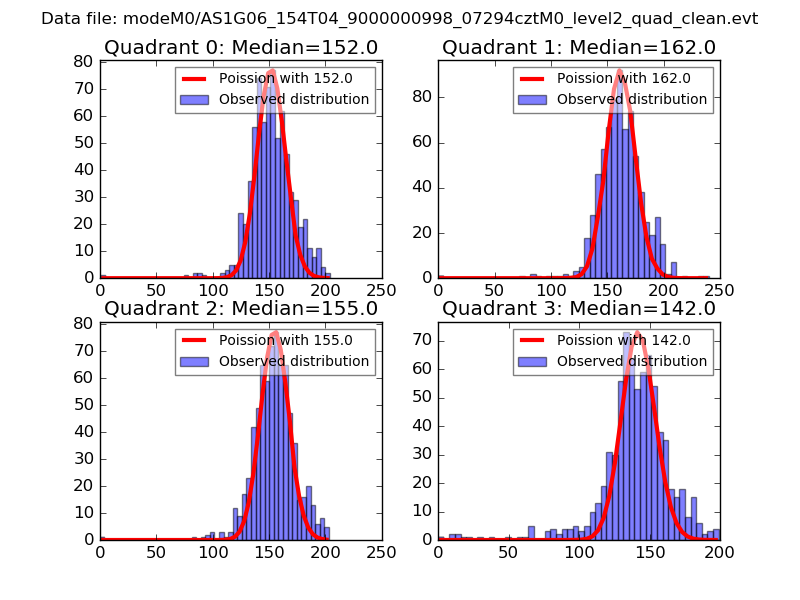 |
 |
| Quadrant-wise count rates Data is divided into 100 sec bins |
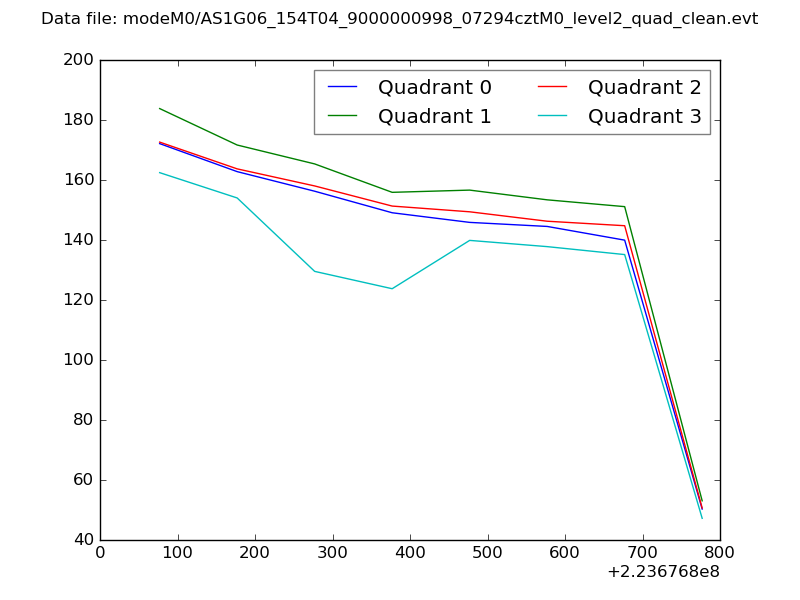 |
|
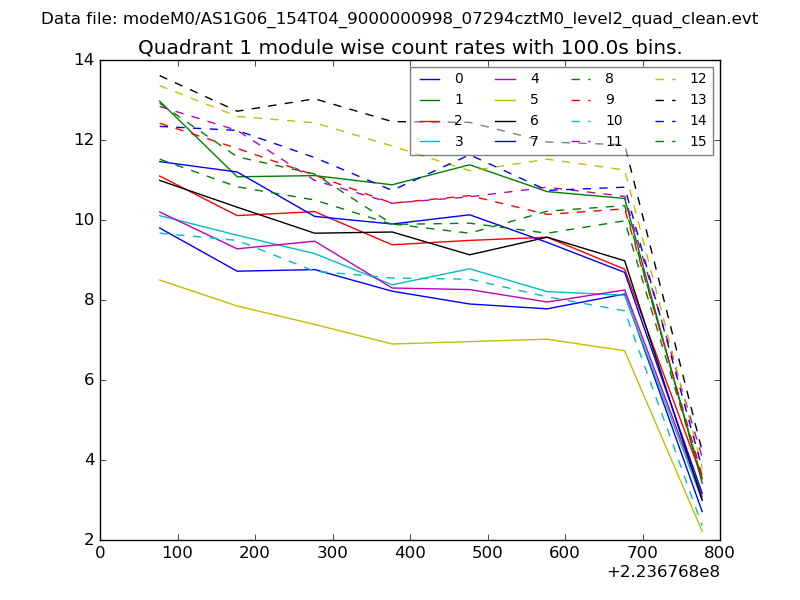
| Module-wise count rates for Quadrant A Data is divided into 100 sec bins |
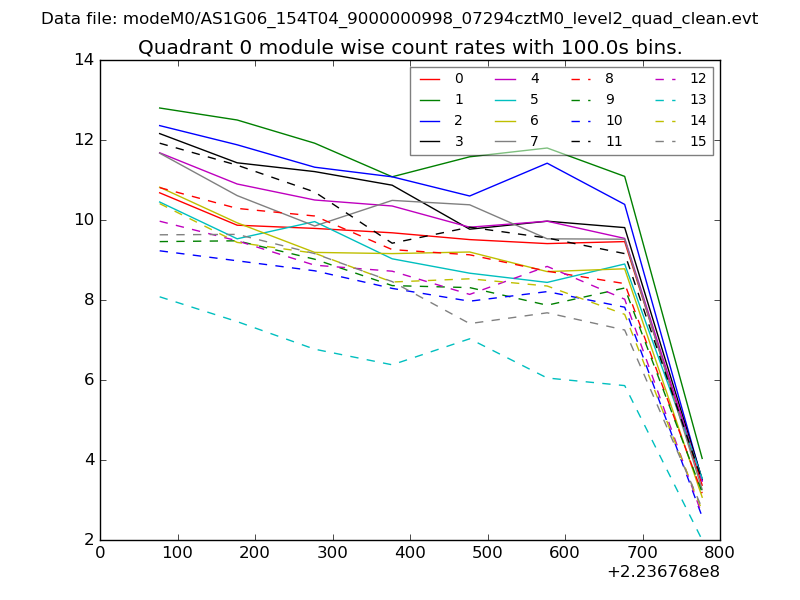 |
 |
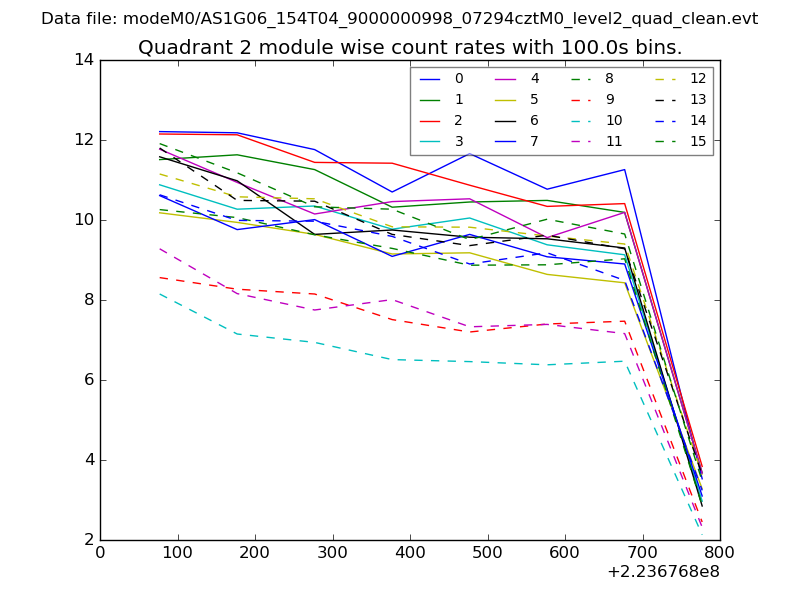
| Module-wise count rates for Quadrant B Data is divided into 100 sec bins |
 |
 |
| Module-wise count rates for Quadrant C Data is divided into 100 sec bins |
 |
 |
| Module-wise count rates for Quadrant D Data is divided into 100 sec bins |
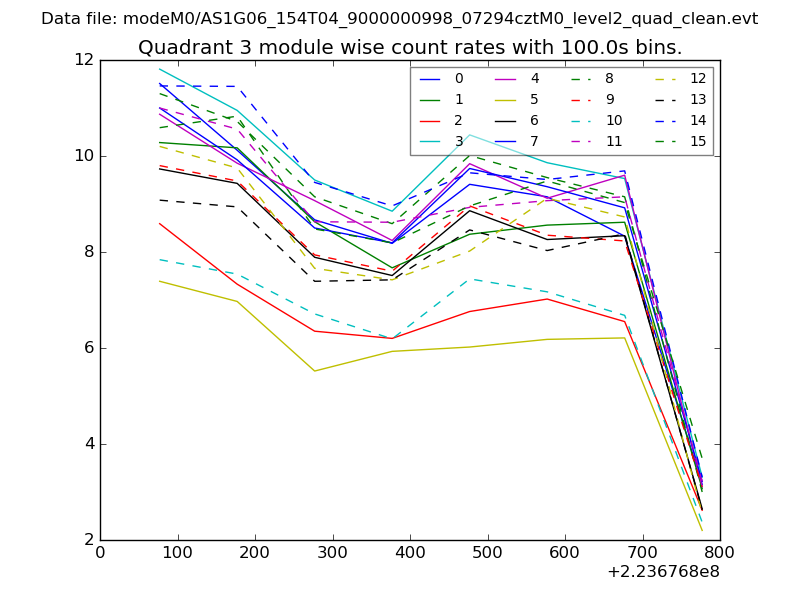 |
 |
| Parameter | Plot |
|---|---|
| CZT HV Monitor | 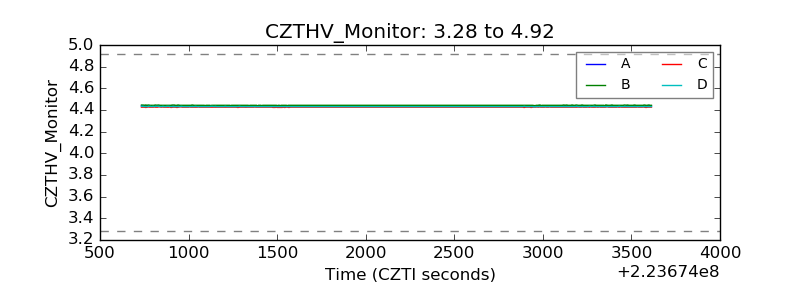 |
| D_VDD | 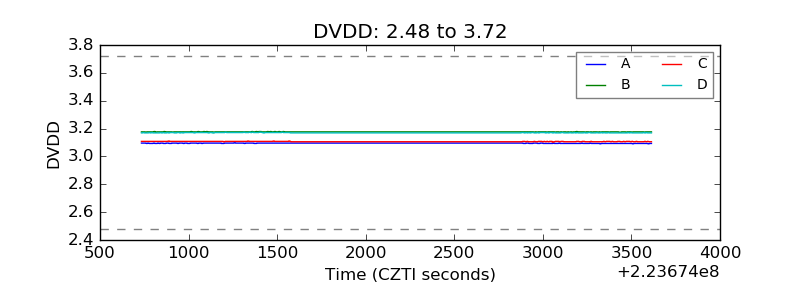 |
| Temperature 1 | 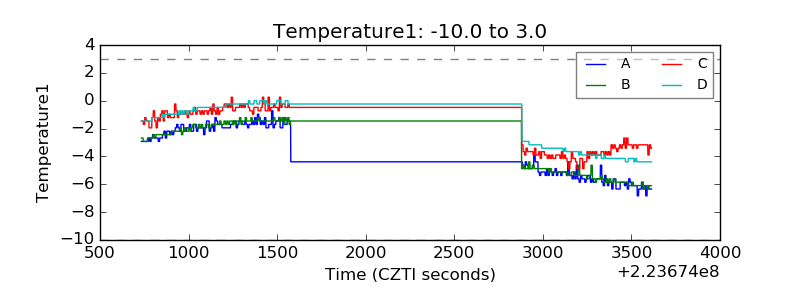 |
| Veto HV Monitor | 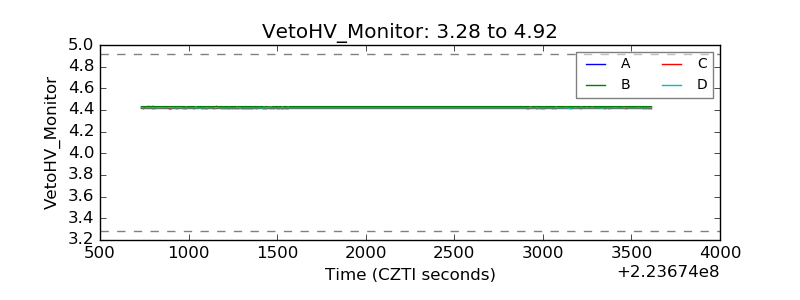 |
| Veto LLD | 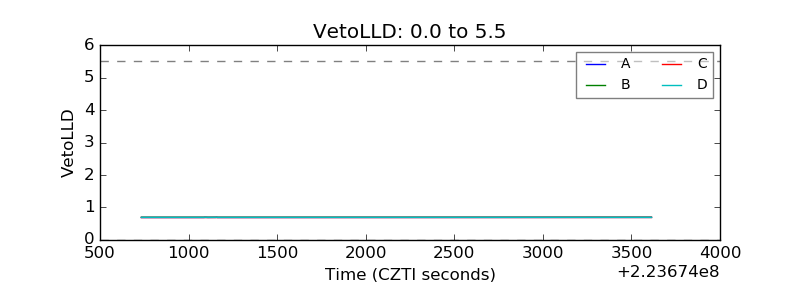 |
| Alpha Counter | 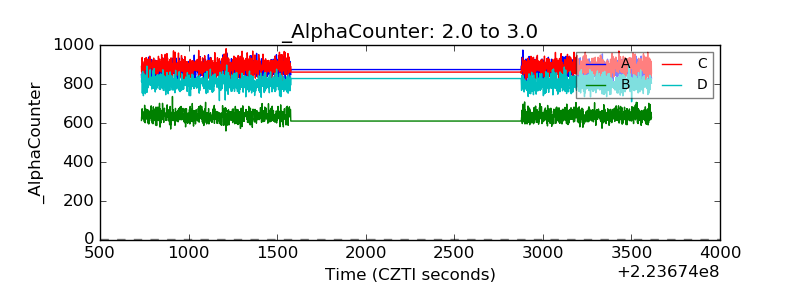 |
| _CPM_Rate | 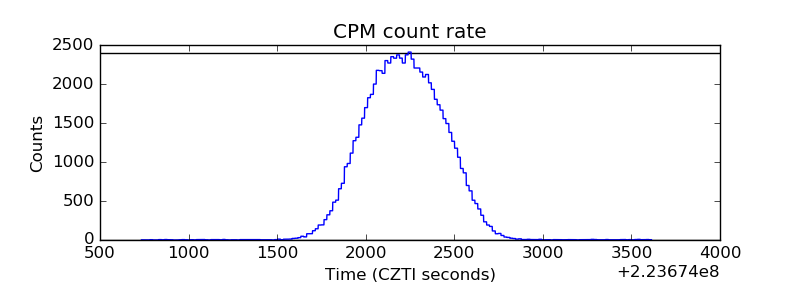 |
| CZT Counter | 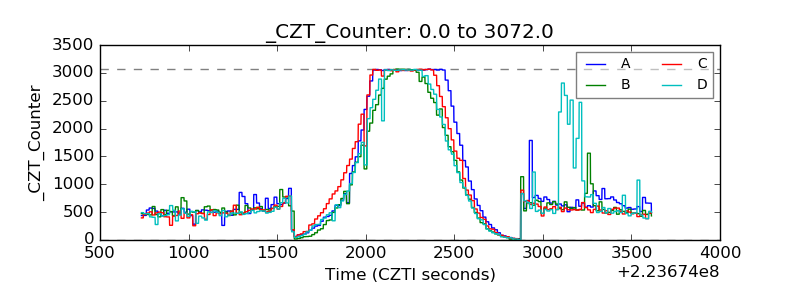 |
| +2.5 Volts monitor |  |
| +5 Volts monitor |  |
| _ROLL_ROT | 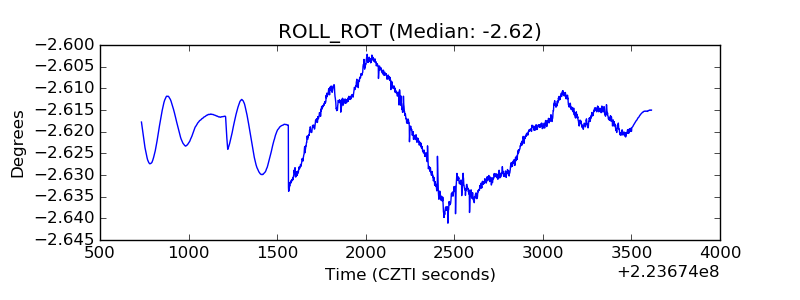 |
| _Roll_DEC | 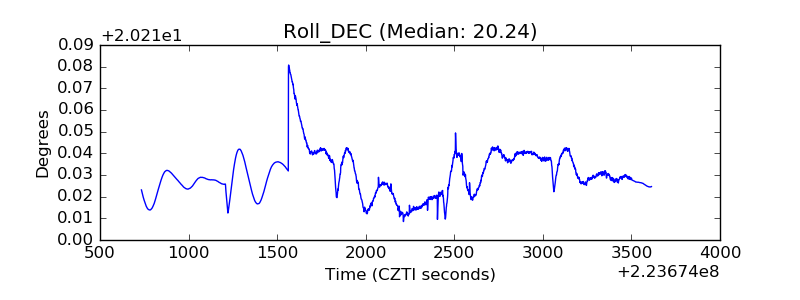 |
| _Roll_RA | 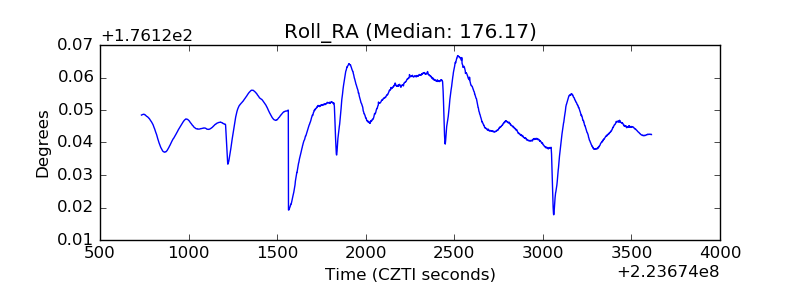 |
| Veto Counter | 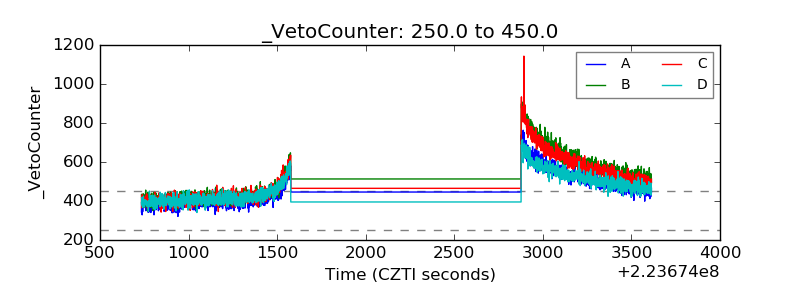 |