| Param | Original file | Final file |
|---|---|---|
| Filename | modeM0/AS1G06_137T02_9000001002cztM0_level2.fits | modeM0/AS1G06_137T02_9000001002cztM0_level2_quad_clean.evt |
| Size (bytes) | 592,398,720 | 580,325,760 |
| Size | 565.0 MB | 553.4 MB |
| Events in quadrant A | 3,513,892 | 3,409,370 |
| Events in quadrant B | 3,474,724 | 3,470,515 |
| Events in quadrant C | 3,559,126 | 3,345,475 |
| Events in quadrant D | 2,989,016 | 2,947,362 |
| Mode M0 | |||
|---|---|---|---|
| Quadrant | BADHDUFLAG | Total packets | Discarded packets |
| A | 0 | 142958 | 0 |
| B | 0 | 136450 | 0 |
| C | 0 | 133479 | 0 |
| D | 0 | 165667 | 0 |
| Mode SS | |||
|---|---|---|---|
| Quadrant | BADHDUFLAG | Total packets | Discarded packets |
| A | 0 | 1308 | 0 |
| B | 0 | 1308 | 0 |
| C | 0 | 1308 | 0 |
| D | 0 | 1308 | 0 |
| Mode M9 | |||
|---|---|---|---|
| Quadrant | BADHDUFLAG | Total packets | Discarded packets |
| A | 0 | 108 | 0 |
| B | 0 | 108 | 0 |
| C | 0 | 108 | 0 |
| D | 0 | 108 | 0 |
| Quadrant | Total seconds | Saturated seconds | Saturation percentage |
|---|---|---|---|
| A | 64188 | 1663 | 2.590827% |
| B | 64188 | 892 | 1.389668% |
| C | 64189 | 722 | 1.124803% |
| D | 64191 | 2791 | 4.347962% |
Noise dominated data is calculated using 1-second bins in cleaned event files. If a bin has >2000 counts, and if more than 50% of those come from <1% of pixels, then it is considered to be noise-dominated and hence unusable.
| Quadrant | # 1 sec bins | Bins with >0 counts | Bins with >2000 counts | High rate bins dominated by noise | Noise dominated (total time) | Noise dominated (detector-on time) | Marked lightcurve |
|---|---|---|---|---|---|---|---|
| A | 74927 | 64146 | 0 | 0 | 0.00% | 0.00% | 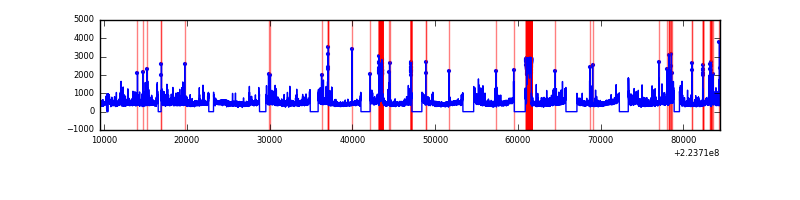 |
| B | 74927 | 64183 | 0 | 0 | 0.00% | 0.00% |  |
| C | 74927 | 64186 | 0 | 0 | 0.00% | 0.00% |  |
| D | 74927 | 63915 | 0 | 0 | 0.00% | 0.00% |  |
Top three noisy pixels from each quadrant. If the there are fewer than three noisy pixels in the level2.evt file, extra rows are filled as -1
| Pixel properties | Quadrant properties | ||||||
|---|---|---|---|---|---|---|---|
| Quadrant | DetID | PixID | Counts | Sigma | Mean | Median | Sigma |
| A | 0 | 29 | 3423 | 10.92 | 914 | 849 | 235.6 |
| A | 7 | 110 | 2926 | 8.82 | 914 | 849 | 235.6 |
| A | 0 | 30 | 2646 | 7.63 | 914 | 849 | 235.6 |
| B | 2 | 9 | 2971 | 11.21 | 917 | 869 | 187.5 |
| B | 5 | 128 | 2344 | 7.87 | 917 | 869 | 187.5 |
| B | 14 | 254 | 2316 | 7.72 | 917 | 869 | 187.5 |
| C | 1 | 80 | 2630 | 7.04 | 939 | 866 | 250.6 |
| C | 1 | 81 | 2562 | 6.77 | 939 | 866 | 250.6 |
| C | 12 | 241 | 2491 | 6.49 | 939 | 866 | 250.6 |
| D | 6 | 231 | 2242 | 6.37 | 852 | 770 | 231.0 |
| D | 10 | 189 | 2197 | 6.18 | 852 | 770 | 231.0 |
| D | 11 | 82 | 2149 | 5.97 | 852 | 770 | 231.0 |
Histogram calculated using DETX and DETY for each event in the final _common_clean file
| Quadrant A |  |
 |
Quadrant B |
|---|---|---|---|
| Quadrant D |  |
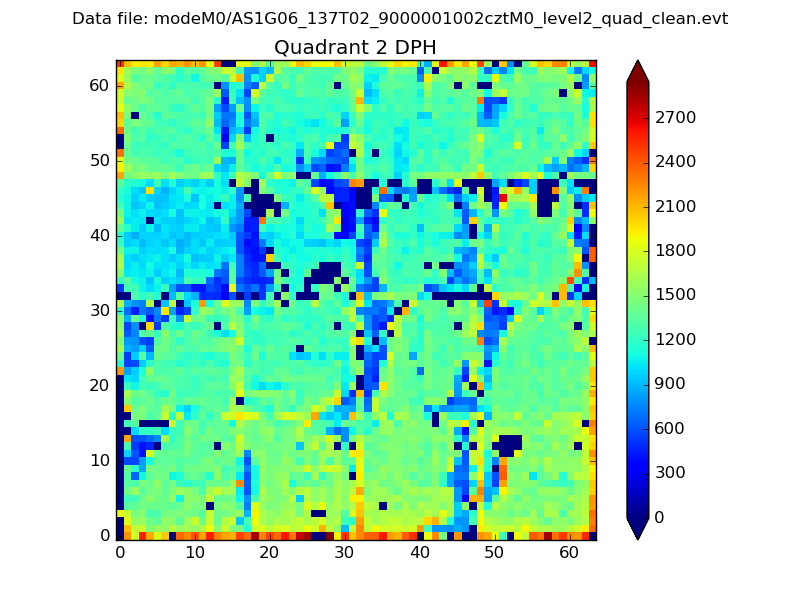 |
Quadrant C |
| Plot type | Count rate plots | Images |
|---|---|---|
| Comparison with Poisson distribution Blue bars denote a histogram of data divided into 1 sec bins. Red curve is a Poisson curve with rate = median count rate of data. |
 |
 |
| Quadrant-wise count rates Data is divided into 100 sec bins |
 |
|
| Module-wise count rates for Quadrant A Data is divided into 100 sec bins |
 |
 |
| Module-wise count rates for Quadrant B Data is divided into 100 sec bins |
 |
 |
| Module-wise count rates for Quadrant C Data is divided into 100 sec bins |
 |
 |
| Module-wise count rates for Quadrant D Data is divided into 100 sec bins |
 |
 |
| Parameter | Plot |
|---|---|
| CZT HV Monitor |  |
| D_VDD |  |
| Temperature 1 |  |
| Veto HV Monitor |  |
| Veto LLD | 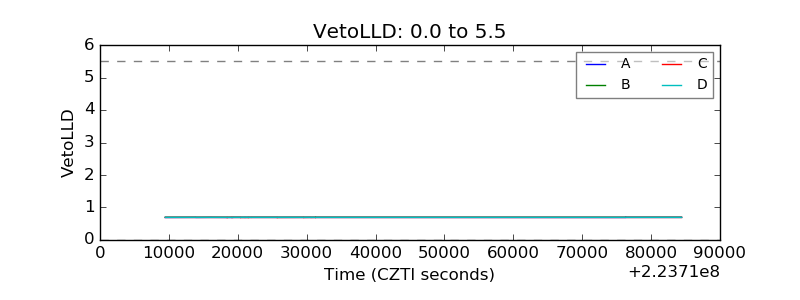 |
| Alpha Counter |  |
| _CPM_Rate |  |
| CZT Counter |  |
| +2.5 Volts monitor |  |
| +5 Volts monitor |  |
| _ROLL_ROT |  |
| _Roll_DEC |  |
| _Roll_RA |  |
| Veto Counter |  |