| Param | Original file | Final file |
|---|---|---|
| Filename | modeM0/AS1G06_137T02_9000001002_07300cztM0_level2.evt | modeM0/AS1G06_137T02_9000001002_07300cztM0_level2_quad_clean.evt |
| Size (bytes) | 187,237,440 | 39,983,040 |
| Size | 178.6 MB | 38.1 MB |
| Events in quadrant A | 1,337,210 | 253,107 |
| Events in quadrant B | 1,302,735 | 261,550 |
| Events in quadrant C | 1,305,286 | 259,778 |
| Events in quadrant D | 1,543,666 | 246,950 |
| Mode M0 | |||
|---|---|---|---|
| Quadrant | BADHDUFLAG | Total packets | Discarded packets |
| A | 0 | 5752 | 11 |
| B | 0 | 5663 | 10 |
| C | 0 | 5727 | 4 |
| D | 0 | 6483 | 1 |
| Mode SS | |||
|---|---|---|---|
| Quadrant | BADHDUFLAG | Total packets | Discarded packets |
| A | 0 | 54 | 0 |
| B | 0 | 54 | 0 |
| C | 0 | 54 | 0 |
| D | 0 | 54 | 0 |
| Mode M9 | |||
|---|---|---|---|
| Quadrant | BADHDUFLAG | Total packets | Discarded packets |
| A | 0 | 1 | 0 |
| B | 0 | 1 | 0 |
| C | 0 | 1 | 0 |
| D | 0 | 1 | 0 |
| Quadrant | Total seconds | Saturated seconds | Saturation percentage |
|---|---|---|---|
| A | 2634 | 200 | 7.593014% |
| B | 2634 | 199 | 7.555049% |
| C | 2636 | 160 | 6.069803% |
| D | 2637 | 221 | 8.380736% |
Noise dominated data is calculated using 1-second bins in cleaned event files. If a bin has >2000 counts, and if more than 50% of those come from <1% of pixels, then it is considered to be noise-dominated and hence unusable.
| Quadrant | # 1 sec bins | Bins with >0 counts | Bins with >2000 counts | High rate bins dominated by noise | Noise dominated (total time) | Noise dominated (detector-on time) | Marked lightcurve |
|---|---|---|---|---|---|---|---|
| A | 2697 | 2636 | 0 | 0 | 0.00% | 0.00% | 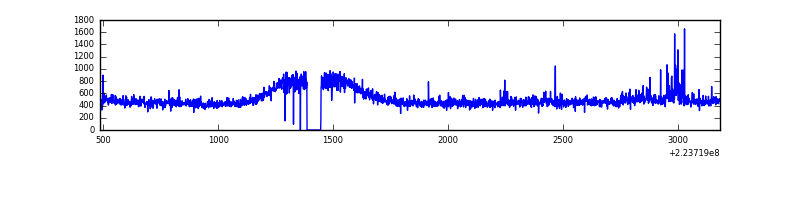 |
| B | 2697 | 2637 | 0 | 0 | 0.00% | 0.00% | 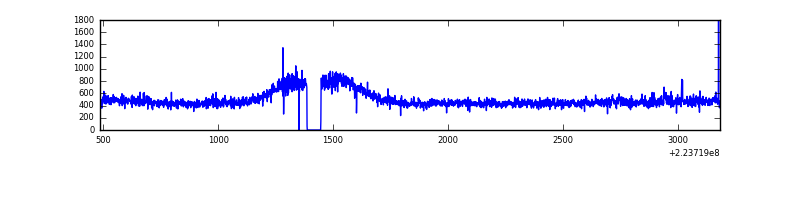 |
| C | 2697 | 2638 | 1 | 1 | 0.04% | 0.04% | 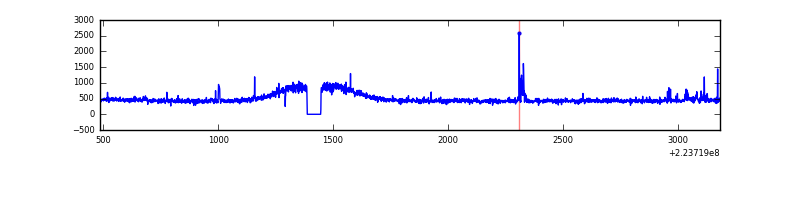 |
| D | 2697 | 2638 | 39 | 39 | 1.45% | 1.48% | 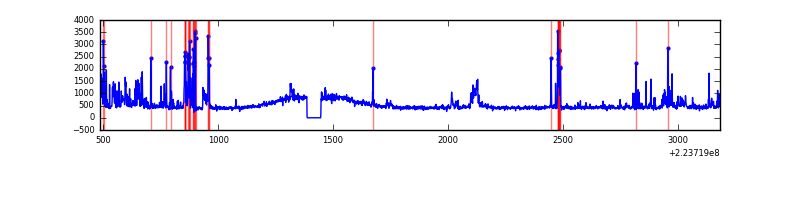 |
Top three noisy pixels from each quadrant. If the there are fewer than three noisy pixels in the level2.evt file, extra rows are filled as -1
| Pixel properties | Quadrant properties | ||||||
|---|---|---|---|---|---|---|---|
| Quadrant | DetID | PixID | Counts | Sigma | Mean | Median | Sigma |
| A | 8 | 15 | 53272 | 750.52 | 330 | 322 | 70.6 |
| A | 13 | 170 | 6079 | 81.6 | 330 | 322 | 70.6 |
| A | 3 | 1 | 4455 | 58.58 | 330 | 322 | 70.6 |
| B | 4 | 81 | 16123 | 232.39 | 331 | 321 | 68.0 |
| B | 12 | 111 | 7241 | 101.77 | 331 | 321 | 68.0 |
| B | 11 | 111 | 5743 | 79.74 | 331 | 321 | 68.0 |
| C | 7 | 247 | 27900 | 357.23 | 323 | 324 | 77.2 |
| C | 9 | 68 | 11367 | 143.05 | 323 | 324 | 77.2 |
| C | 1 | 16 | 3999 | 47.61 | 323 | 324 | 77.2 |
| D | 2 | 216 | 168808 | 2070.09 | 321 | 307 | 81.4 |
| D | 2 | 14 | 123978 | 1519.34 | 321 | 307 | 81.4 |
| D | 12 | 233 | 26780 | 325.23 | 321 | 307 | 81.4 |
Histogram calculated using DETX and DETY for each event in the final _common_clean file
| Quadrant A | 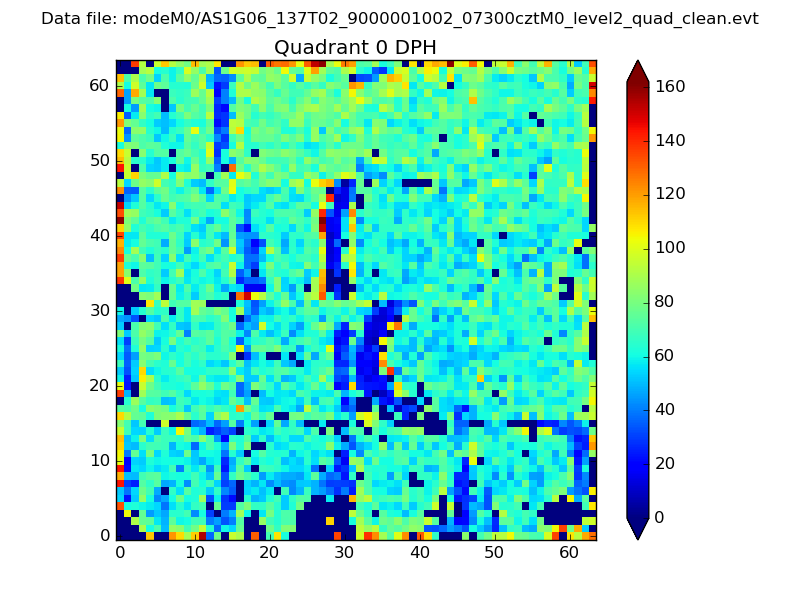 |
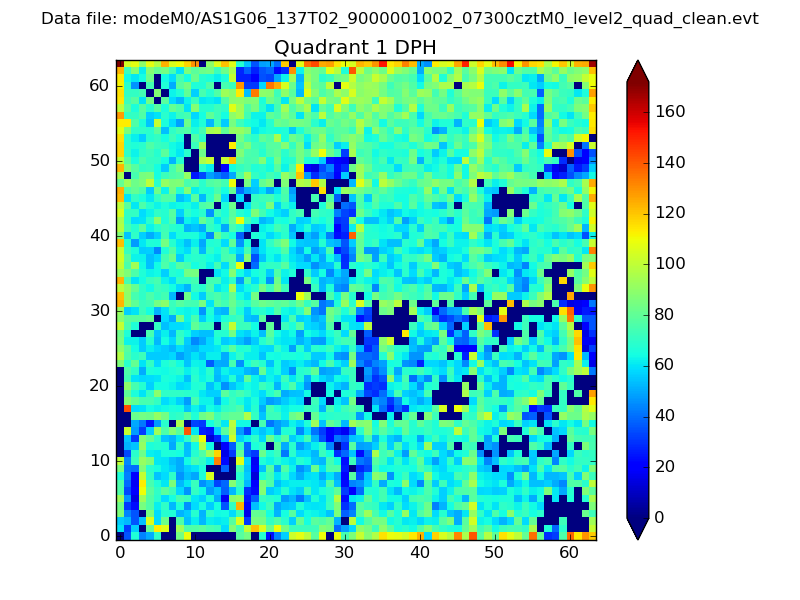 |
Quadrant B |
|---|---|---|---|
| Quadrant D | 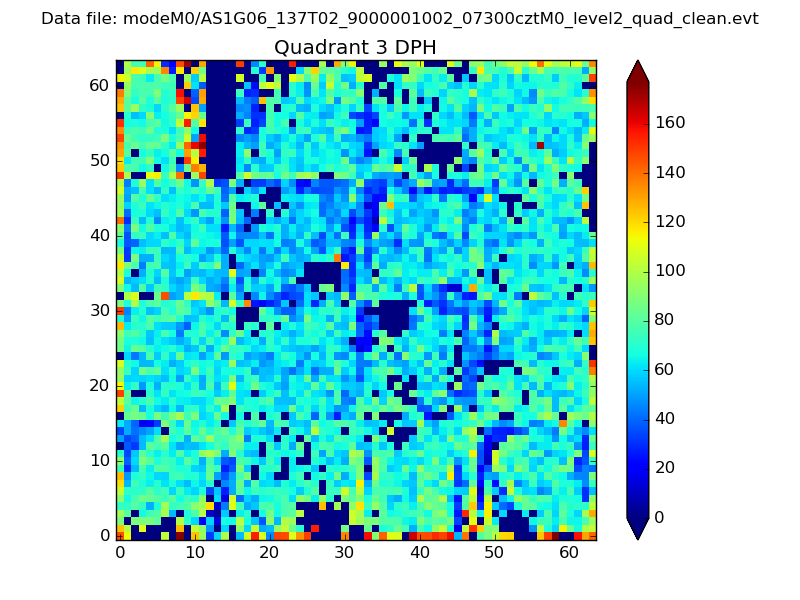 |
 |
Quadrant C |
| Plot type | Count rate plots | Images |
|---|---|---|
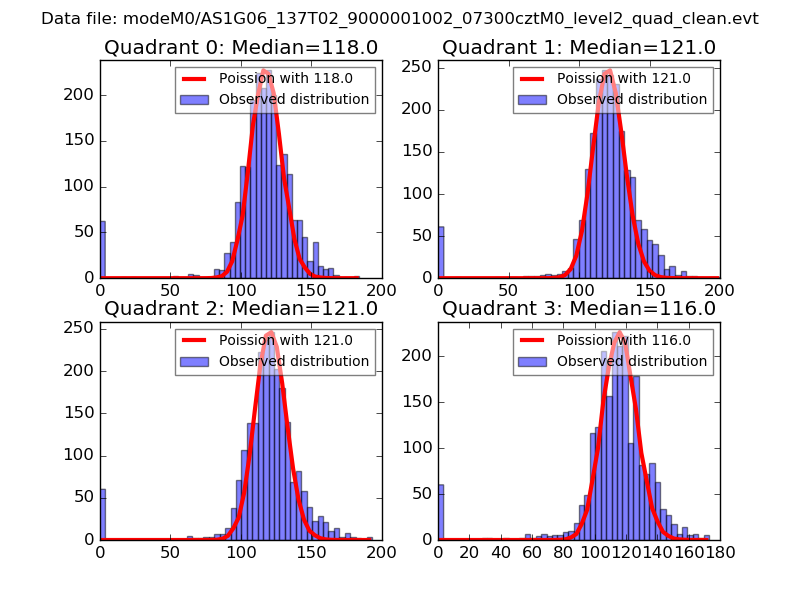
| Comparison with Poisson distribution Blue bars denote a histogram of data divided into 1 sec bins. Red curve is a Poisson curve with rate = median count rate of data. |
 |
 |
| Quadrant-wise count rates Data is divided into 100 sec bins |
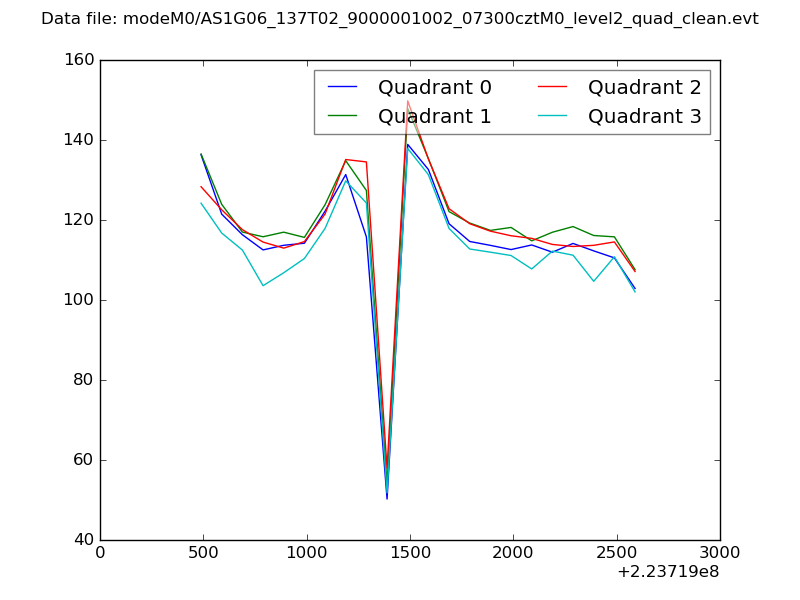 |
|
| Module-wise count rates for Quadrant A Data is divided into 100 sec bins |
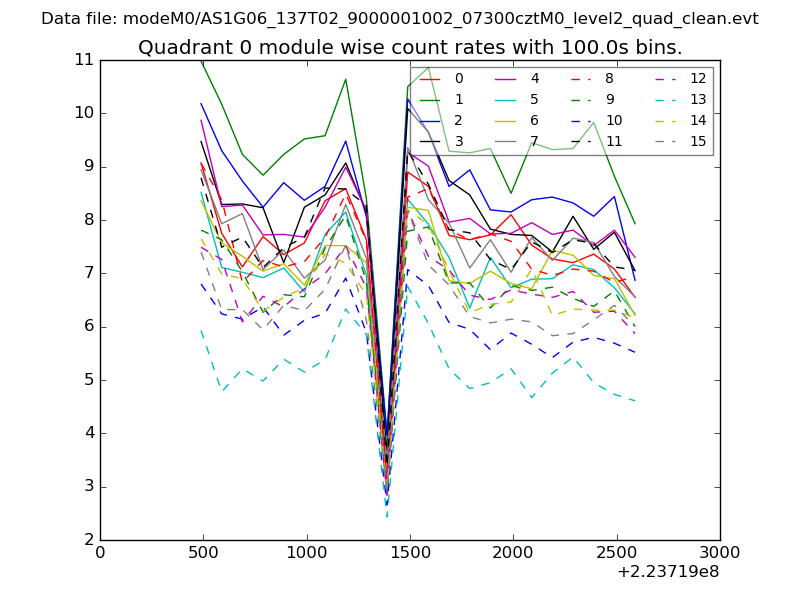 |
 |
| Module-wise count rates for Quadrant B Data is divided into 100 sec bins |
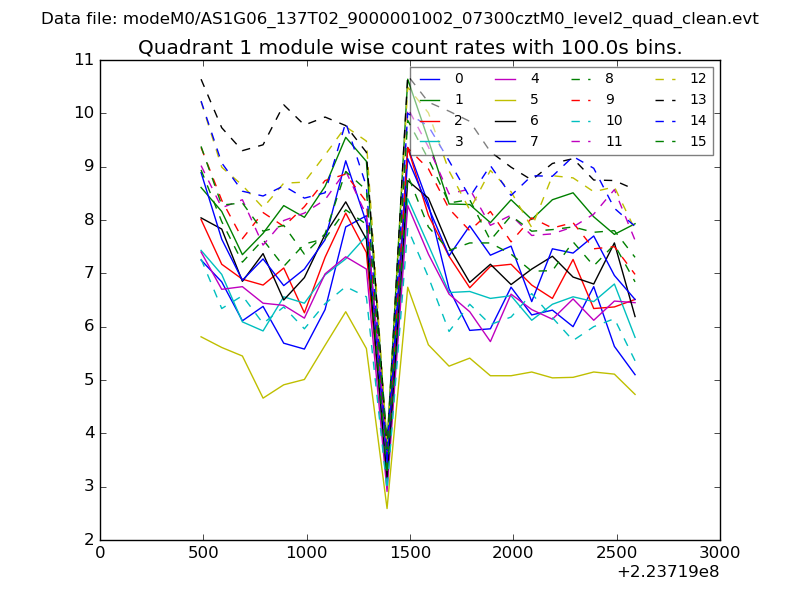 |
 |
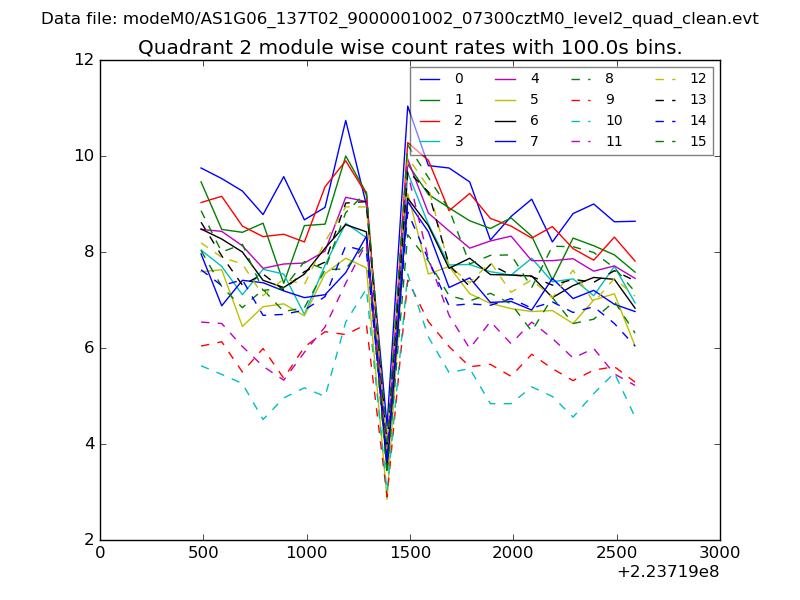
| Module-wise count rates for Quadrant C Data is divided into 100 sec bins |
 |
 |
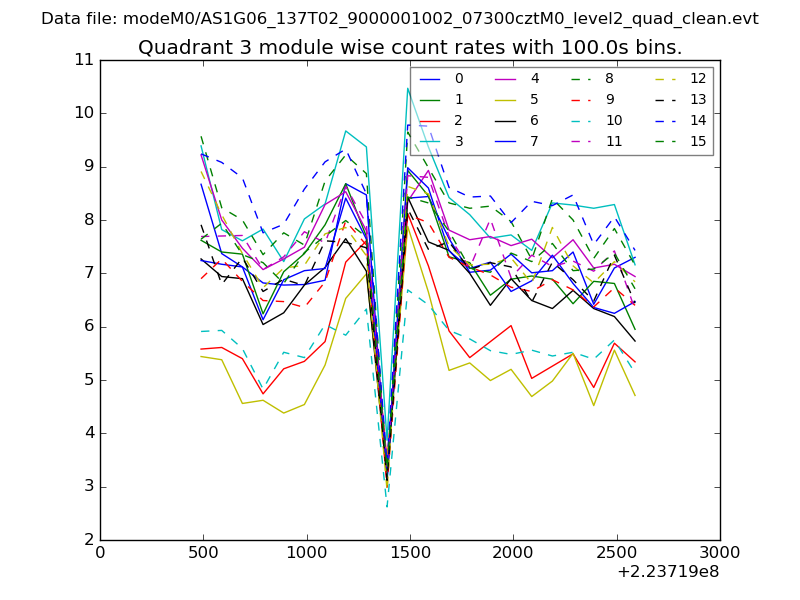
| Module-wise count rates for Quadrant D Data is divided into 100 sec bins |
 |
 |
| Parameter | Plot |
|---|---|
| CZT HV Monitor | 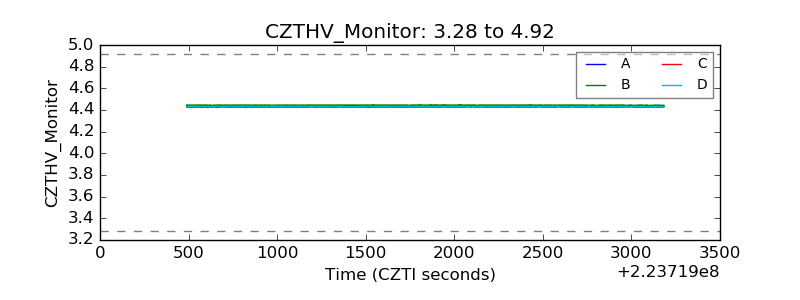 |
| D_VDD |  |
| Temperature 1 | 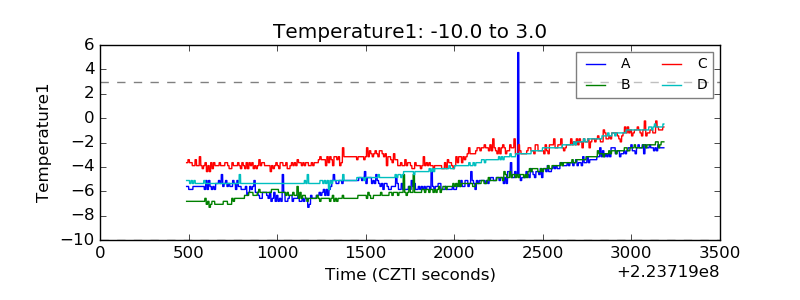 |
| Veto HV Monitor | 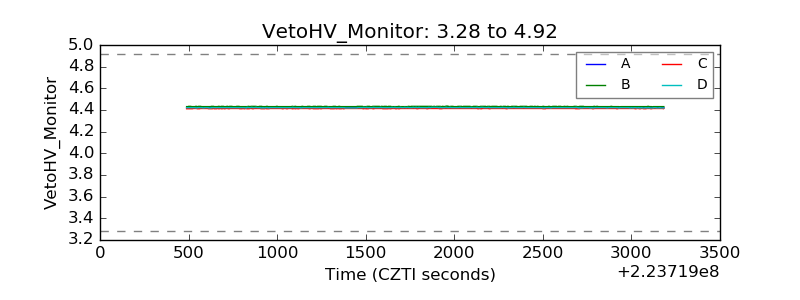 |
| Veto LLD | 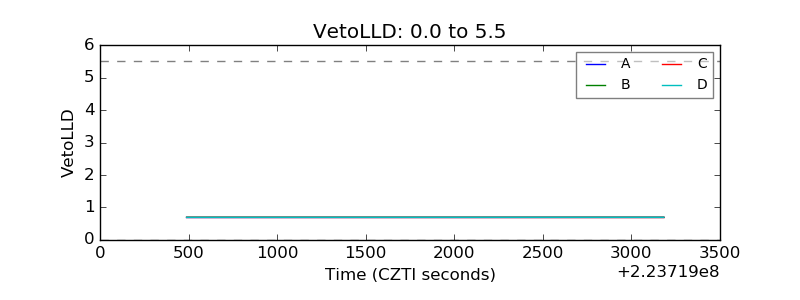 |
| Alpha Counter | 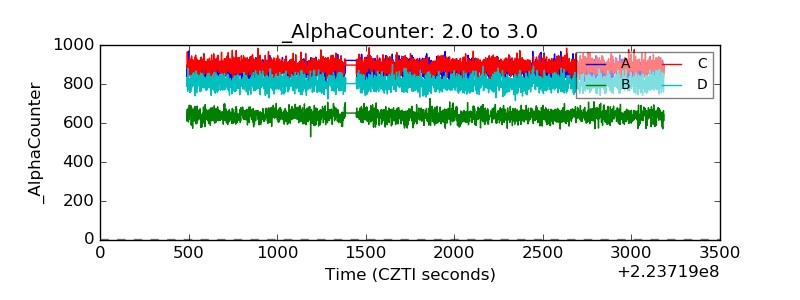 |
| _CPM_Rate | 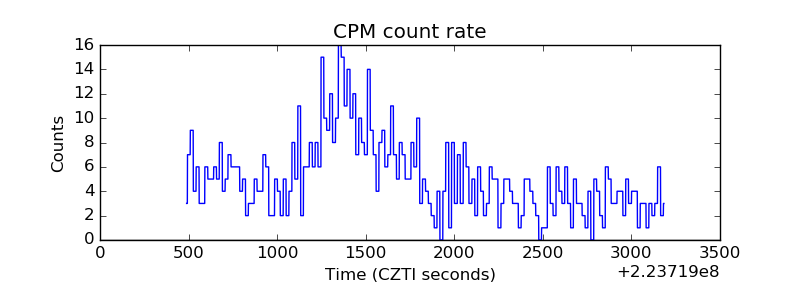 |
| CZT Counter |  |
| +2.5 Volts monitor |  |
| +5 Volts monitor |  |
| _ROLL_ROT | 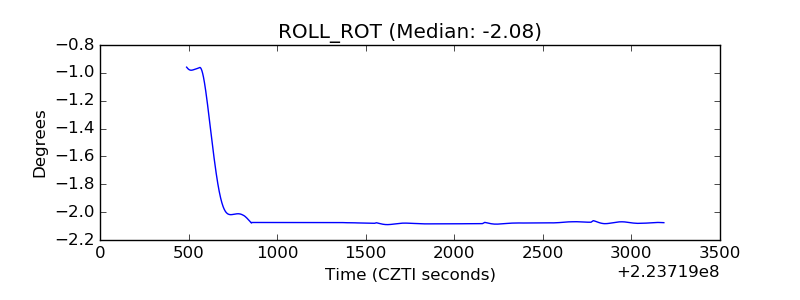 |
| _Roll_DEC | 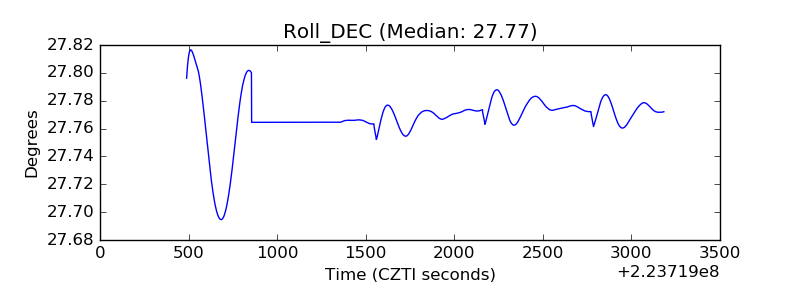 |
| _Roll_RA |  |
| Veto Counter | 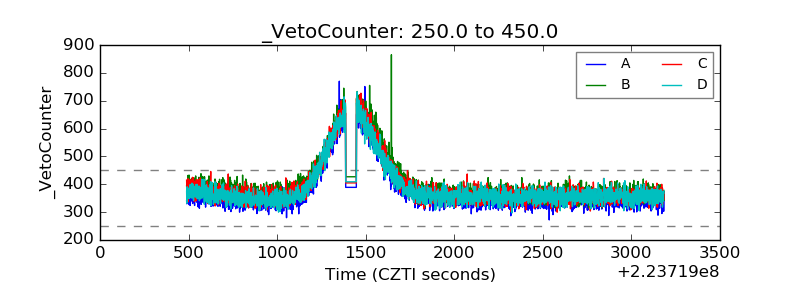 |