| Param | Original file | Final file |
|---|---|---|
| Filename | modeM0/AS1G06_137T02_9000001002_07303cztM0_level2.evt | modeM0/AS1G06_137T02_9000001002_07303cztM0_level2_quad_clean.evt |
| Size (bytes) | 1,267,931,520 | 202,631,040 |
| Size | 1.2 GB | 193.2 MB |
| Events in quadrant A | 8,996,056 | 1,216,150 |
| Events in quadrant B | 8,915,975 | 1,237,543 |
| Events in quadrant C | 8,813,869 | 1,223,697 |
| Events in quadrant D | 10,408,199 | 1,170,104 |
| Mode M0 | |||
|---|---|---|---|
| Quadrant | BADHDUFLAG | Total packets | Discarded packets |
| A | 0 | 39077 | 4 |
| B | 0 | 38998 | 3 |
| C | 0 | 39202 | 3 |
| D | 0 | 44181 | 3 |
| Mode SS | |||
|---|---|---|---|
| Quadrant | BADHDUFLAG | Total packets | Discarded packets |
| A | 0 | 380 | 0 |
| B | 0 | 380 | 0 |
| C | 0 | 380 | 0 |
| D | 0 | 380 | 0 |
| Mode M9 | |||
|---|---|---|---|
| Quadrant | BADHDUFLAG | Total packets | Discarded packets |
| A | 0 | 17 | 0 |
| B | 0 | 17 | 0 |
| C | 0 | 17 | 0 |
| D | 0 | 17 | 0 |
| Quadrant | Total seconds | Saturated seconds | Saturation percentage |
|---|---|---|---|
| A | 18707 | 269 | 1.437964% |
| B | 18707 | 250 | 1.336398% |
| C | 18707 | 282 | 1.507457% |
| D | 18707 | 517 | 2.763671% |
Noise dominated data is calculated using 1-second bins in cleaned event files. If a bin has >2000 counts, and if more than 50% of those come from <1% of pixels, then it is considered to be noise-dominated and hence unusable.
| Quadrant | # 1 sec bins | Bins with >0 counts | Bins with >2000 counts | High rate bins dominated by noise | Noise dominated (total time) | Noise dominated (detector-on time) | Marked lightcurve |
|---|---|---|---|---|---|---|---|
| A | 20402 | 18707 | 8 | 8 | 0.04% | 0.04% | 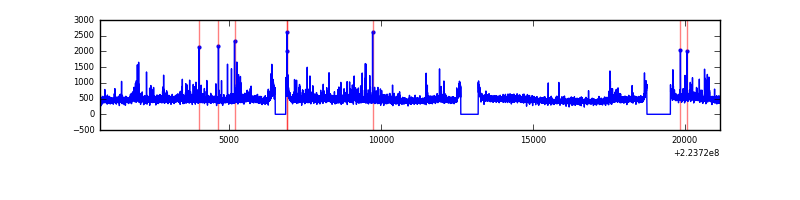 |
| B | 20402 | 18707 | 8 | 8 | 0.04% | 0.04% | 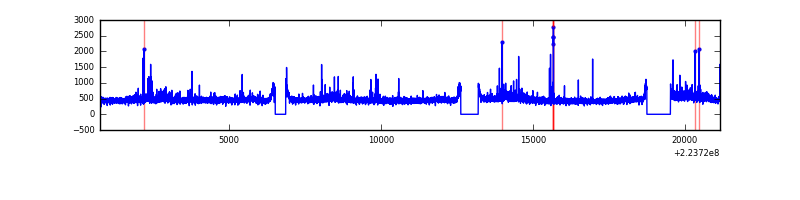 |
| C | 20402 | 18707 | 60 | 60 | 0.29% | 0.32% | 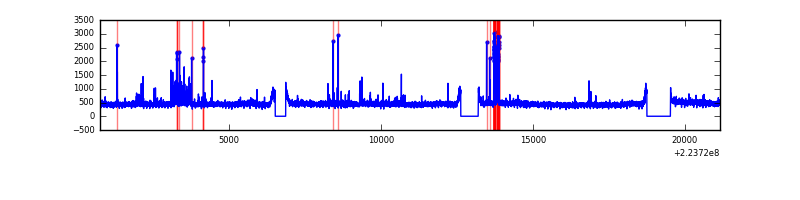 |
| D | 20402 | 18707 | 238 | 238 | 1.17% | 1.27% | 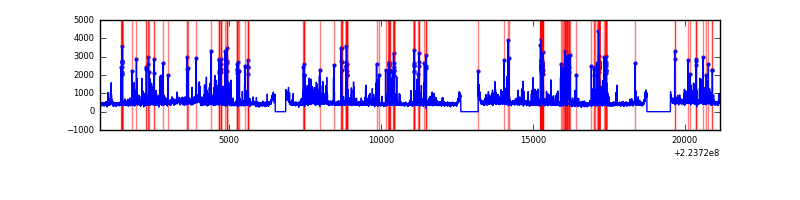 |
Top three noisy pixels from each quadrant. If the there are fewer than three noisy pixels in the level2.evt file, extra rows are filled as -1
| Pixel properties | Quadrant properties | ||||||
|---|---|---|---|---|---|---|---|
| Quadrant | DetID | PixID | Counts | Sigma | Mean | Median | Sigma |
| A | 8 | 15 | 455763 | 1016.94 | 2184 | 2132 | 446.1 |
| A | 3 | 1 | 50602 | 108.66 | 2184 | 2132 | 446.1 |
| A | 14 | 111 | 36526 | 77.1 | 2184 | 2132 | 446.1 |
| B | 0 | 214 | 259949 | 609.16 | 2202 | 2151 | 423.2 |
| B | 4 | 81 | 83150 | 191.39 | 2202 | 2151 | 423.2 |
| B | 12 | 111 | 43439 | 97.56 | 2202 | 2151 | 423.2 |
| C | 1 | 16 | 237667 | 476.22 | 2125 | 2133 | 494.6 |
| C | 7 | 247 | 184631 | 368.99 | 2125 | 2133 | 494.6 |
| C | 9 | 68 | 76941 | 151.25 | 2125 | 2133 | 494.6 |
| D | 2 | 216 | 1322506 | 2528.82 | 2120 | 2052 | 522.2 |
| D | 2 | 14 | 448343 | 854.7 | 2120 | 2052 | 522.2 |
| D | 14 | 34 | 239733 | 455.19 | 2120 | 2052 | 522.2 |
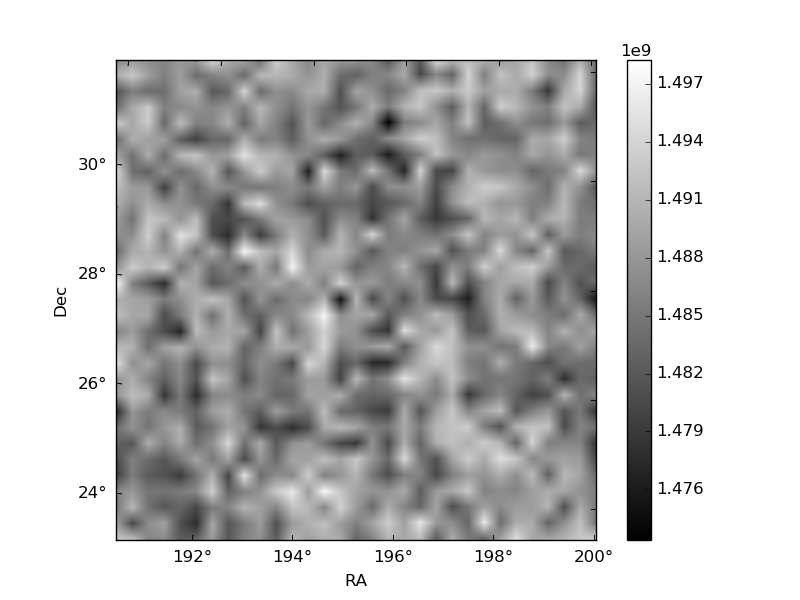
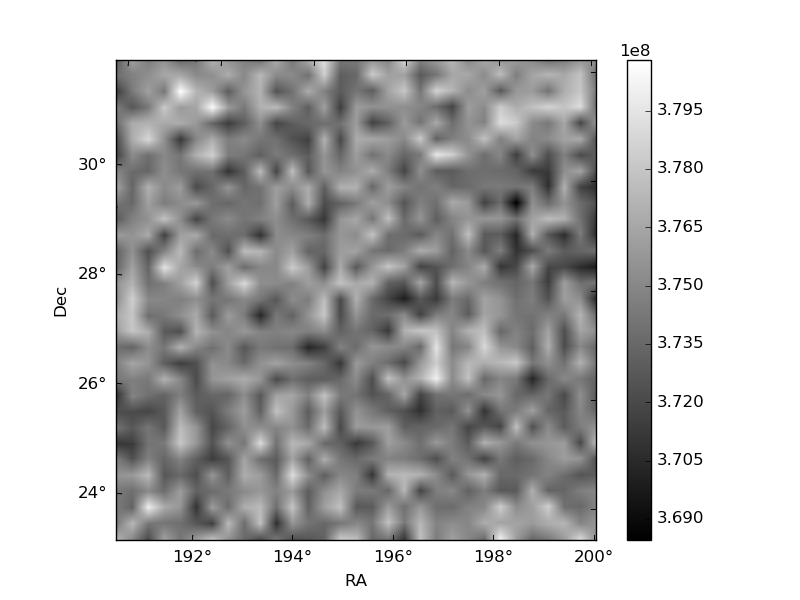
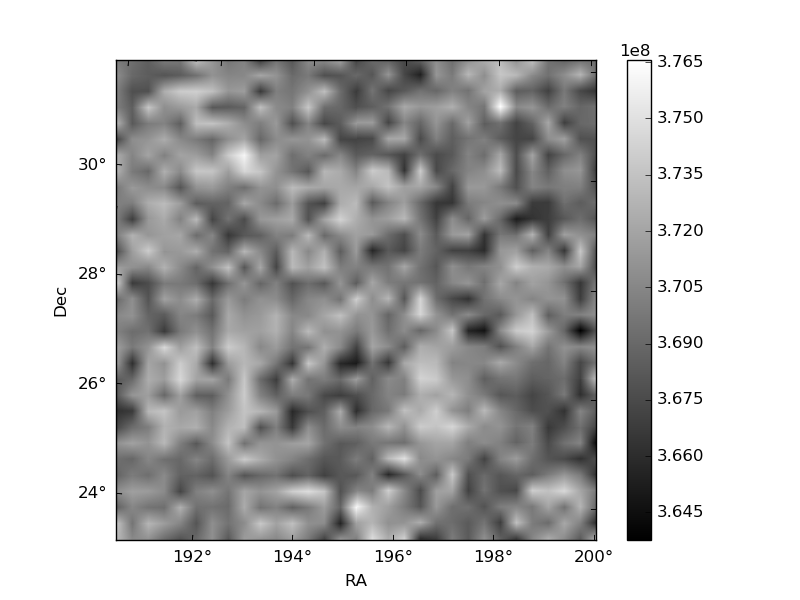
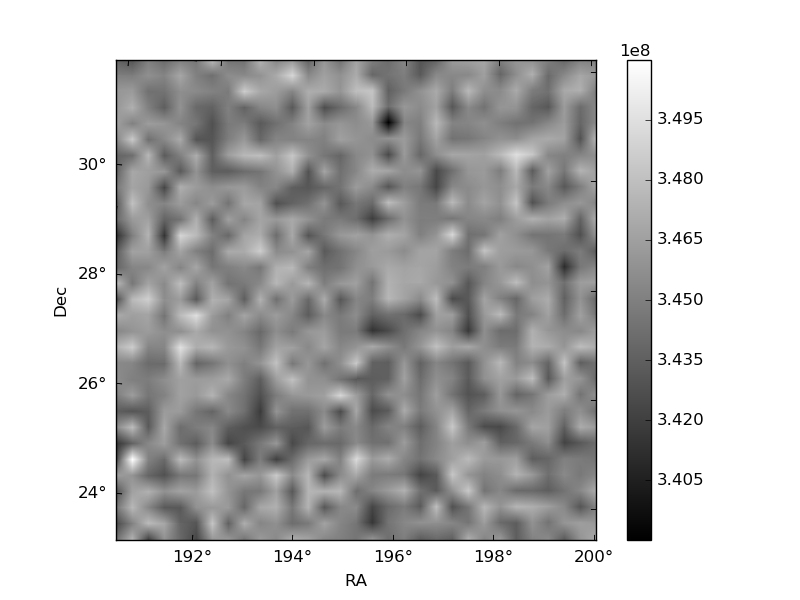
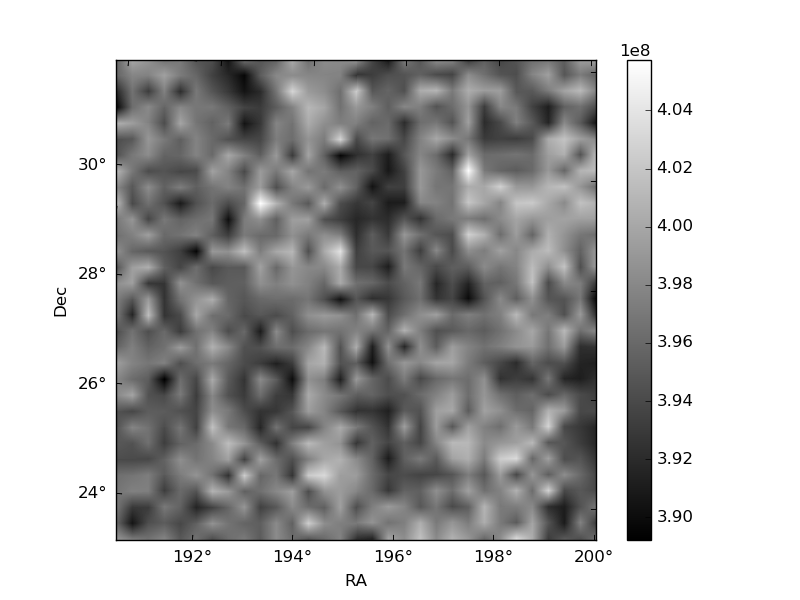
Histogram calculated using DETX and DETY for each event in the final _common_clean file
| Quadrant A | 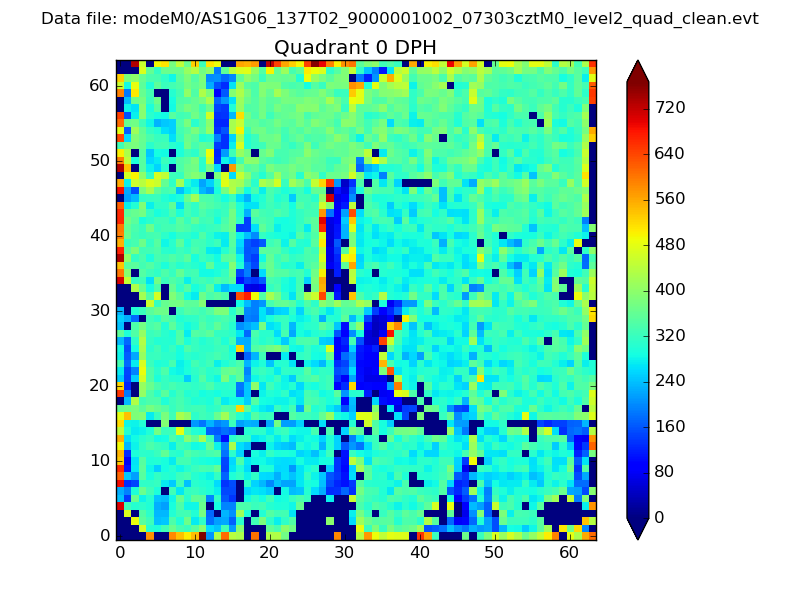 |
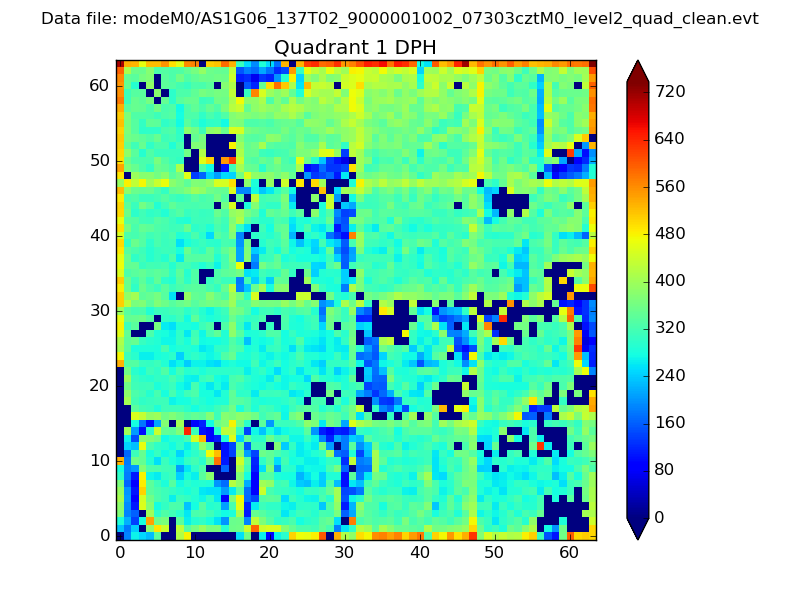 |
Quadrant B |
|---|---|---|---|
| Quadrant D | 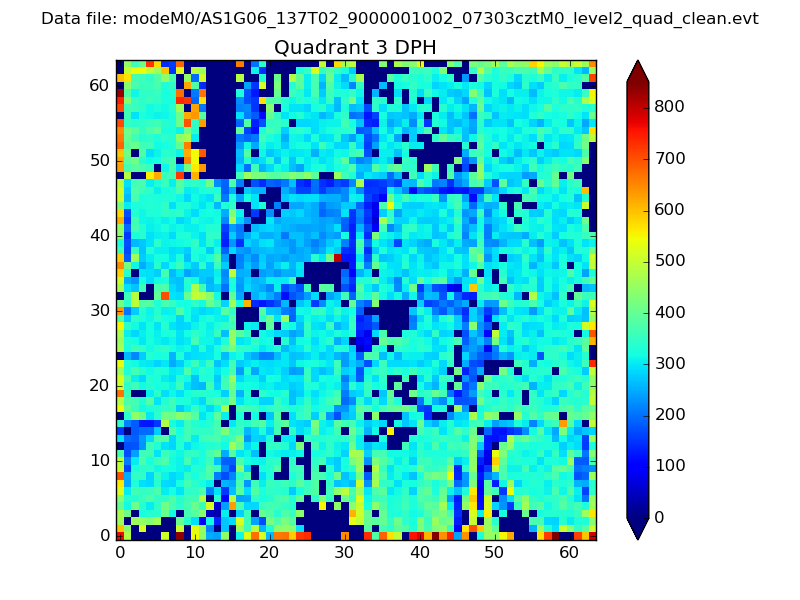 |
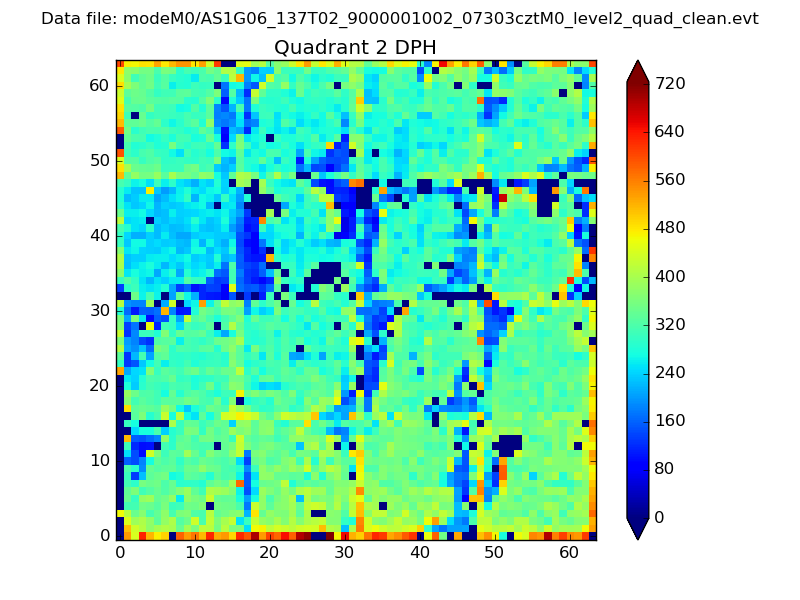 |
Quadrant C |
| Plot type | Count rate plots | Images |
|---|---|---|
| Comparison with Poisson distribution Blue bars denote a histogram of data divided into 1 sec bins. Red curve is a Poisson curve with rate = median count rate of data. |
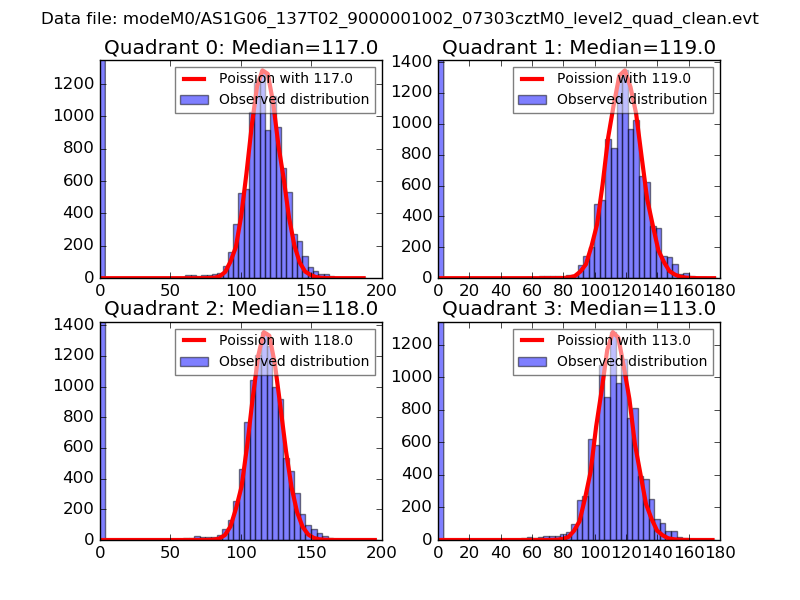 |
 |
| Quadrant-wise count rates Data is divided into 100 sec bins |
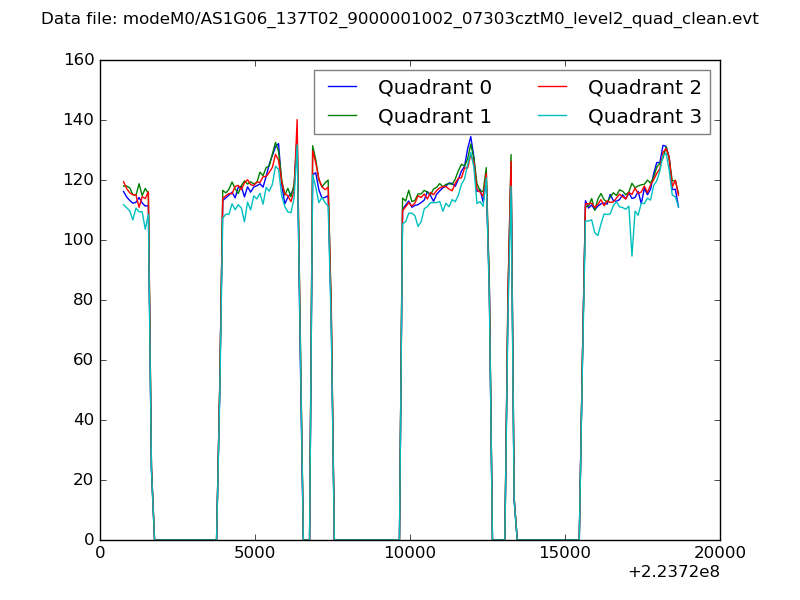 |
|
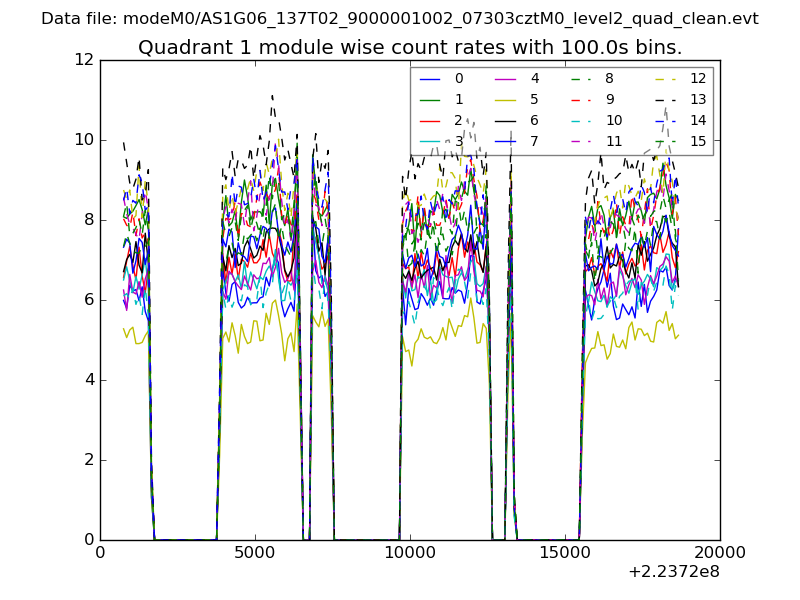
| Module-wise count rates for Quadrant A Data is divided into 100 sec bins |
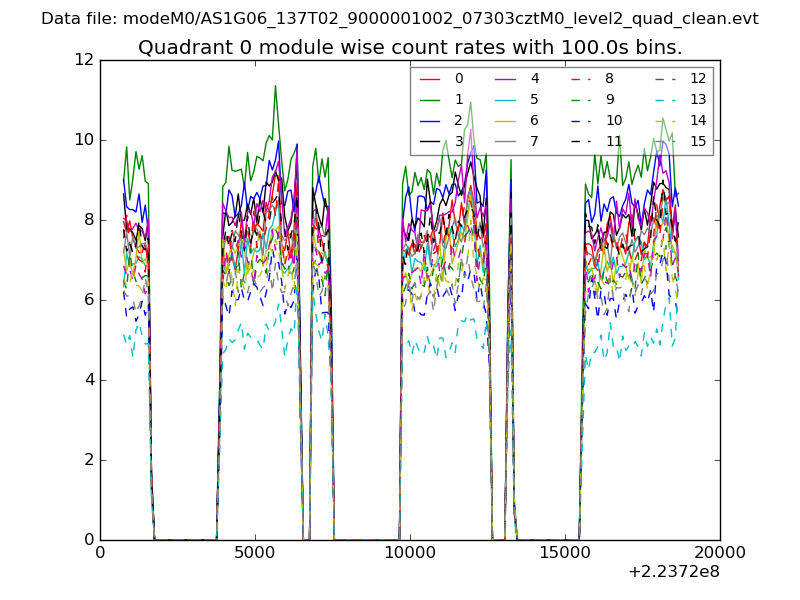 |
 |
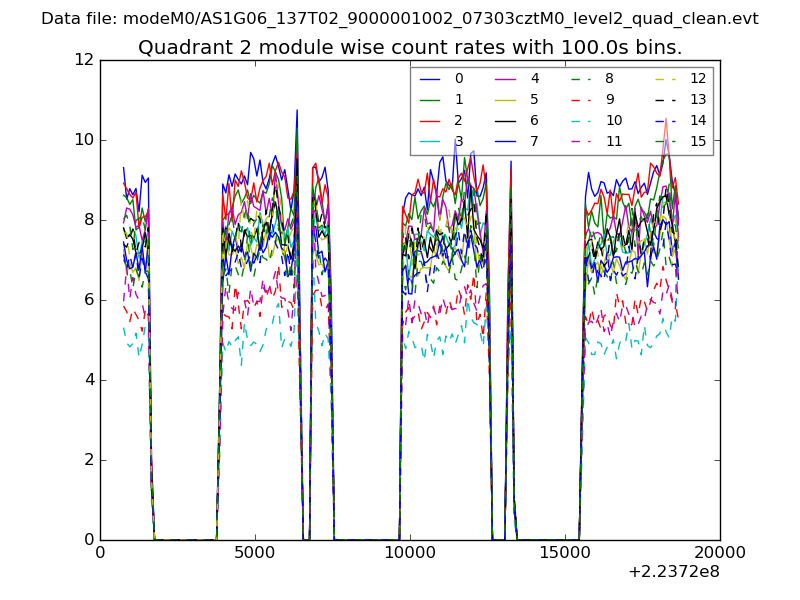
| Module-wise count rates for Quadrant B Data is divided into 100 sec bins |
 |
 |
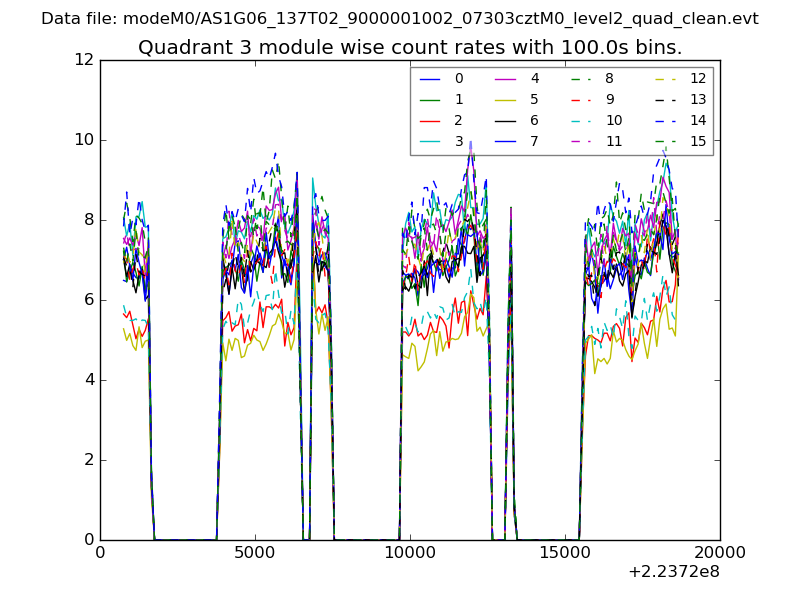
| Module-wise count rates for Quadrant C Data is divided into 100 sec bins |
 |
 |
| Module-wise count rates for Quadrant D Data is divided into 100 sec bins |
 |
 |
| Parameter | Plot |
|---|---|
| CZT HV Monitor | 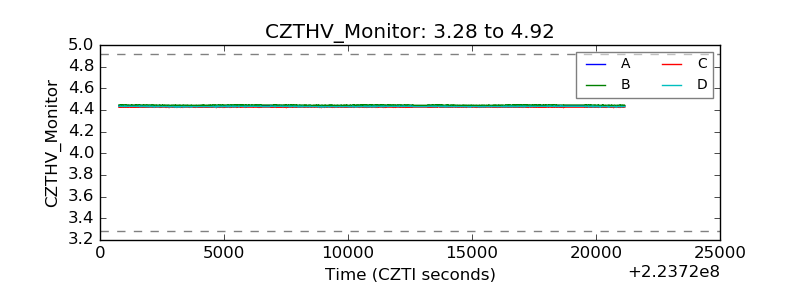 |
| D_VDD | 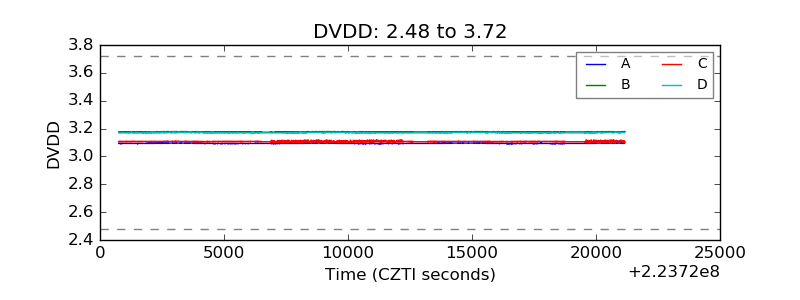 |
| Temperature 1 |  |
| Veto HV Monitor |  |
| Veto LLD | 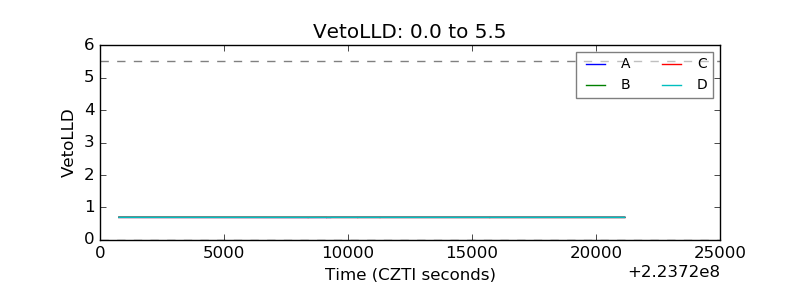 |
| Alpha Counter | 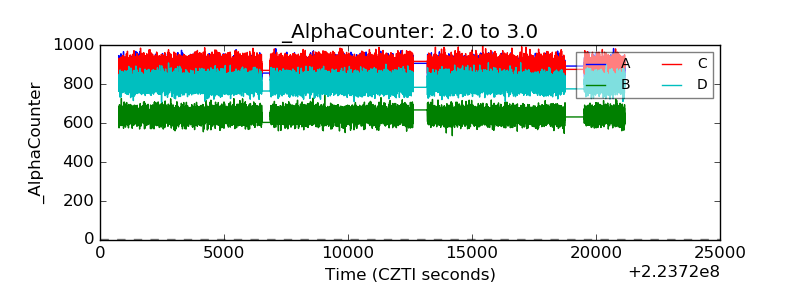 |
| _CPM_Rate | 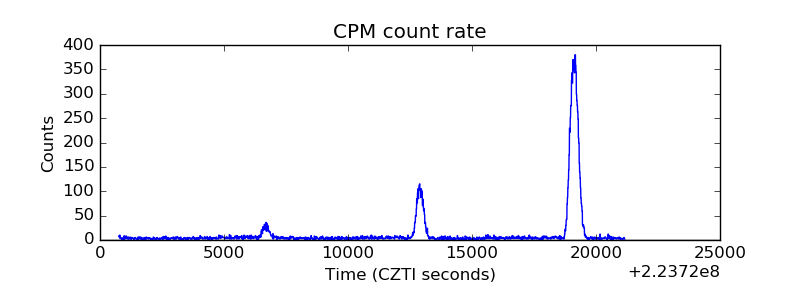 |
| CZT Counter | 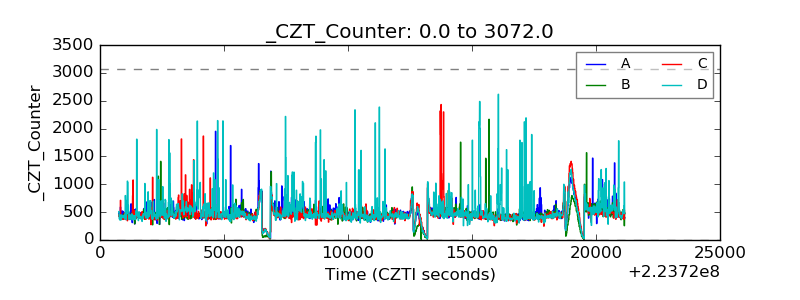 |
| +2.5 Volts monitor |  |
| +5 Volts monitor |  |
| _ROLL_ROT | 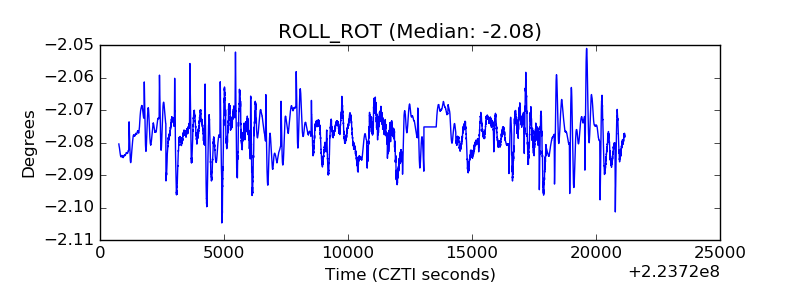 |
| _Roll_DEC | 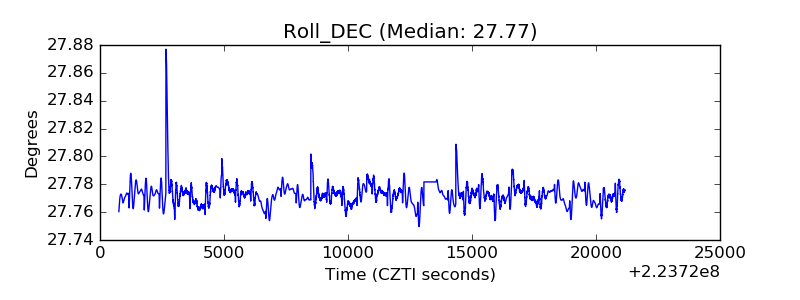 |
| _Roll_RA | 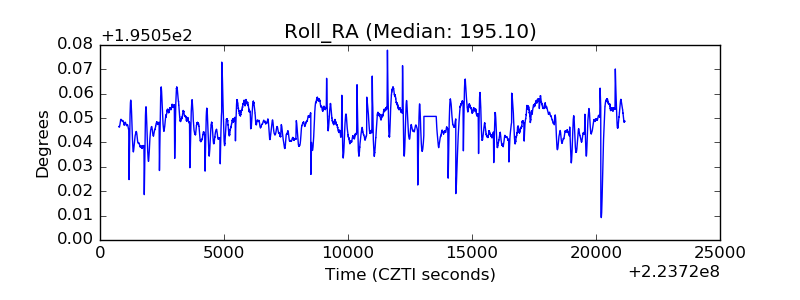 |
| Veto Counter | 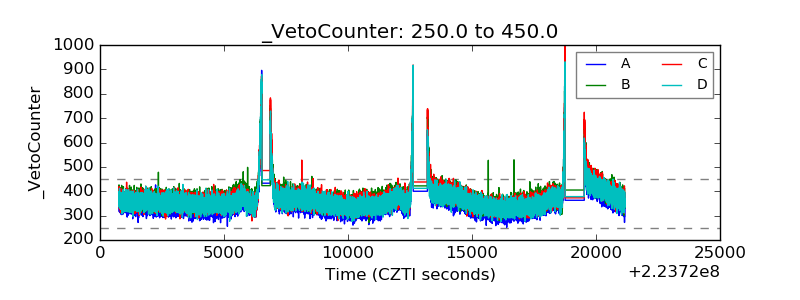 |