| Param | Original file | Final file |
|---|---|---|
| Filename | modeM0/AS1G06_137T02_9000001002_07304cztM0_level2.evt | modeM0/AS1G06_137T02_9000001002_07304cztM0_level2_quad_clean.evt |
| Size (bytes) | 469,690,560 | 68,310,720 |
| Size | 447.9 MB | 65.1 MB |
| Events in quadrant A | 3,401,029 | 399,572 |
| Events in quadrant B | 3,316,065 | 404,540 |
| Events in quadrant C | 3,138,618 | 403,017 |
| Events in quadrant D | 3,910,607 | 391,058 |
| Mode M0 | |||
|---|---|---|---|
| Quadrant | BADHDUFLAG | Total packets | Discarded packets |
| A | 0 | 14612 | 3 |
| B | 0 | 14458 | 2 |
| C | 0 | 13850 | 2 |
| D | 0 | 16492 | 2 |
| Mode SS | |||
|---|---|---|---|
| Quadrant | BADHDUFLAG | Total packets | Discarded packets |
| A | 0 | 136 | 0 |
| B | 0 | 136 | 0 |
| C | 0 | 136 | 0 |
| D | 0 | 136 | 0 |
| Mode M9 | |||
|---|---|---|---|
| Quadrant | BADHDUFLAG | Total packets | Discarded packets |
| A | 0 | 16 | 0 |
| B | 0 | 16 | 0 |
| C | 0 | 16 | 0 |
| D | 0 | 17 | 0 |
| Quadrant | Total seconds | Saturated seconds | Saturation percentage |
|---|---|---|---|
| A | 6748 | 74 | 1.096621% |
| B | 6748 | 66 | 0.978068% |
| C | 6748 | 52 | 0.770599% |
| D | 6748 | 145 | 2.148785% |
Noise dominated data is calculated using 1-second bins in cleaned event files. If a bin has >2000 counts, and if more than 50% of those come from <1% of pixels, then it is considered to be noise-dominated and hence unusable.
| Quadrant | # 1 sec bins | Bins with >0 counts | Bins with >2000 counts | High rate bins dominated by noise | Noise dominated (total time) | Noise dominated (detector-on time) | Marked lightcurve |
|---|---|---|---|---|---|---|---|
| A | 7708 | 6748 | 7 | 7 | 0.09% | 0.10% | 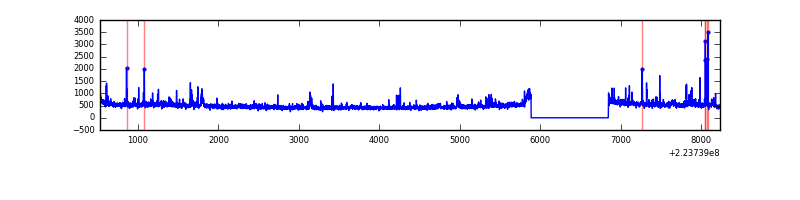 |
| B | 7708 | 6748 | 6 | 6 | 0.08% | 0.09% | 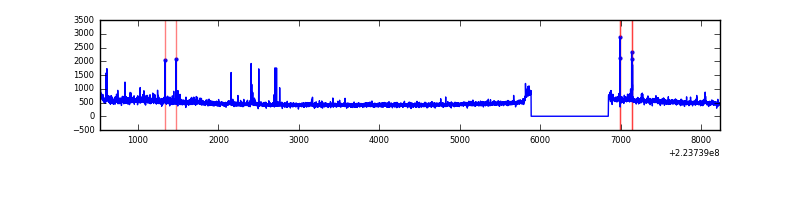 |
| C | 7708 | 6748 | 2 | 2 | 0.03% | 0.03% | 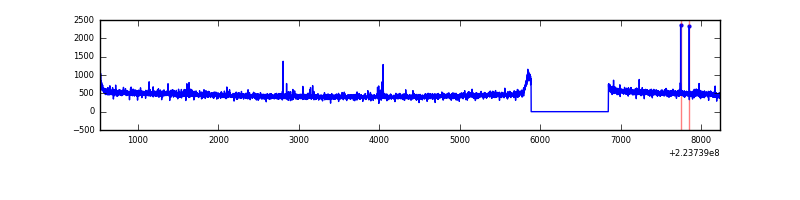 |
| D | 7708 | 6748 | 50 | 50 | 0.65% | 0.74% | 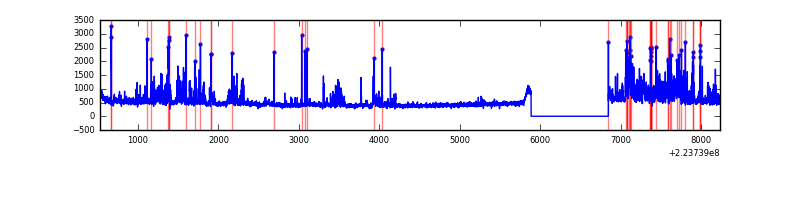 |
Top three noisy pixels from each quadrant. If the there are fewer than three noisy pixels in the level2.evt file, extra rows are filled as -1
| Pixel properties | Quadrant properties | ||||||
|---|---|---|---|---|---|---|---|
| Quadrant | DetID | PixID | Counts | Sigma | Mean | Median | Sigma |
| A | 15 | 234 | 106480 | 641.66 | 810 | 793 | 164.7 |
| A | 8 | 15 | 93710 | 564.13 | 810 | 793 | 164.7 |
| A | 14 | 111 | 39584 | 235.51 | 810 | 793 | 164.7 |
| B | 0 | 214 | 103591 | 660.17 | 814 | 796 | 155.7 |
| B | 4 | 81 | 26726 | 166.53 | 814 | 796 | 155.7 |
| B | 12 | 111 | 15469 | 94.23 | 814 | 796 | 155.7 |
| C | 1 | 16 | 19496 | 101.09 | 791 | 795 | 185.0 |
| C | 8 | 128 | 13552 | 68.96 | 791 | 795 | 185.0 |
| C | 9 | 68 | 10940 | 54.84 | 791 | 795 | 185.0 |
| D | 2 | 216 | 563293 | 2883.87 | 789 | 765 | 195.1 |
| D | 2 | 33 | 105258 | 535.7 | 789 | 765 | 195.1 |
| D | 1 | 20 | 81862 | 415.75 | 789 | 765 | 195.1 |
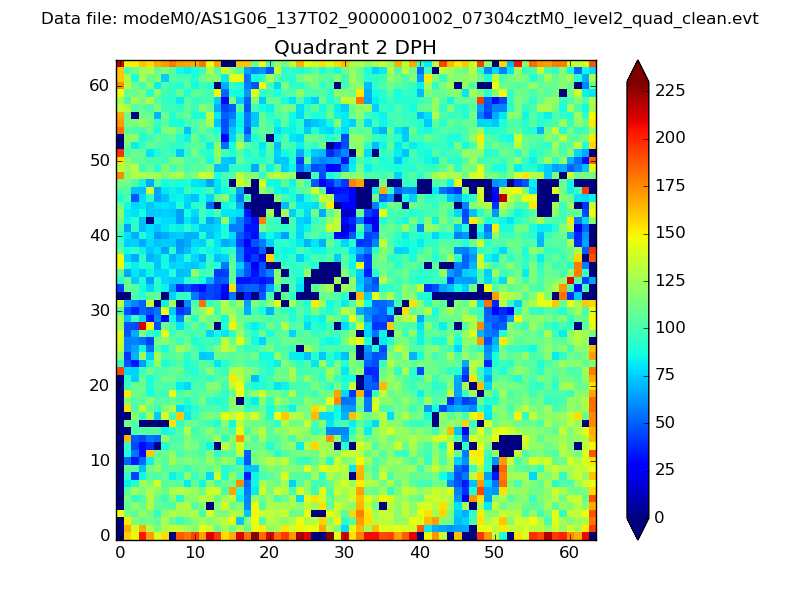
Histogram calculated using DETX and DETY for each event in the final _common_clean file
| Quadrant A | 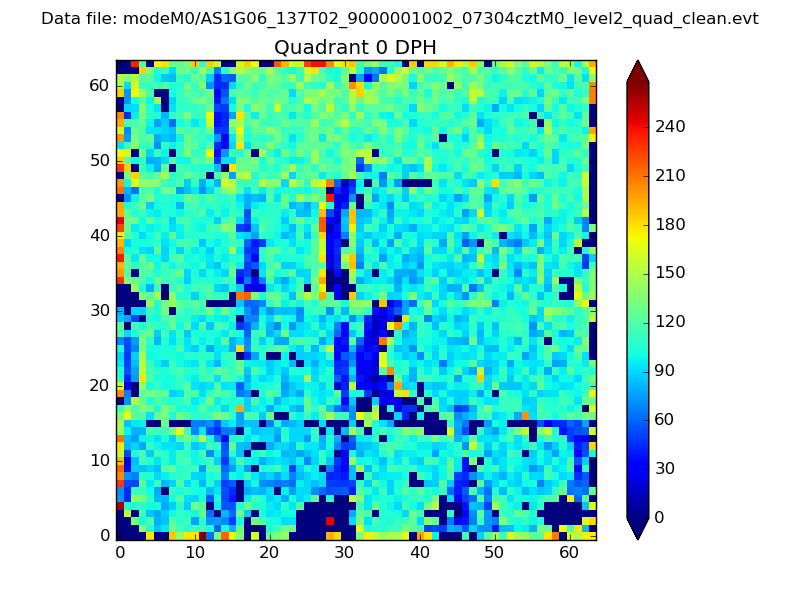 |
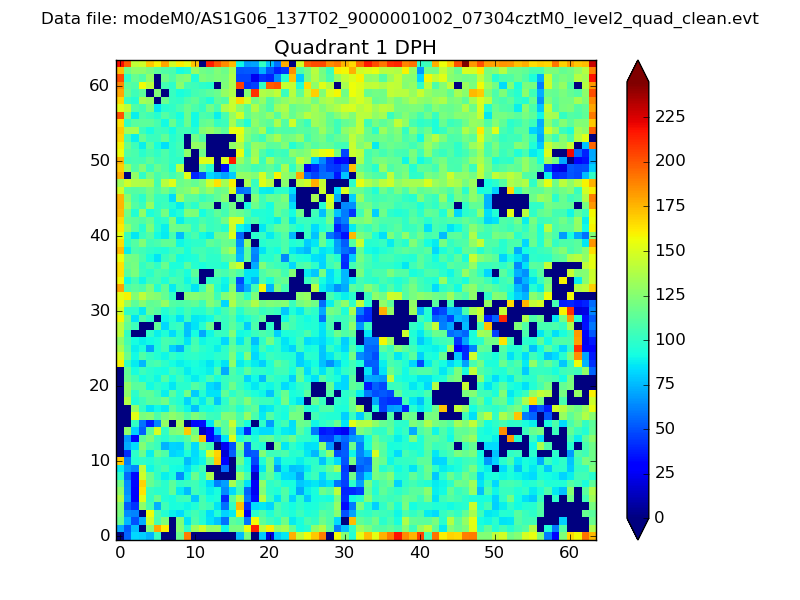 |
Quadrant B |
|---|---|---|---|
| Quadrant D | 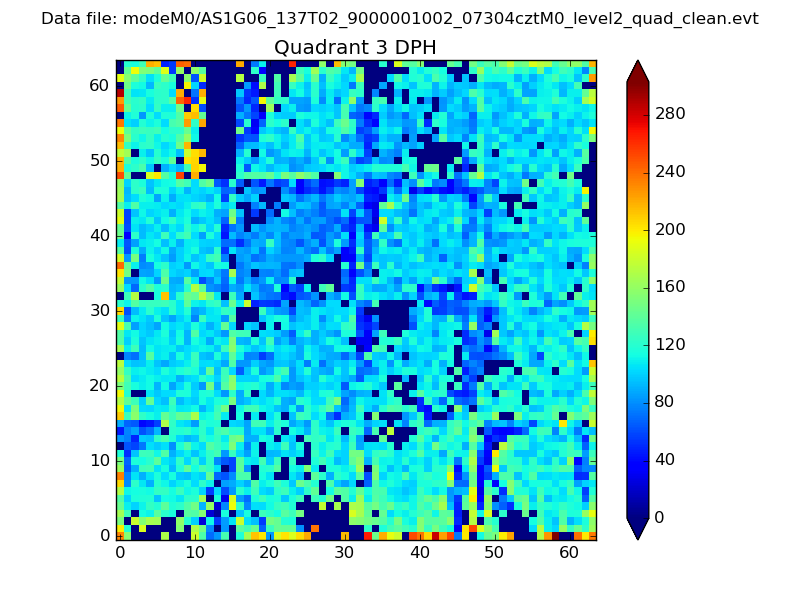 |
 |
Quadrant C |
| Plot type | Count rate plots | Images |
|---|---|---|
| Comparison with Poisson distribution Blue bars denote a histogram of data divided into 1 sec bins. Red curve is a Poisson curve with rate = median count rate of data. |
 |
 |
| Quadrant-wise count rates Data is divided into 100 sec bins |
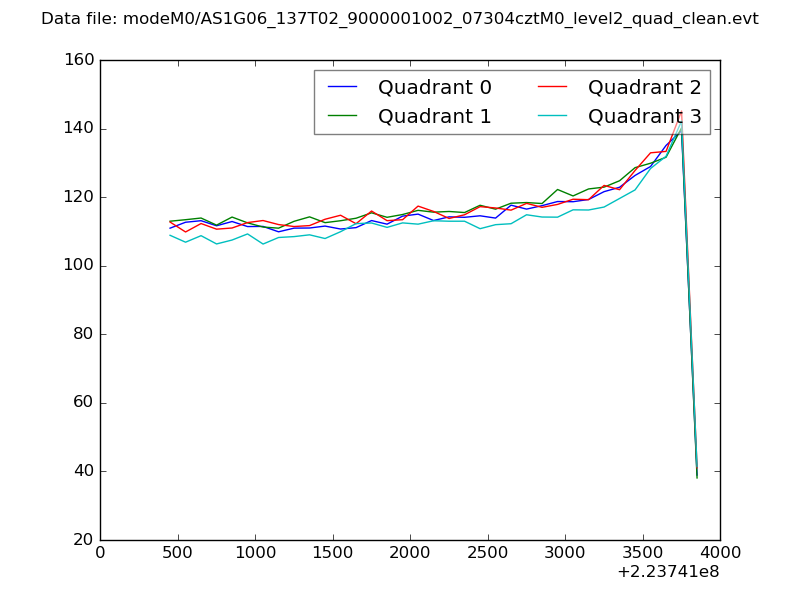 |
|
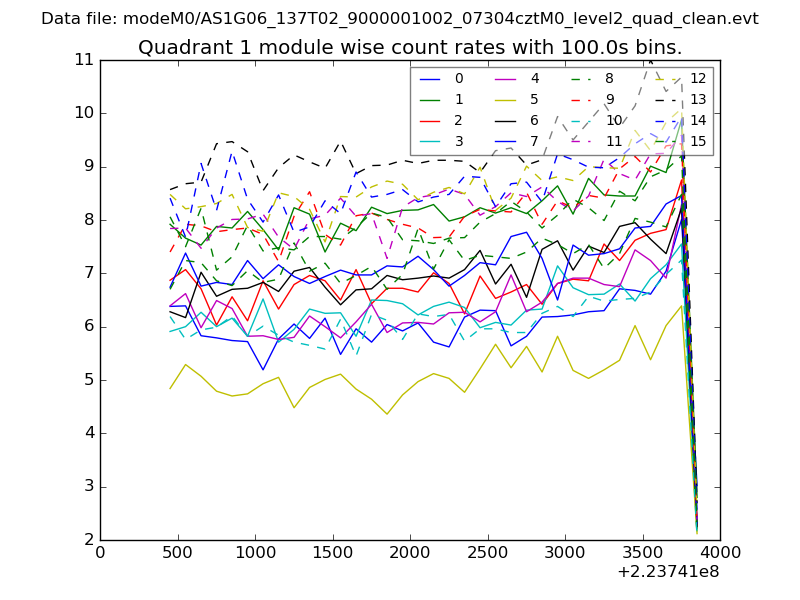
| Module-wise count rates for Quadrant A Data is divided into 100 sec bins |
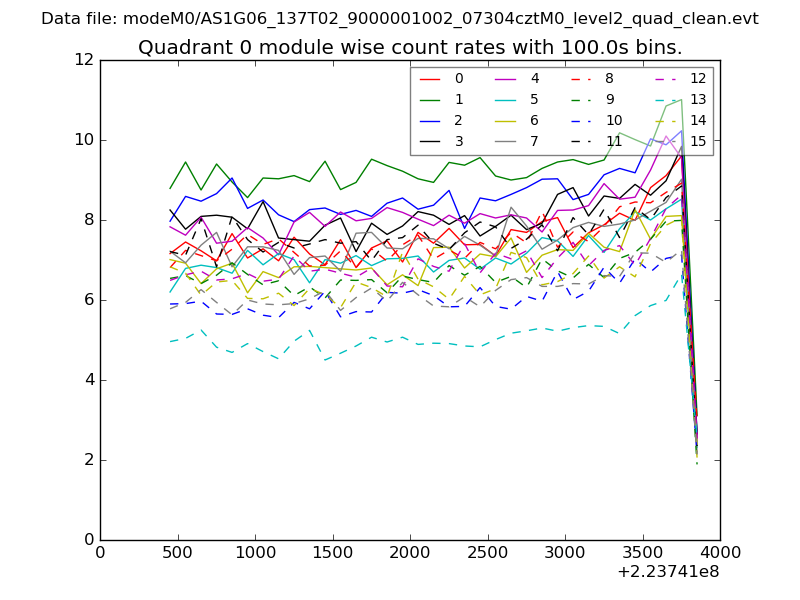 |
 |
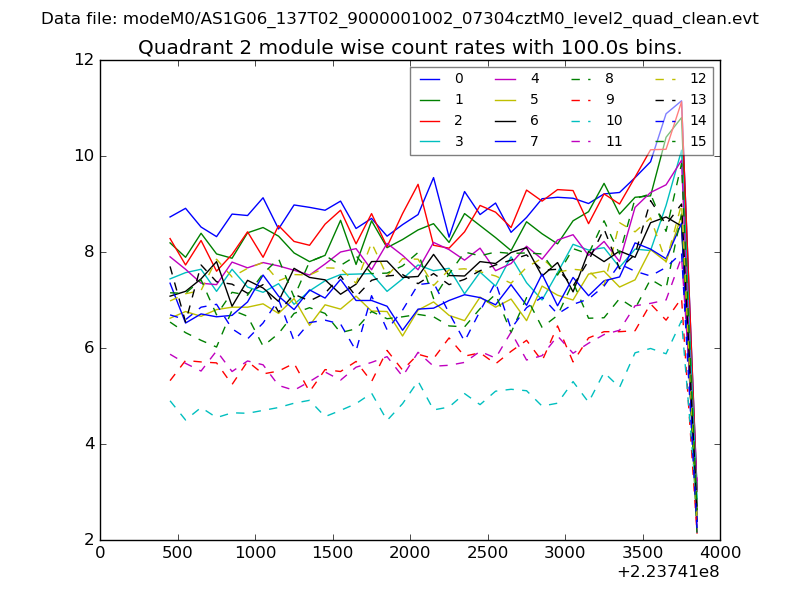
| Module-wise count rates for Quadrant B Data is divided into 100 sec bins |
 |
 |
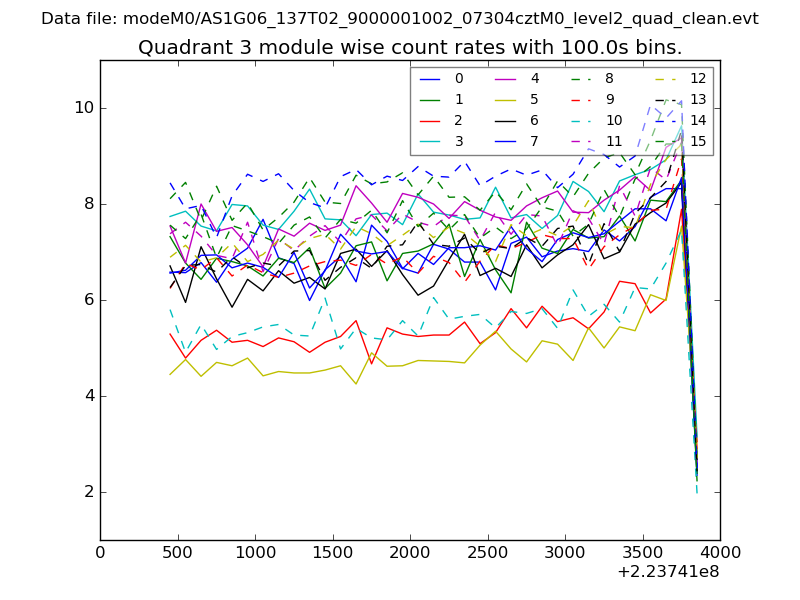
| Module-wise count rates for Quadrant C Data is divided into 100 sec bins |
 |
 |
| Module-wise count rates for Quadrant D Data is divided into 100 sec bins |
 |
 |
| Parameter | Plot |
|---|---|
| CZT HV Monitor | 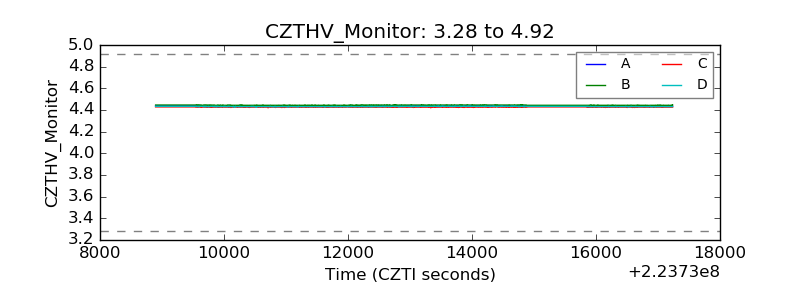 |
| D_VDD | 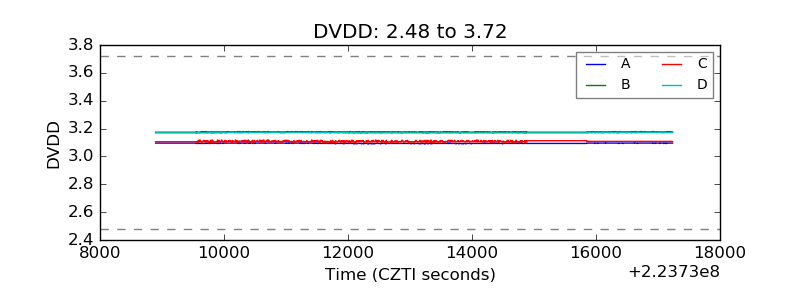 |
| Temperature 1 | 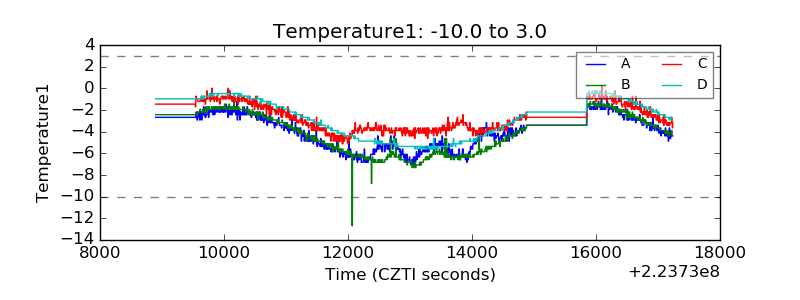 |
| Veto HV Monitor | 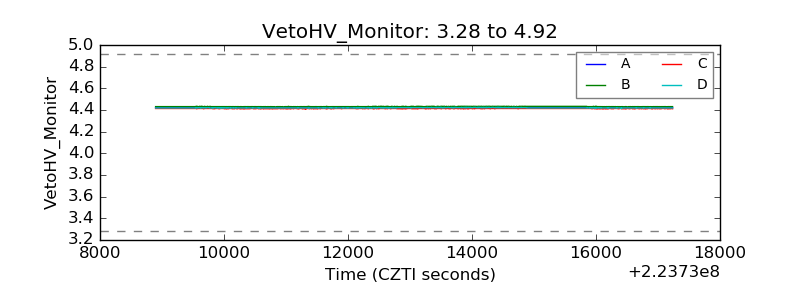 |
| Veto LLD | 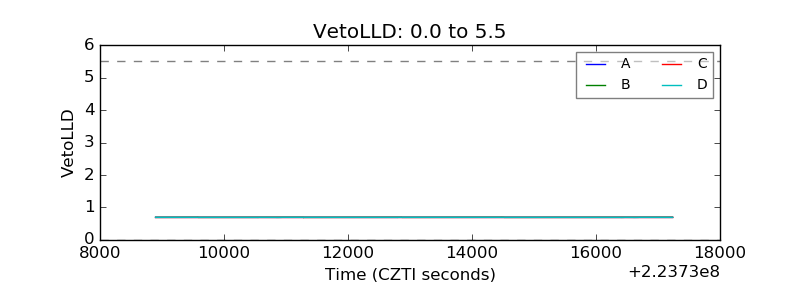 |
| Alpha Counter | 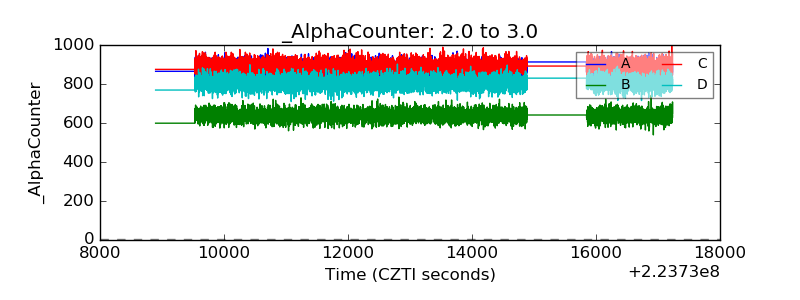 |
| _CPM_Rate | 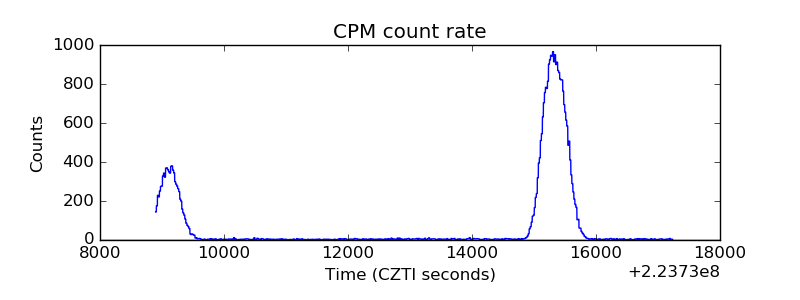 |
| CZT Counter | 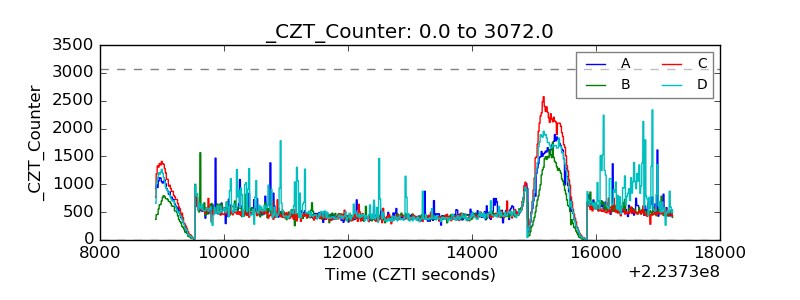 |
| +2.5 Volts monitor |  |
| +5 Volts monitor |  |
| _ROLL_ROT | 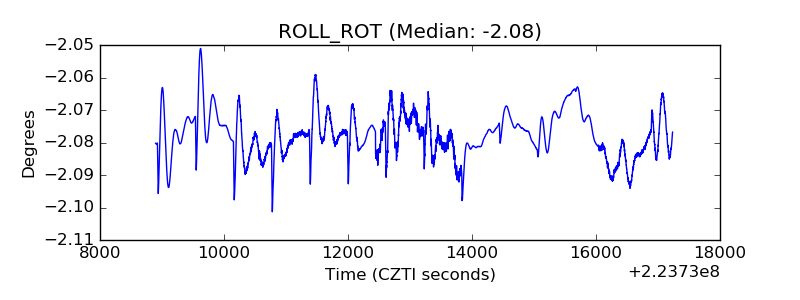 |
| _Roll_DEC |  |
| _Roll_RA | 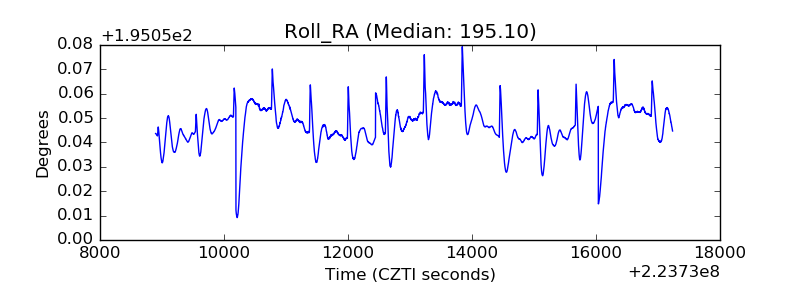 |
| Veto Counter | 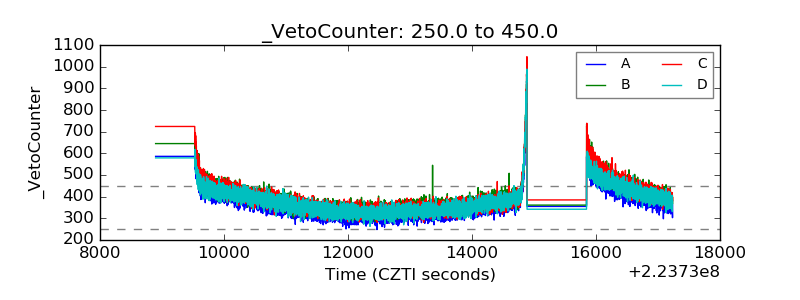 |