| Param | Original file | Final file |
|---|---|---|
| Filename | modeM0/AS1G06_137T02_9000001002_07306cztM0_level2.evt | modeM0/AS1G06_137T02_9000001002_07306cztM0_level2_quad_clean.evt |
| Size (bytes) | 548,853,120 | 72,748,800 |
| Size | 523.4 MB | 69.4 MB |
| Events in quadrant A | 3,443,346 | 460,978 |
| Events in quadrant B | 3,137,950 | 477,115 |
| Events in quadrant C | 3,079,108 | 473,282 |
| Events in quadrant D | 6,526,506 | 343,501 |
| Mode M0 | |||
|---|---|---|---|
| Quadrant | BADHDUFLAG | Total packets | Discarded packets |
| A | 0 | 14604 | 2 |
| B | 0 | 13674 | 1 |
| C | 0 | 13457 | 1 |
| D | 0 | 23807 | 1 |
| Mode SS | |||
|---|---|---|---|
| Quadrant | BADHDUFLAG | Total packets | Discarded packets |
| A | 0 | 132 | 0 |
| B | 0 | 132 | 0 |
| C | 0 | 132 | 0 |
| D | 0 | 132 | 0 |
| Mode M9 | |||
|---|---|---|---|
| Quadrant | BADHDUFLAG | Total packets | Discarded packets |
| A | 0 | 11 | 0 |
| B | 0 | 11 | 0 |
| C | 0 | 11 | 0 |
| D | 0 | 11 | 0 |
| Quadrant | Total seconds | Saturated seconds | Saturation percentage |
|---|---|---|---|
| A | 6406 | 139 | 2.169841% |
| B | 6406 | 41 | 0.640025% |
| C | 6406 | 46 | 0.718077% |
| D | 6406 | 1245 | 19.434905% |
Noise dominated data is calculated using 1-second bins in cleaned event files. If a bin has >2000 counts, and if more than 50% of those come from <1% of pixels, then it is considered to be noise-dominated and hence unusable.
| Quadrant | # 1 sec bins | Bins with >0 counts | Bins with >2000 counts | High rate bins dominated by noise | Noise dominated (total time) | Noise dominated (detector-on time) | Marked lightcurve |
|---|---|---|---|---|---|---|---|
| A | 7521 | 6406 | 67 | 67 | 0.89% | 1.05% | 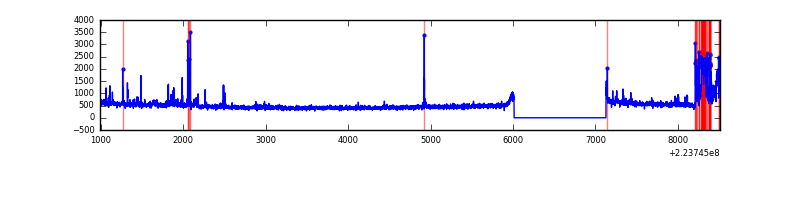 |
| B | 7521 | 6406 | 4 | 4 | 0.05% | 0.06% | 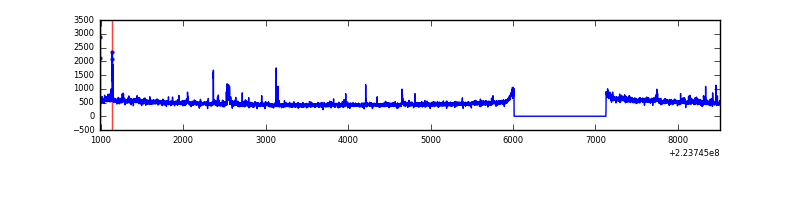 |
| C | 7521 | 6406 | 15 | 15 | 0.20% | 0.23% | 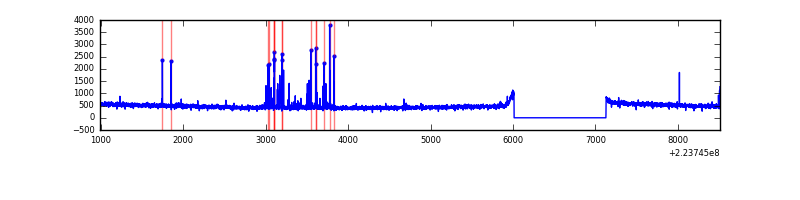 |
| D | 7521 | 6406 | 1166 | 1166 | 15.50% | 18.20% | 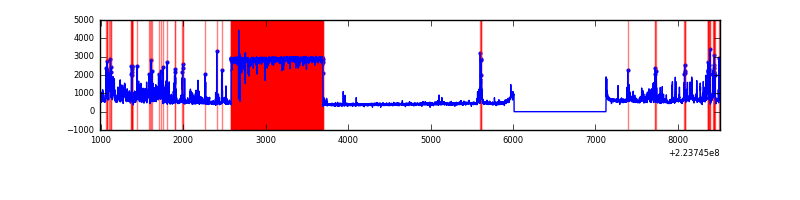 |
Top three noisy pixels from each quadrant. If the there are fewer than three noisy pixels in the level2.evt file, extra rows are filled as -1
| Pixel properties | Quadrant properties | ||||||
|---|---|---|---|---|---|---|---|
| Quadrant | DetID | PixID | Counts | Sigma | Mean | Median | Sigma |
| A | 15 | 234 | 394681 | 2532.66 | 764 | 747 | 155.5 |
| A | 8 | 15 | 68314 | 434.4 | 764 | 747 | 155.5 |
| A | 13 | 248 | 12031 | 72.55 | 764 | 747 | 155.5 |
| B | 0 | 214 | 72445 | 479.65 | 780 | 763 | 149.4 |
| B | 12 | 111 | 14406 | 91.29 | 780 | 763 | 149.4 |
| B | 0 | 229 | 12159 | 76.25 | 780 | 763 | 149.4 |
| C | 9 | 68 | 101340 | 568.07 | 759 | 764 | 177.0 |
| C | 1 | 16 | 10796 | 56.66 | 759 | 764 | 177.0 |
| C | 10 | 22 | 7581 | 38.5 | 759 | 764 | 177.0 |
| D | 1 | 239 | 2998440 | 18287.21 | 663 | 644 | 163.9 |
| D | 2 | 216 | 520752 | 3172.77 | 663 | 644 | 163.9 |
| D | 2 | 33 | 221783 | 1349.0 | 663 | 644 | 163.9 |
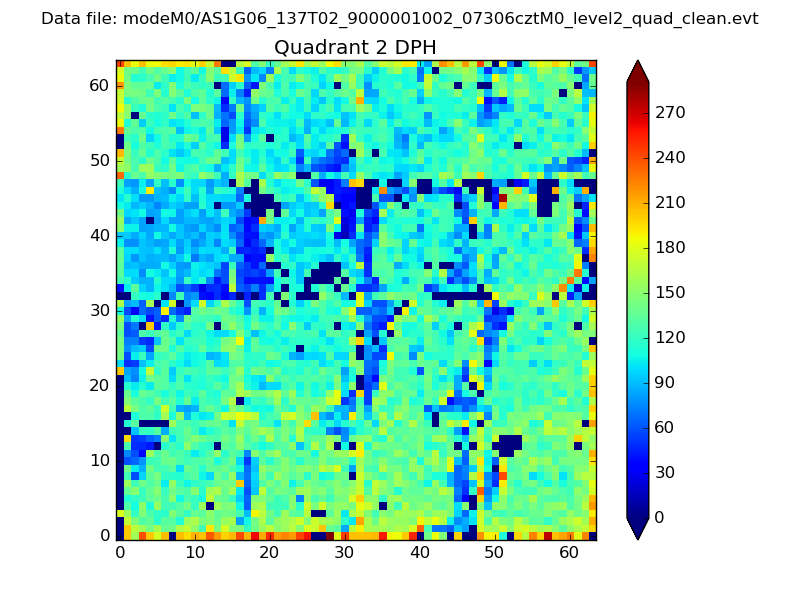
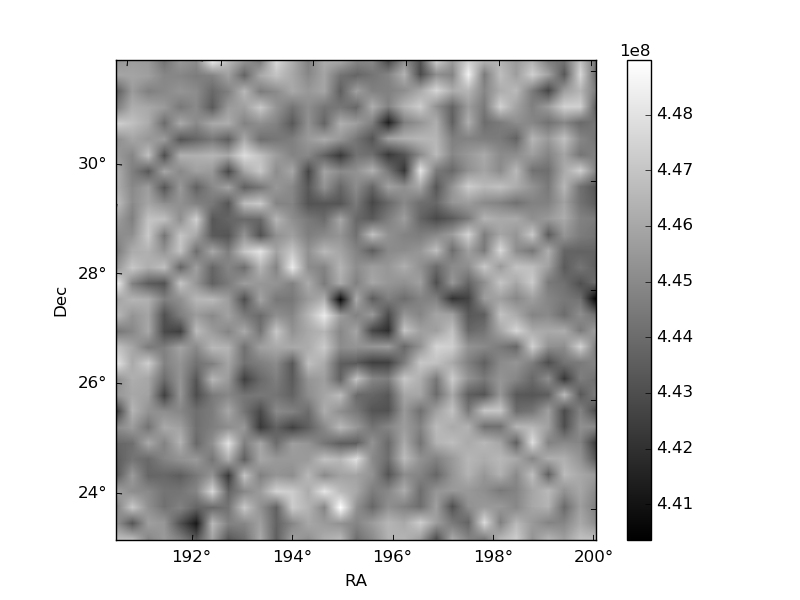
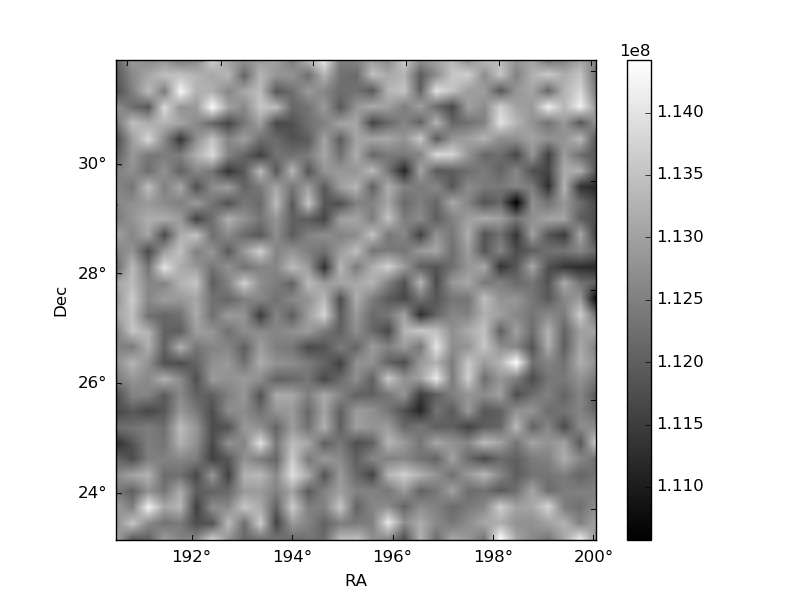
Histogram calculated using DETX and DETY for each event in the final _common_clean file
| Quadrant A | 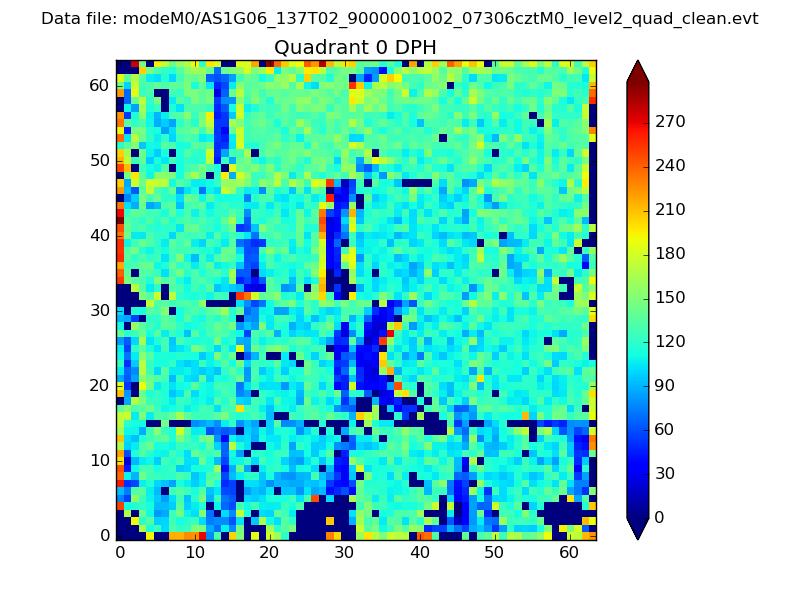 |
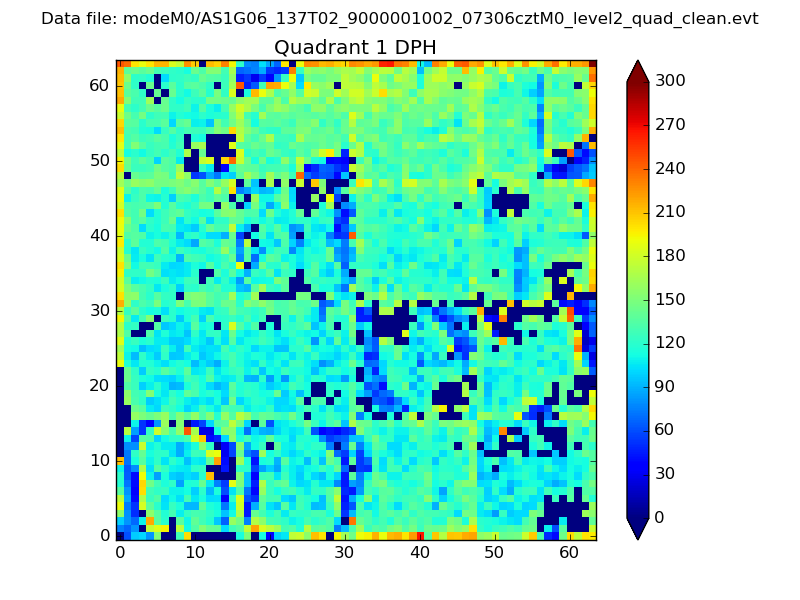 |
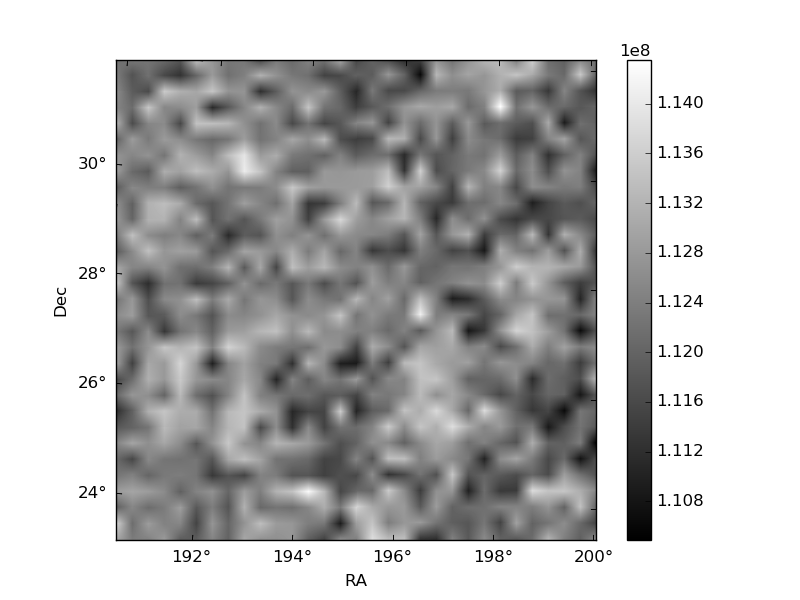
Quadrant B |
|---|---|---|---|
| Quadrant D | 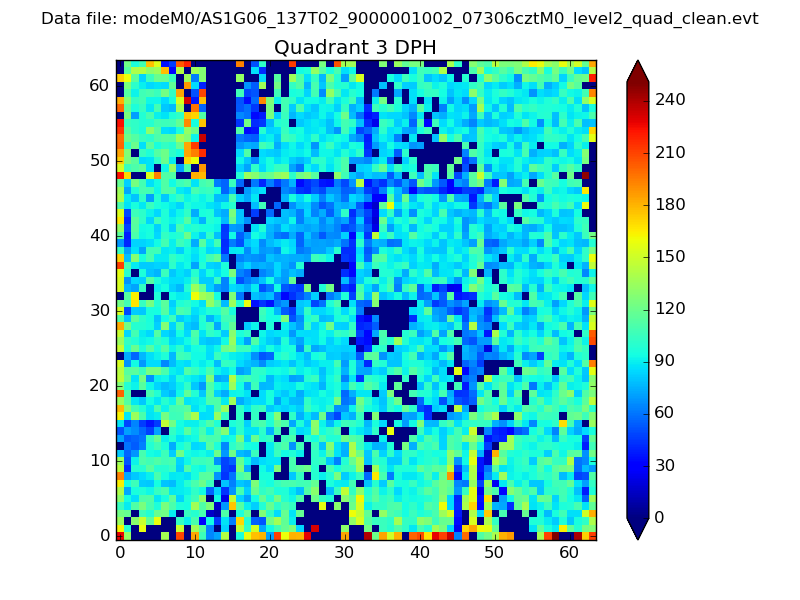 |
 |
Quadrant C |
| Plot type | Count rate plots | Images |
|---|---|---|
| Comparison with Poisson distribution Blue bars denote a histogram of data divided into 1 sec bins. Red curve is a Poisson curve with rate = median count rate of data. |
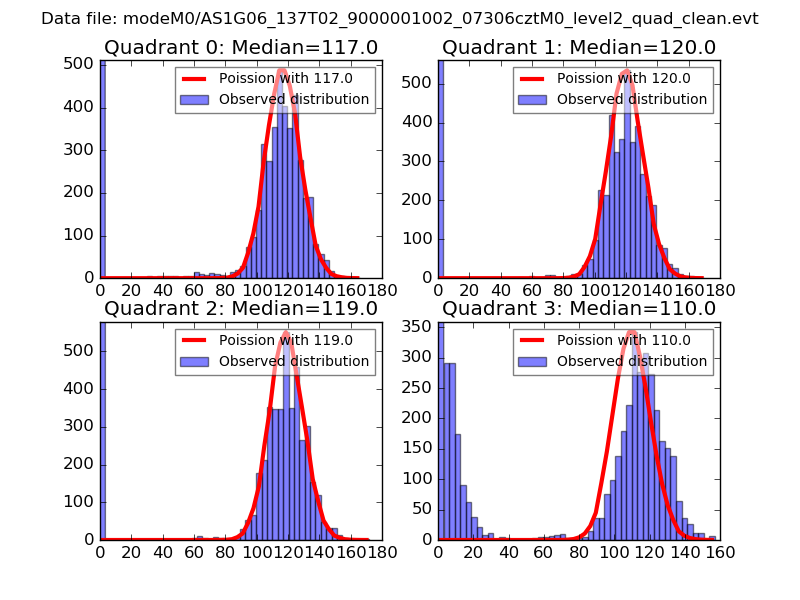 |
 |
| Quadrant-wise count rates Data is divided into 100 sec bins |
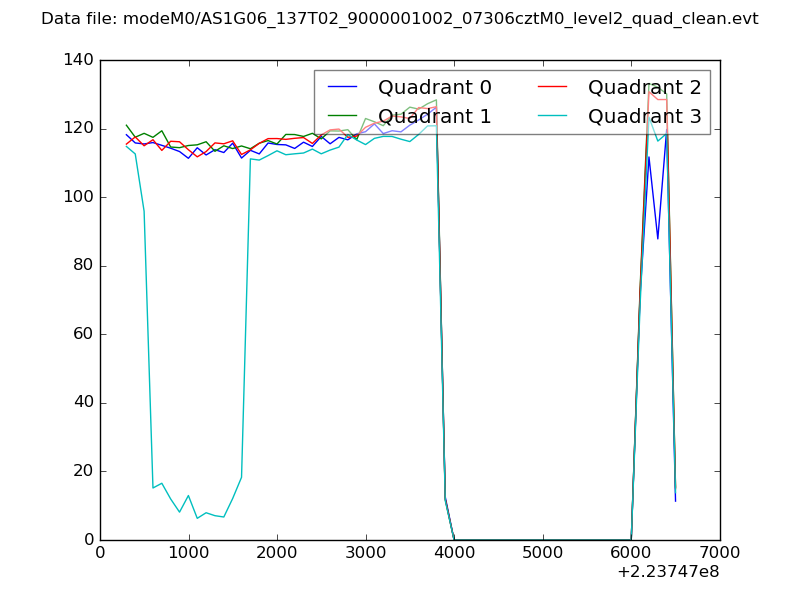 |
|
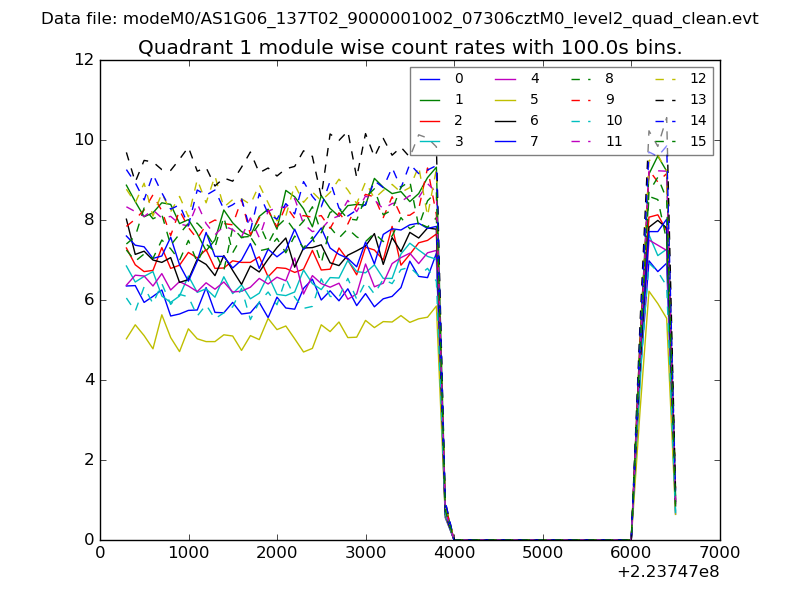
| Module-wise count rates for Quadrant A Data is divided into 100 sec bins |
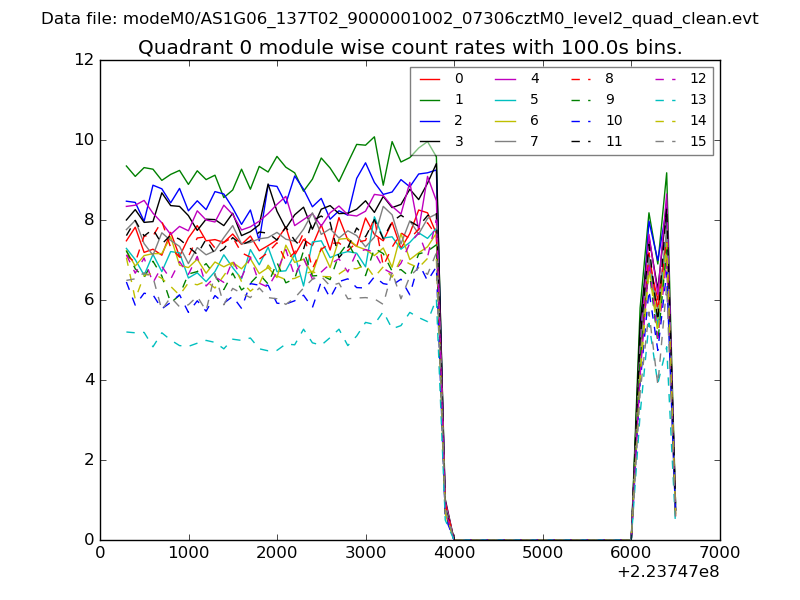 |
 |
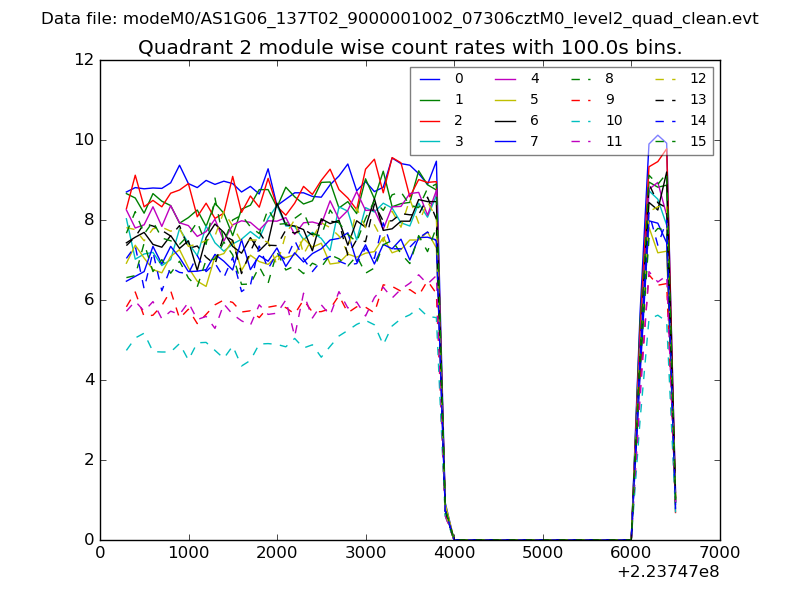
| Module-wise count rates for Quadrant B Data is divided into 100 sec bins |
 |
 |
| Module-wise count rates for Quadrant C Data is divided into 100 sec bins |
 |
 |
| Module-wise count rates for Quadrant D Data is divided into 100 sec bins |
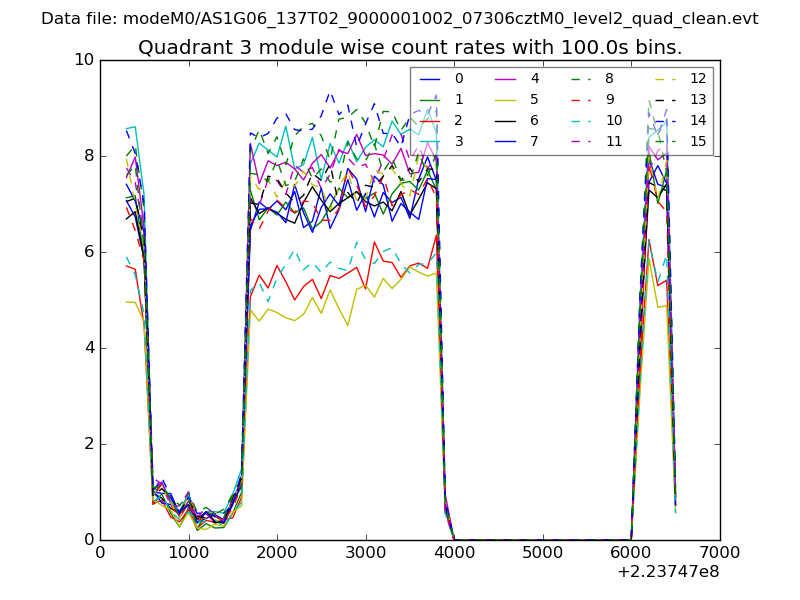 |
 |
| Parameter | Plot |
|---|---|
| CZT HV Monitor | 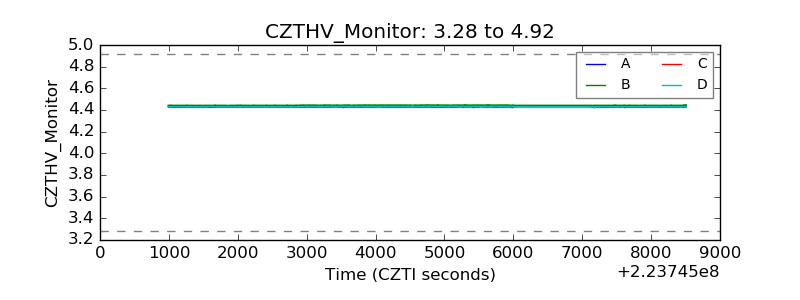 |
| D_VDD | 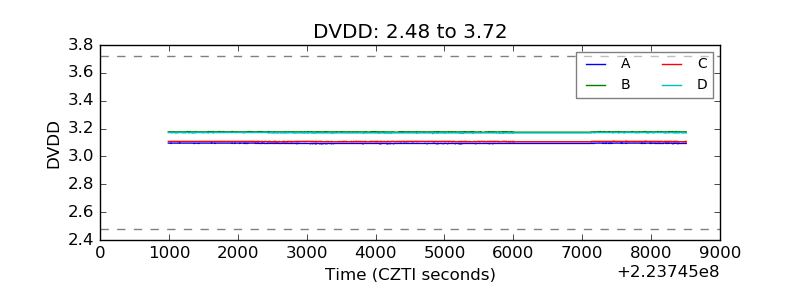 |
| Temperature 1 | 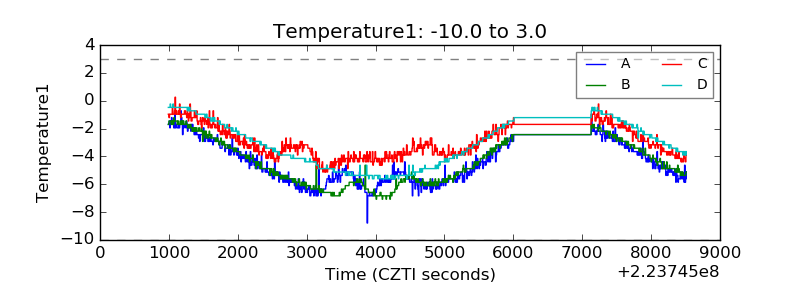 |
| Veto HV Monitor | 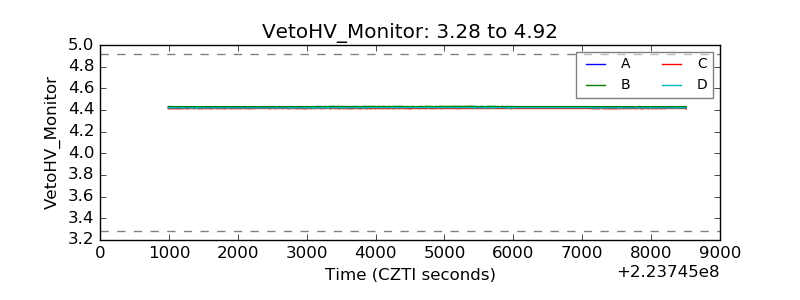 |
| Veto LLD |  |
| Alpha Counter | 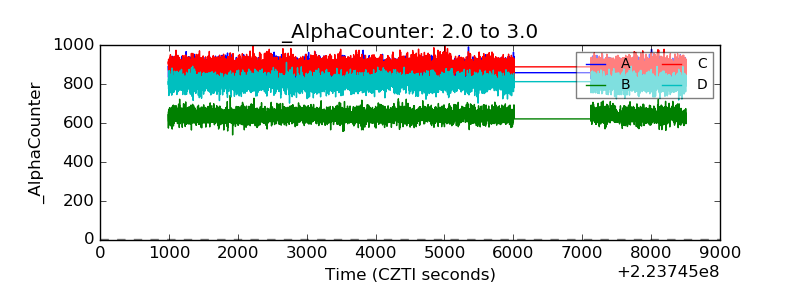 |
| _CPM_Rate | 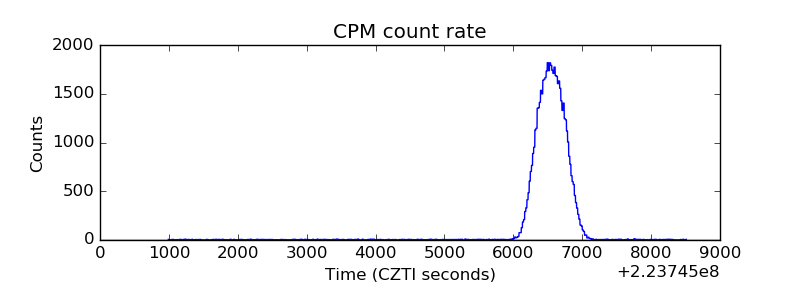 |
| CZT Counter |  |
| +2.5 Volts monitor |  |
| +5 Volts monitor |  |
| _ROLL_ROT | 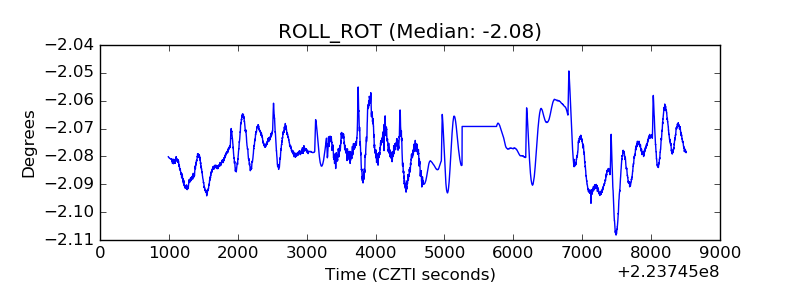 |
| _Roll_DEC | 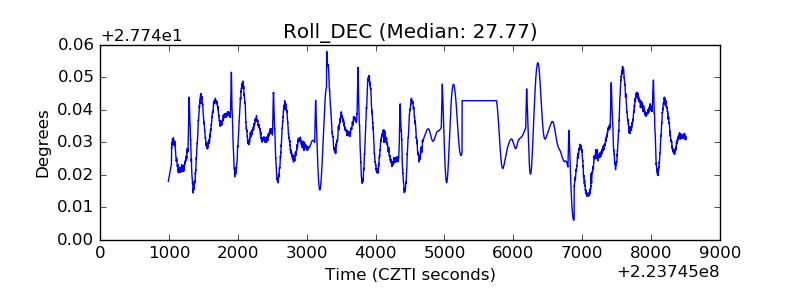 |
| _Roll_RA | 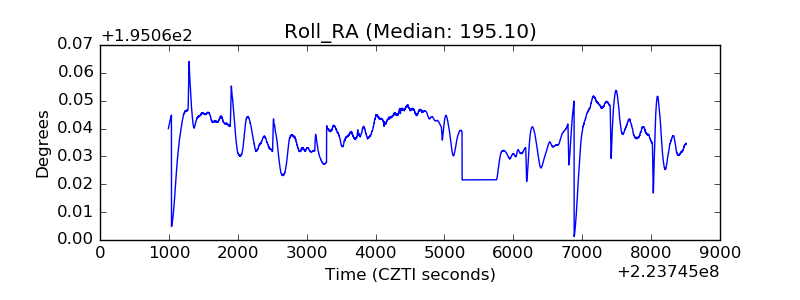 |
| Veto Counter | 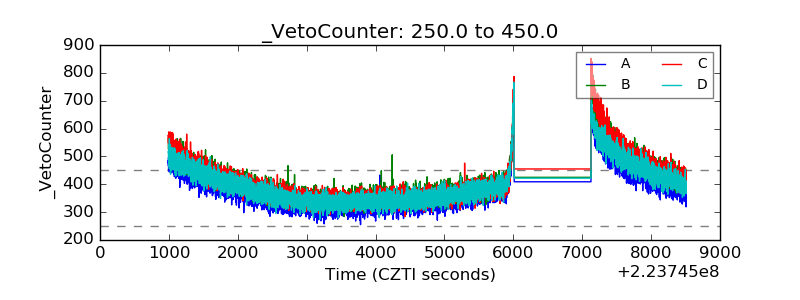 |