| Param | Original file | Final file |
|---|---|---|
| Filename | modeM0/AS1G06_137T02_9000001002_07307cztM0_level2.evt | modeM0/AS1G06_137T02_9000001002_07307cztM0_level2_quad_clean.evt |
| Size (bytes) | 512,285,760 | 86,359,680 |
| Size | 488.6 MB | 82.4 MB |
| Events in quadrant A | 3,844,853 | 531,987 |
| Events in quadrant B | 3,302,525 | 556,182 |
| Events in quadrant C | 3,176,301 | 552,759 |
| Events in quadrant D | 4,745,287 | 516,256 |
| Mode M0 | |||
|---|---|---|---|
| Quadrant | BADHDUFLAG | Total packets | Discarded packets |
| A | 0 | 15799 | 3 |
| B | 0 | 14210 | 2 |
| C | 0 | 13918 | 2 |
| D | 0 | 18703 | 2 |
| Mode SS | |||
|---|---|---|---|
| Quadrant | BADHDUFLAG | Total packets | Discarded packets |
| A | 0 | 136 | 0 |
| B | 0 | 136 | 0 |
| C | 0 | 136 | 0 |
| D | 0 | 136 | 0 |
| Mode M9 | |||
|---|---|---|---|
| Quadrant | BADHDUFLAG | Total packets | Discarded packets |
| A | 0 | 23 | 0 |
| B | 0 | 23 | 0 |
| C | 0 | 23 | 0 |
| D | 0 | 23 | 0 |
| Quadrant | Total seconds | Saturated seconds | Saturation percentage |
|---|---|---|---|
| A | 6564 | 240 | 3.656307% |
| B | 6564 | 86 | 1.310177% |
| C | 6564 | 75 | 1.142596% |
| D | 6564 | 302 | 4.600853% |
Noise dominated data is calculated using 1-second bins in cleaned event files. If a bin has >2000 counts, and if more than 50% of those come from <1% of pixels, then it is considered to be noise-dominated and hence unusable.
| Quadrant | # 1 sec bins | Bins with >0 counts | Bins with >2000 counts | High rate bins dominated by noise | Noise dominated (total time) | Noise dominated (detector-on time) | Marked lightcurve |
|---|---|---|---|---|---|---|---|
| A | 8884 | 6564 | 103 | 103 | 1.16% | 1.57% | 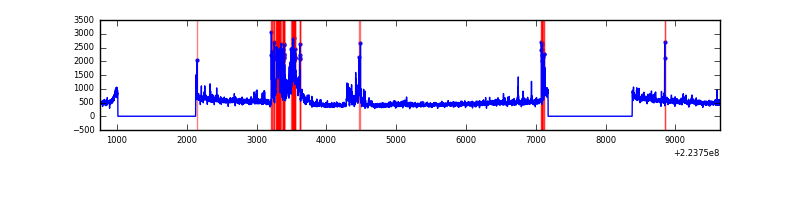 |
| B | 8884 | 6564 | 2 | 2 | 0.02% | 0.03% | 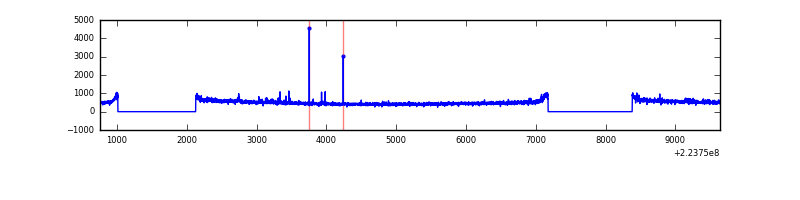 |
| C | 8884 | 6565 | 1 | 1 | 0.01% | 0.02% |  |
| D | 8884 | 6564 | 219 | 219 | 2.47% | 3.34% | 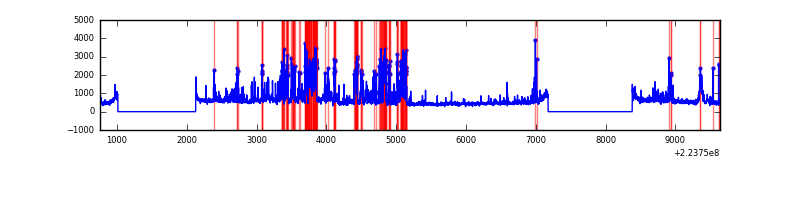 |
Top three noisy pixels from each quadrant. If the there are fewer than three noisy pixels in the level2.evt file, extra rows are filled as -1
| Pixel properties | Quadrant properties | ||||||
|---|---|---|---|---|---|---|---|
| Quadrant | DetID | PixID | Counts | Sigma | Mean | Median | Sigma |
| A | 15 | 234 | 601805 | 3653.16 | 808 | 792 | 164.5 |
| A | 8 | 15 | 99895 | 602.38 | 808 | 792 | 164.5 |
| A | 13 | 170 | 18131 | 105.39 | 808 | 792 | 164.5 |
| B | 0 | 214 | 65415 | 407.91 | 829 | 809 | 158.4 |
| B | 12 | 111 | 15250 | 91.18 | 829 | 809 | 158.4 |
| B | 11 | 111 | 12467 | 73.61 | 829 | 809 | 158.4 |
| C | 10 | 22 | 16065 | 80.96 | 807 | 813 | 188.4 |
| C | 9 | 68 | 6715 | 31.33 | 807 | 813 | 188.4 |
| C | 1 | 16 | 6572 | 30.57 | 807 | 813 | 188.4 |
| D | 2 | 33 | 901626 | 4562.27 | 798 | 773 | 197.5 |
| D | 2 | 216 | 376328 | 1901.96 | 798 | 773 | 197.5 |
| D | 1 | 20 | 332118 | 1678.06 | 798 | 773 | 197.5 |
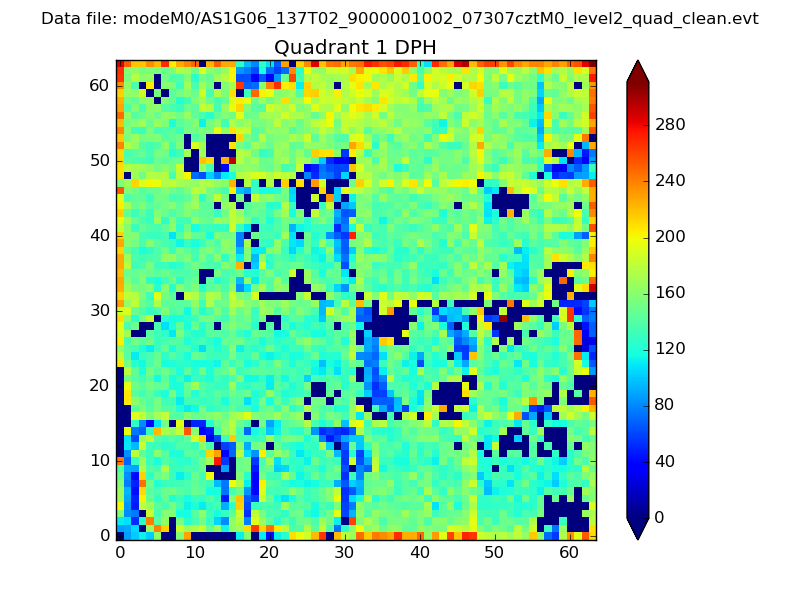
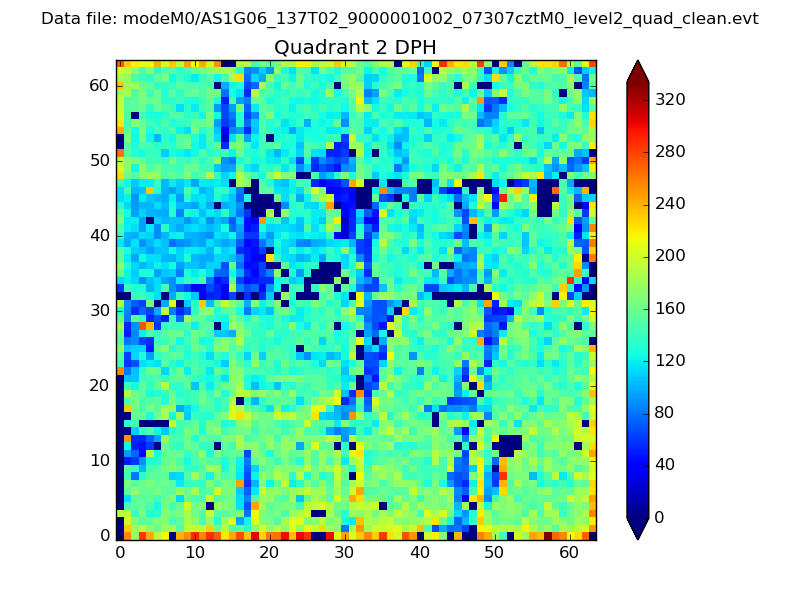
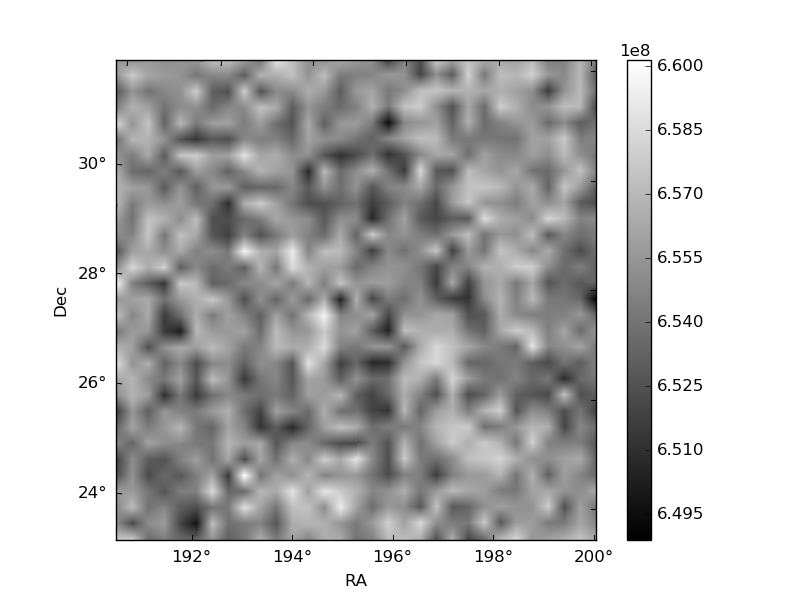
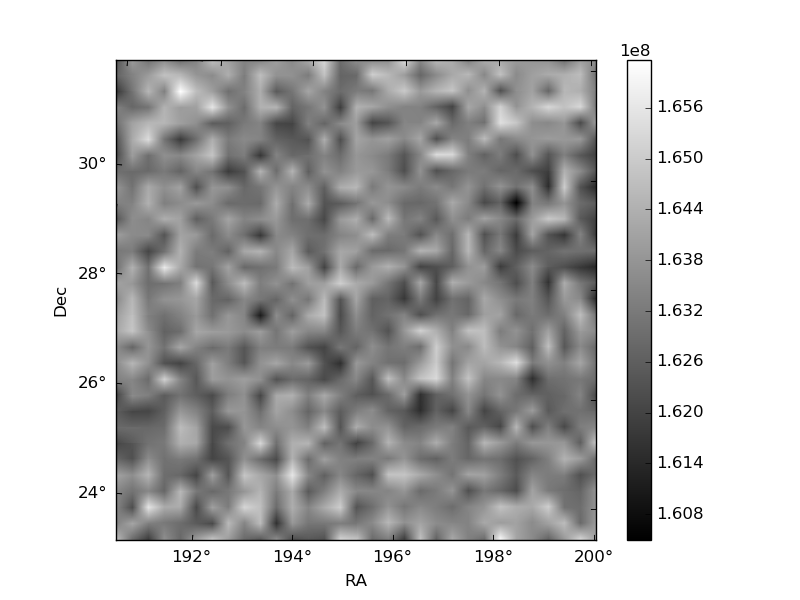
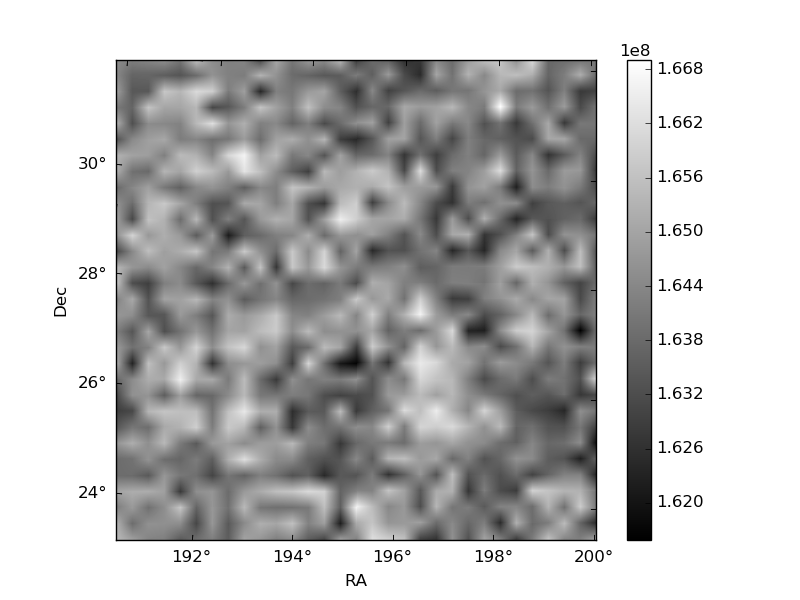
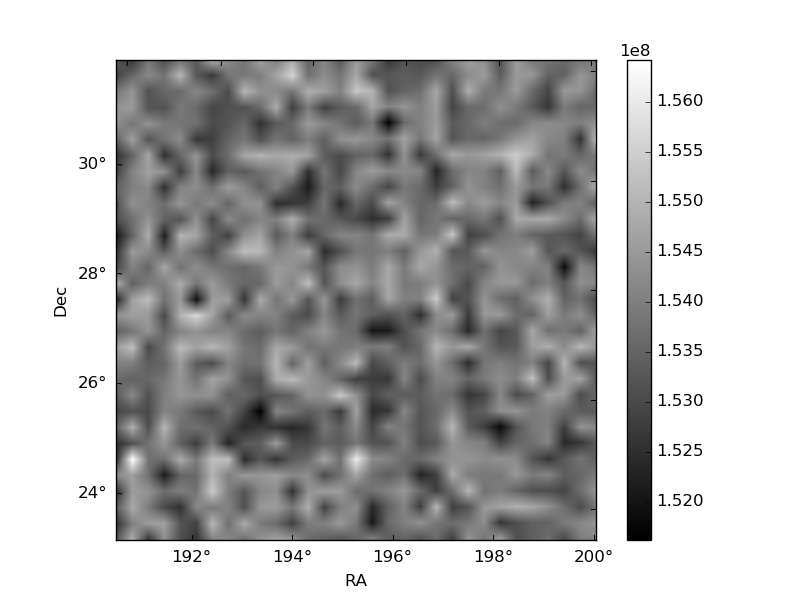
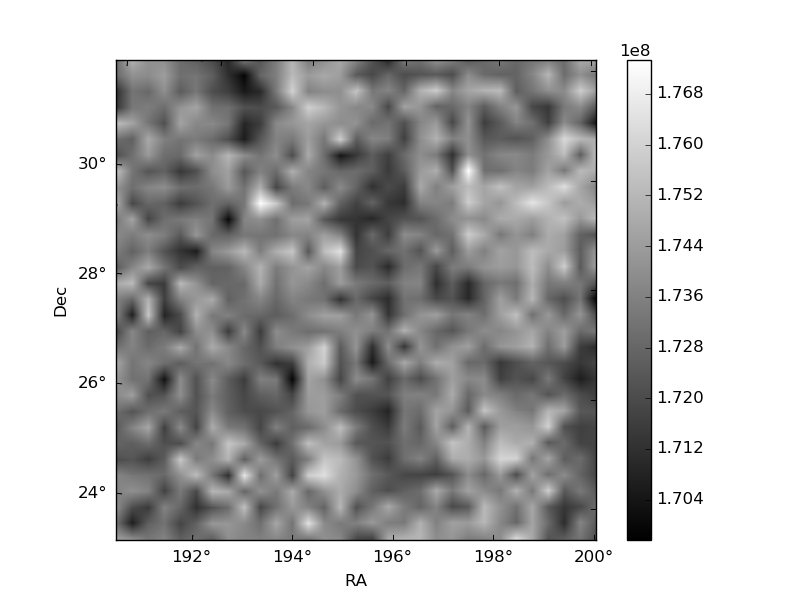
Histogram calculated using DETX and DETY for each event in the final _common_clean file
| Quadrant A | 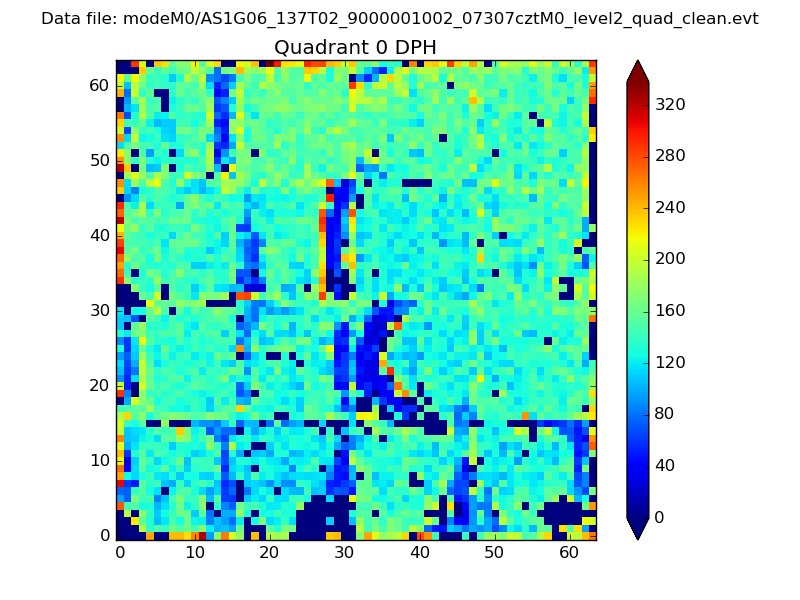 |
 |
Quadrant B |
|---|---|---|---|
| Quadrant D | 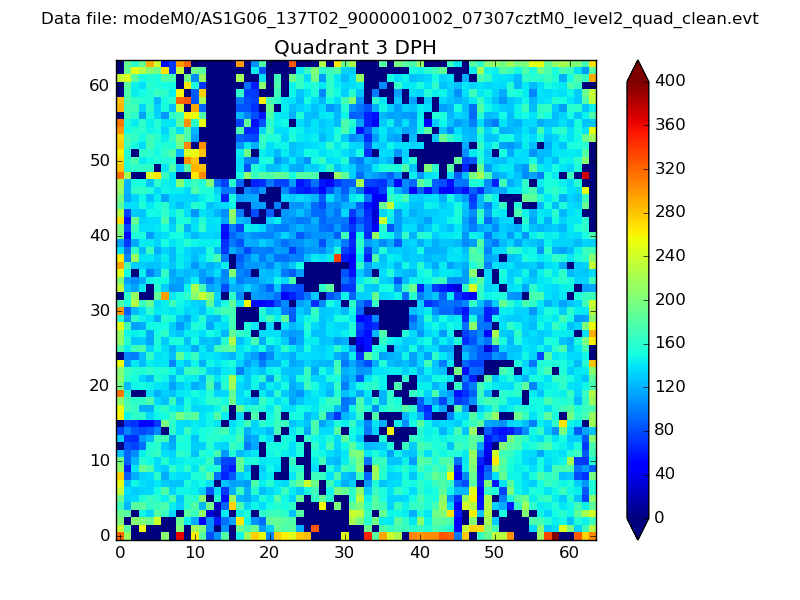 |
 |
Quadrant C |
| Plot type | Count rate plots | Images |
|---|---|---|
| Comparison with Poisson distribution Blue bars denote a histogram of data divided into 1 sec bins. Red curve is a Poisson curve with rate = median count rate of data. |
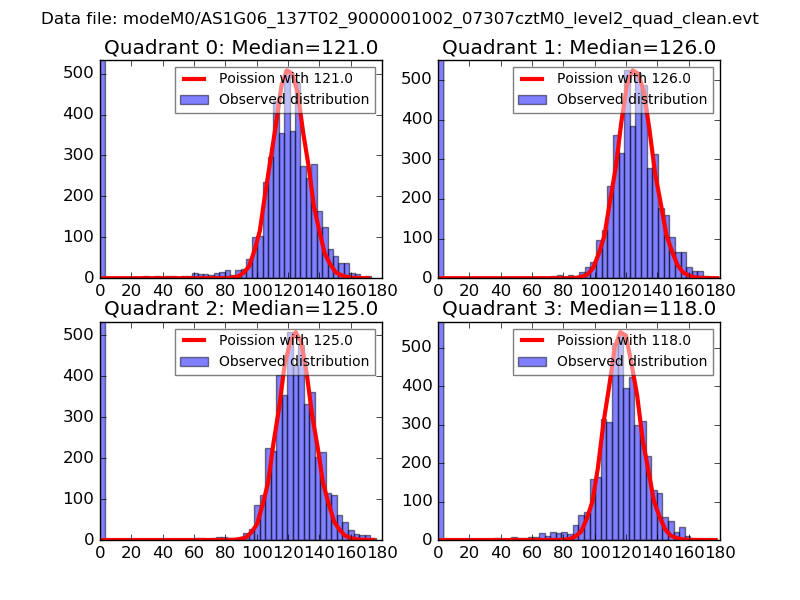 |
 |
| Quadrant-wise count rates Data is divided into 100 sec bins |
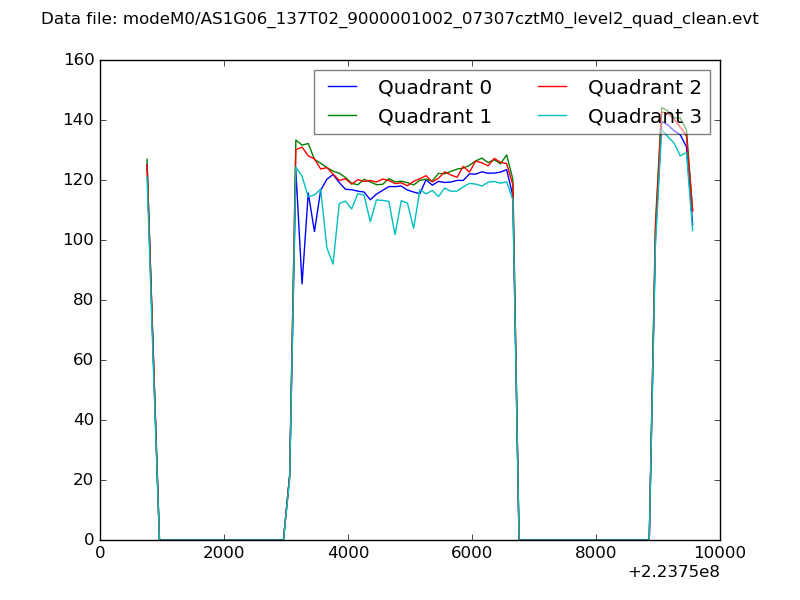 |
|
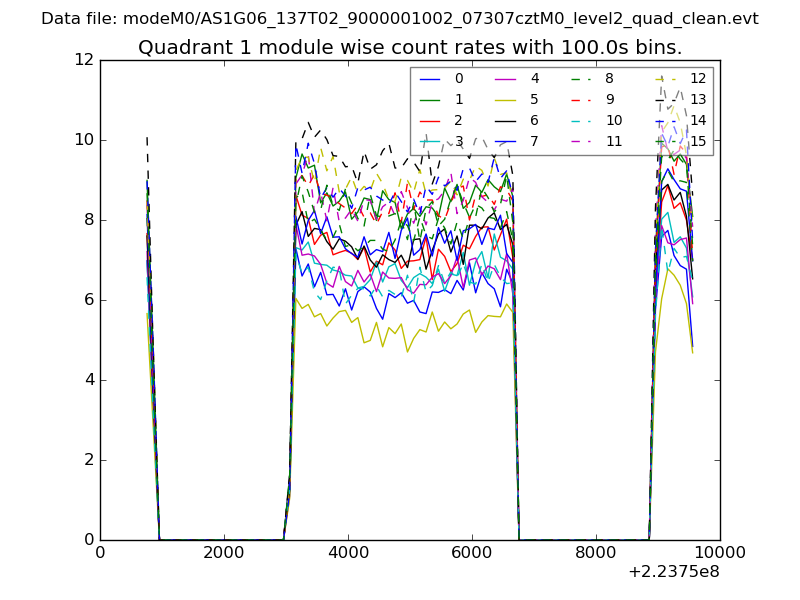
| Module-wise count rates for Quadrant A Data is divided into 100 sec bins |
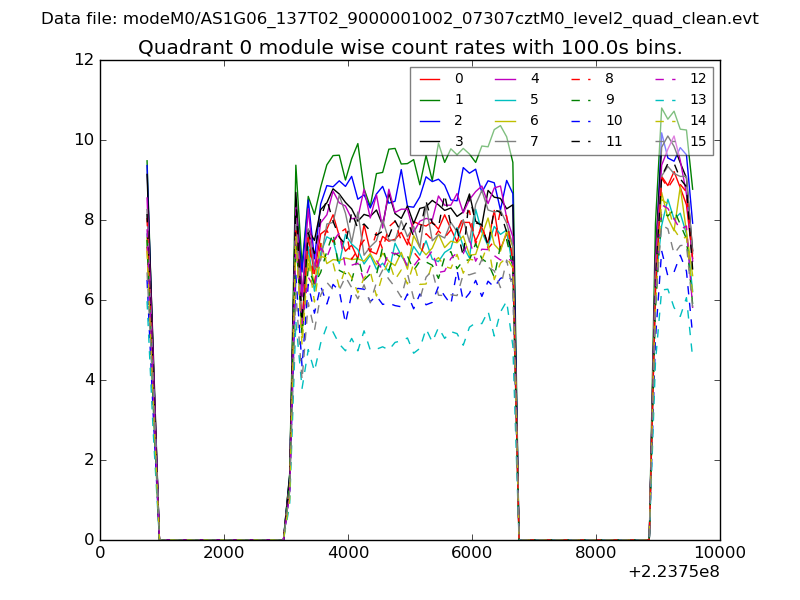 |
 |
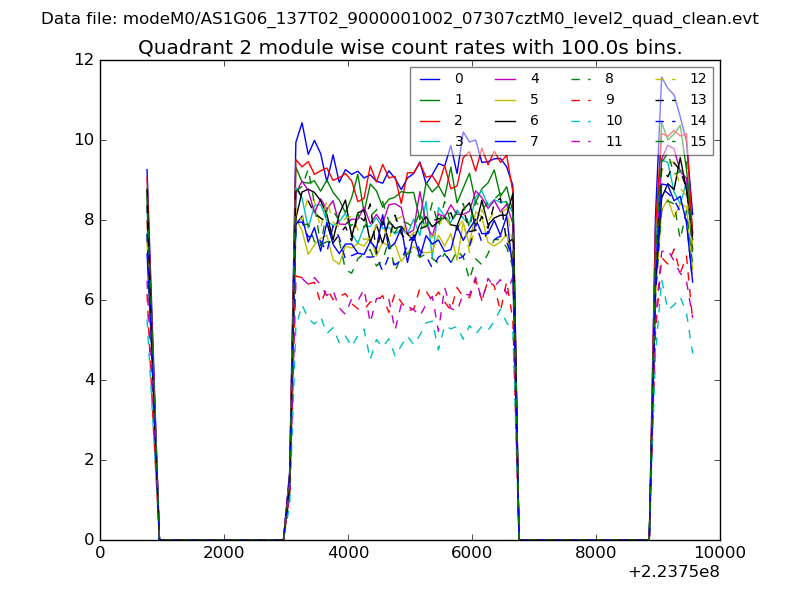
| Module-wise count rates for Quadrant B Data is divided into 100 sec bins |
 |
 |
| Module-wise count rates for Quadrant C Data is divided into 100 sec bins |
 |
 |
| Module-wise count rates for Quadrant D Data is divided into 100 sec bins |
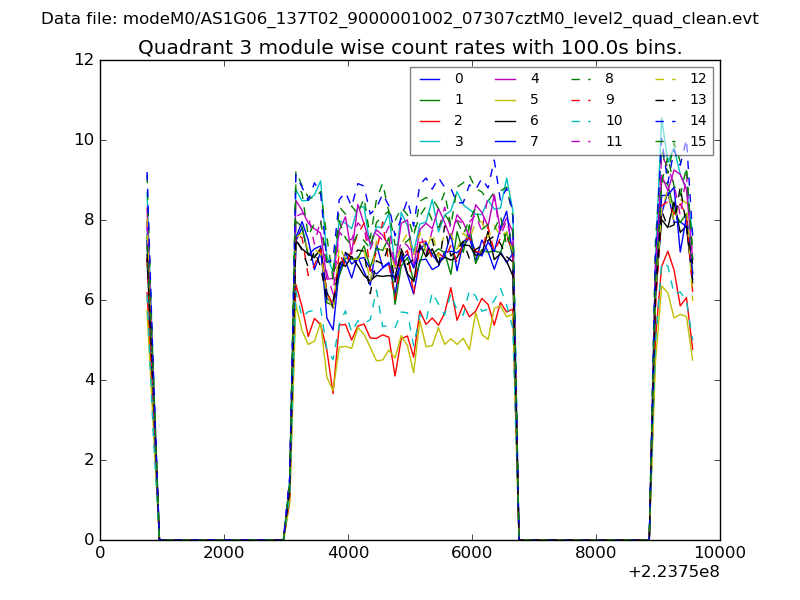 |
 |
| Parameter | Plot |
|---|---|
| CZT HV Monitor | 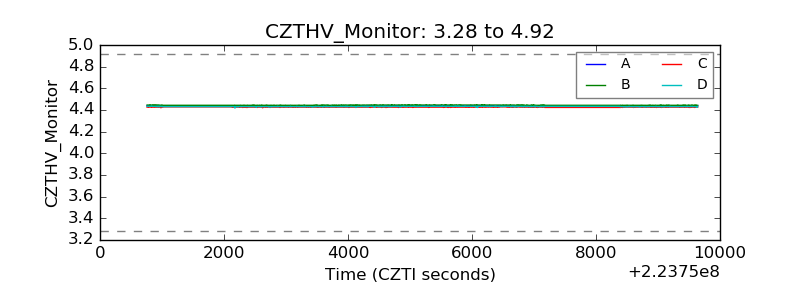 |
| D_VDD | 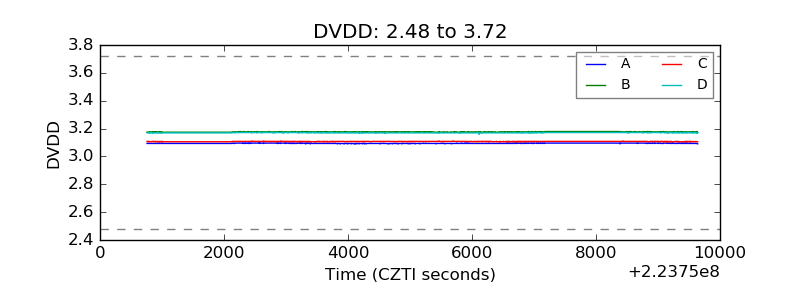 |
| Temperature 1 | 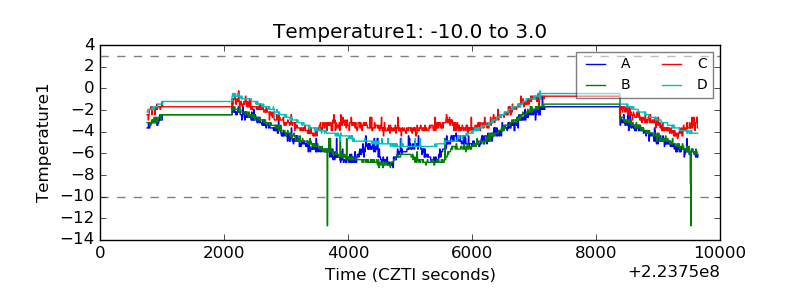 |
| Veto HV Monitor |  |
| Veto LLD | 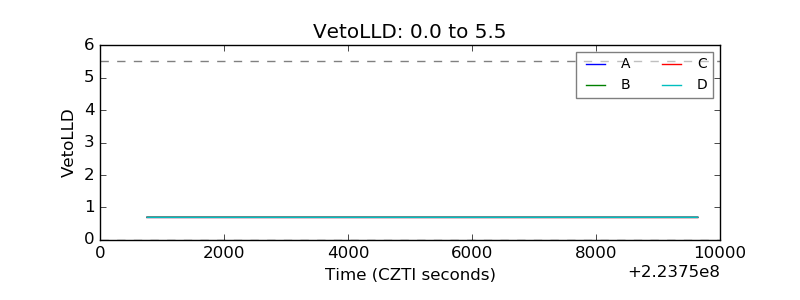 |
| Alpha Counter | 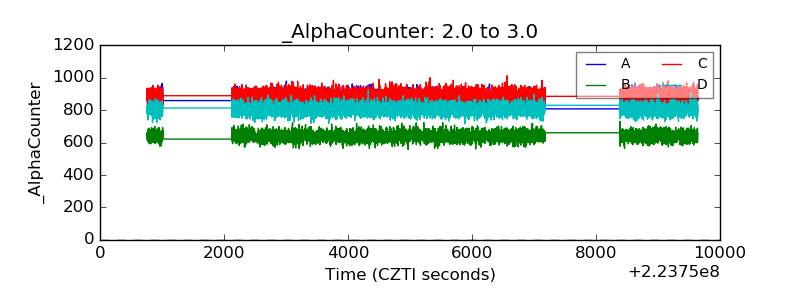 |
| _CPM_Rate | 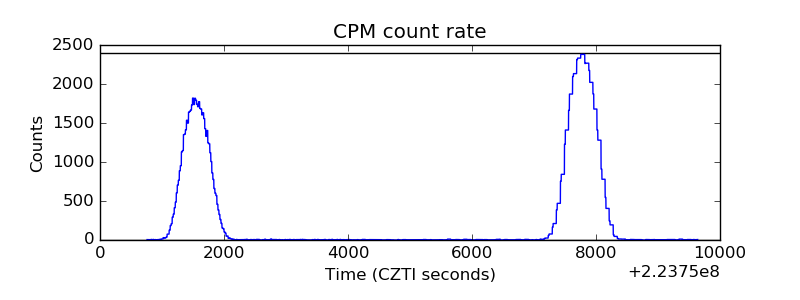 |
| CZT Counter | 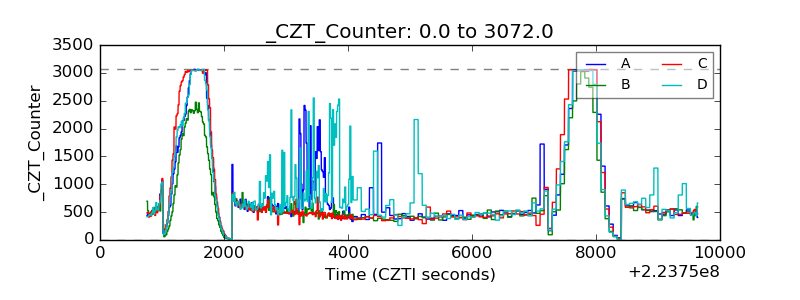 |
| +2.5 Volts monitor |  |
| +5 Volts monitor |  |
| _ROLL_ROT | 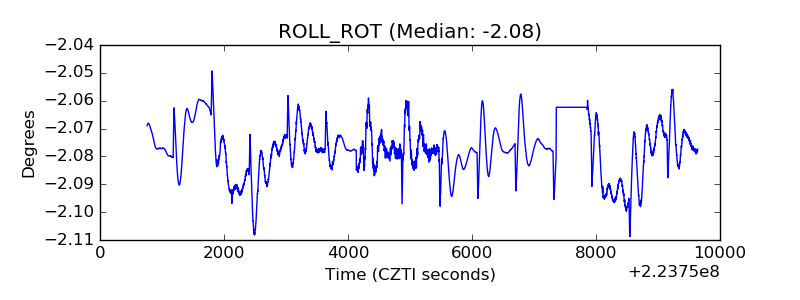 |
| _Roll_DEC | 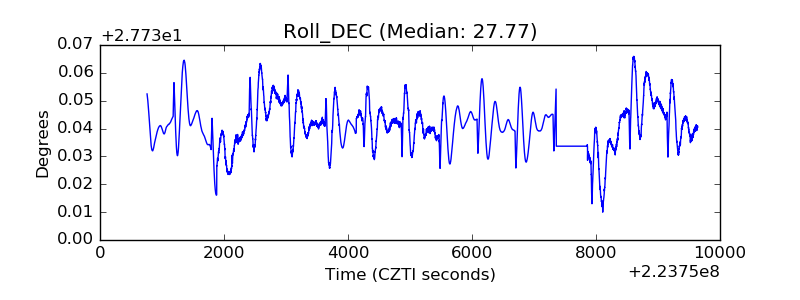 |
| _Roll_RA | 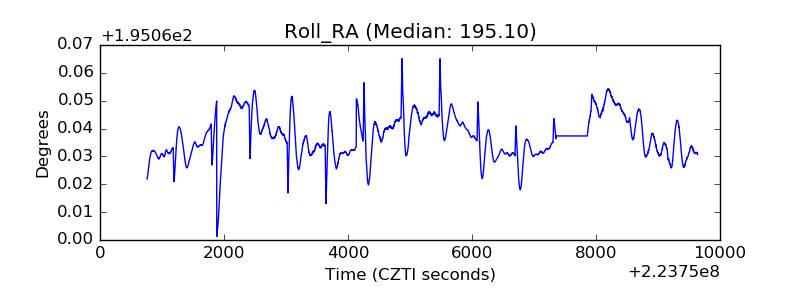 |
| Veto Counter | 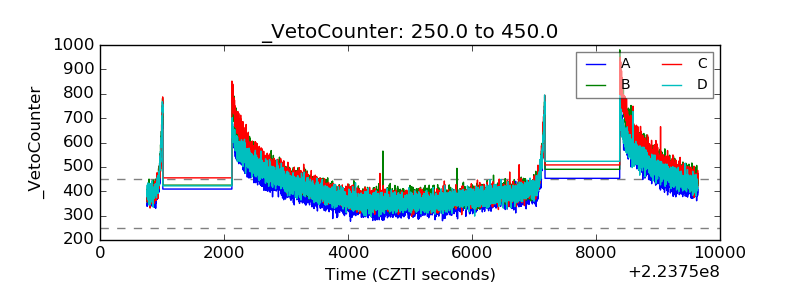 |