| Param | Original file | Final file |
|---|---|---|
| Filename | modeM0/AS1G06_137T02_9000001002_07308cztM0_level2.evt | modeM0/AS1G06_137T02_9000001002_07308cztM0_level2_quad_clean.evt |
| Size (bytes) | 456,886,080 | 94,541,760 |
| Size | 435.7 MB | 90.2 MB |
| Events in quadrant A | 3,120,704 | 602,386 |
| Events in quadrant B | 3,175,365 | 626,124 |
| Events in quadrant C | 2,996,689 | 618,341 |
| Events in quadrant D | 4,120,599 | 581,151 |
| Mode M0 | |||
|---|---|---|---|
| Quadrant | BADHDUFLAG | Total packets | Discarded packets |
| A | 0 | 13504 | 3 |
| B | 0 | 13594 | 2 |
| C | 0 | 13072 | 2 |
| D | 0 | 16424 | 2 |
| Mode SS | |||
|---|---|---|---|
| Quadrant | BADHDUFLAG | Total packets | Discarded packets |
| A | 0 | 128 | 0 |
| B | 0 | 128 | 0 |
| C | 0 | 128 | 0 |
| D | 0 | 128 | 0 |
| Mode M9 | |||
|---|---|---|---|
| Quadrant | BADHDUFLAG | Total packets | Discarded packets |
| A | 0 | 17 | 0 |
| B | 0 | 17 | 0 |
| C | 0 | 17 | 0 |
| D | 0 | 18 | 0 |
| Quadrant | Total seconds | Saturated seconds | Saturation percentage |
|---|---|---|---|
| A | 6228 | 50 | 0.802826% |
| B | 6228 | 56 | 0.899165% |
| C | 6228 | 37 | 0.594091% |
| D | 6228 | 166 | 2.665382% |
Noise dominated data is calculated using 1-second bins in cleaned event files. If a bin has >2000 counts, and if more than 50% of those come from <1% of pixels, then it is considered to be noise-dominated and hence unusable.
| Quadrant | # 1 sec bins | Bins with >0 counts | Bins with >2000 counts | High rate bins dominated by noise | Noise dominated (total time) | Noise dominated (detector-on time) | Marked lightcurve |
|---|---|---|---|---|---|---|---|
| A | 7534 | 6229 | 3 | 3 | 0.04% | 0.05% | 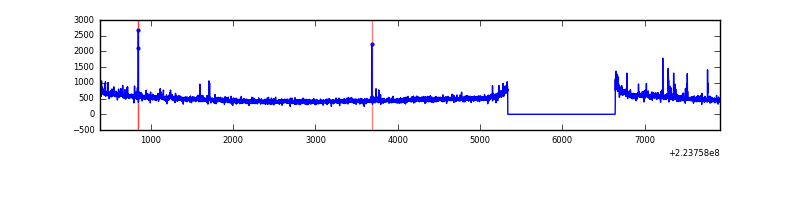 |
| B | 7534 | 6229 | 2 | 2 | 0.03% | 0.03% | 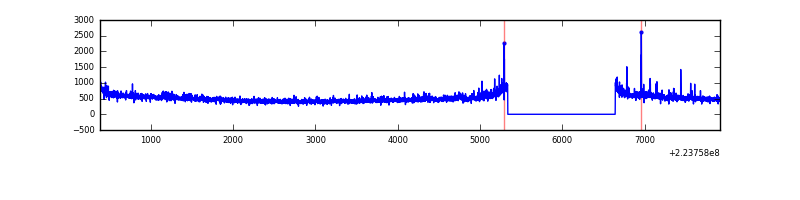 |
| C | 7534 | 6229 | 0 | 0 | 0.00% | 0.00% | 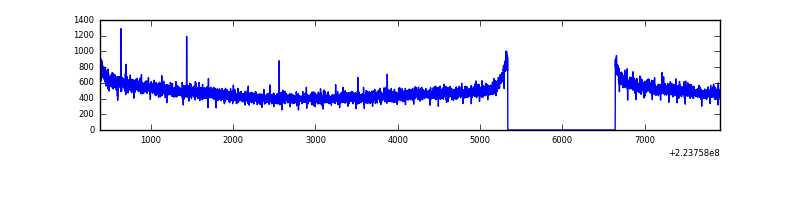 |
| D | 7534 | 6228 | 100 | 100 | 1.33% | 1.61% | 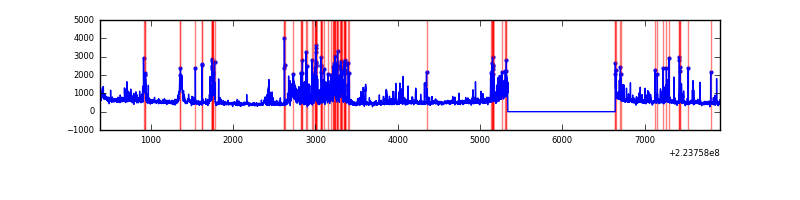 |
Top three noisy pixels from each quadrant. If the there are fewer than three noisy pixels in the level2.evt file, extra rows are filled as -1
| Pixel properties | Quadrant properties | ||||||
|---|---|---|---|---|---|---|---|
| Quadrant | DetID | PixID | Counts | Sigma | Mean | Median | Sigma |
| A | 8 | 15 | 69699 | 439.42 | 770 | 755 | 156.9 |
| A | 13 | 170 | 53523 | 336.32 | 770 | 755 | 156.9 |
| A | 13 | 248 | 15372 | 93.16 | 770 | 755 | 156.9 |
| B | 0 | 214 | 61399 | 405.62 | 787 | 769 | 149.5 |
| B | 4 | 81 | 43388 | 285.13 | 787 | 769 | 149.5 |
| B | 12 | 111 | 14505 | 91.9 | 787 | 769 | 149.5 |
| C | 9 | 68 | 6063 | 29.79 | 765 | 769 | 177.7 |
| C | 13 | 61 | 5905 | 28.9 | 765 | 769 | 177.7 |
| C | 10 | 22 | 3744 | 16.74 | 765 | 769 | 177.7 |
| D | 2 | 216 | 413990 | 2232.41 | 750 | 727 | 185.1 |
| D | 12 | 233 | 384333 | 2072.2 | 750 | 727 | 185.1 |
| D | 2 | 33 | 219926 | 1184.09 | 750 | 727 | 185.1 |
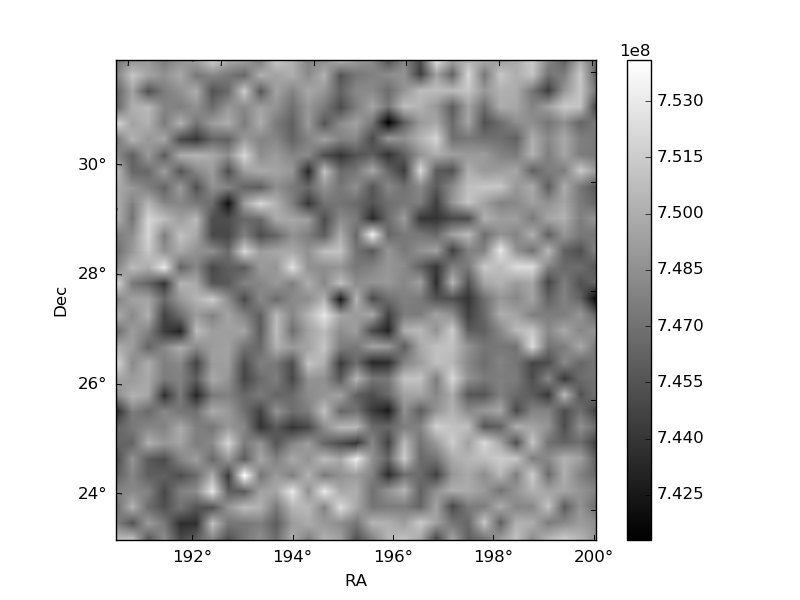
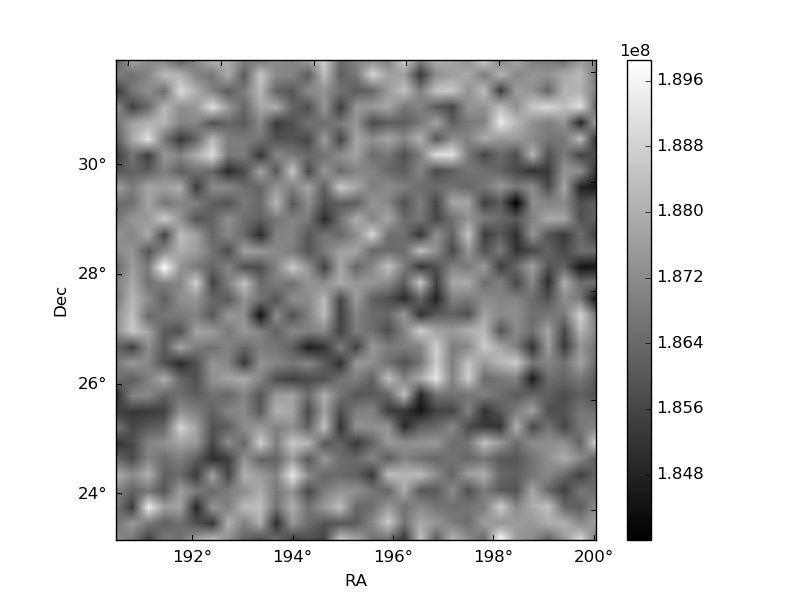
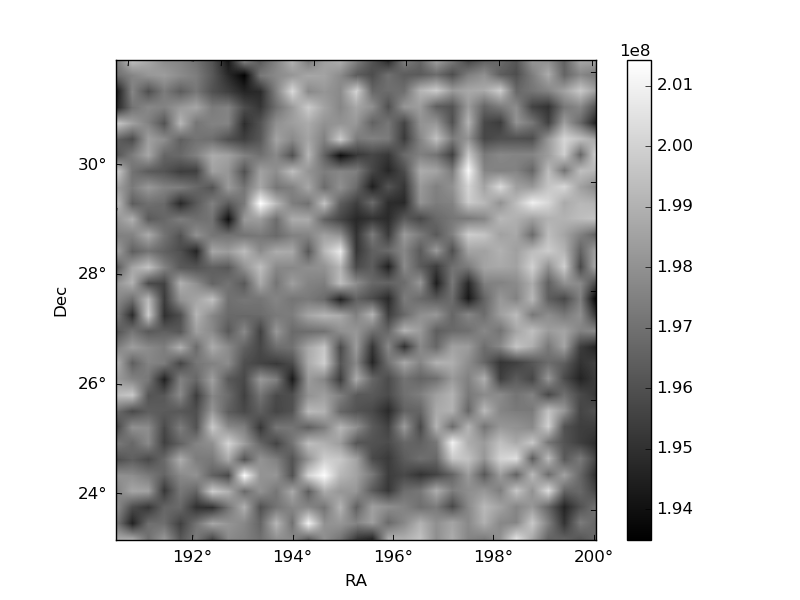
Histogram calculated using DETX and DETY for each event in the final _common_clean file
| Quadrant A | 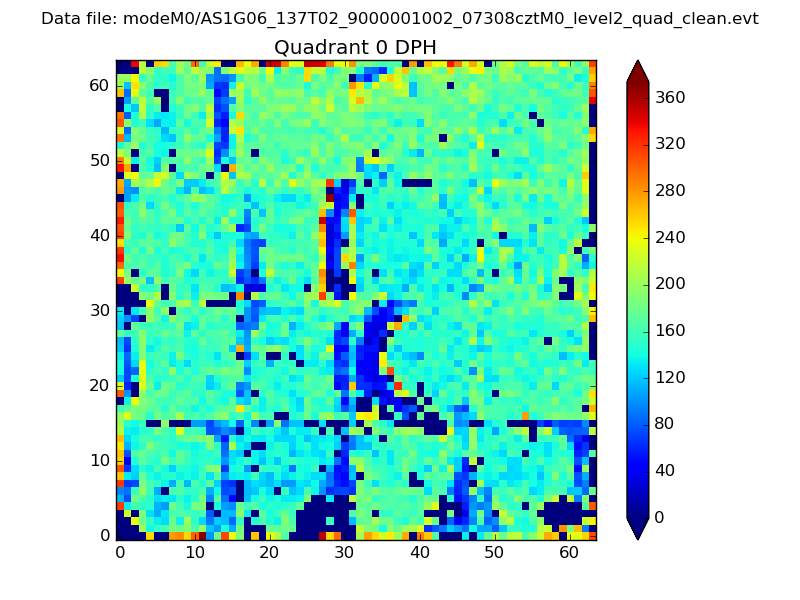 |
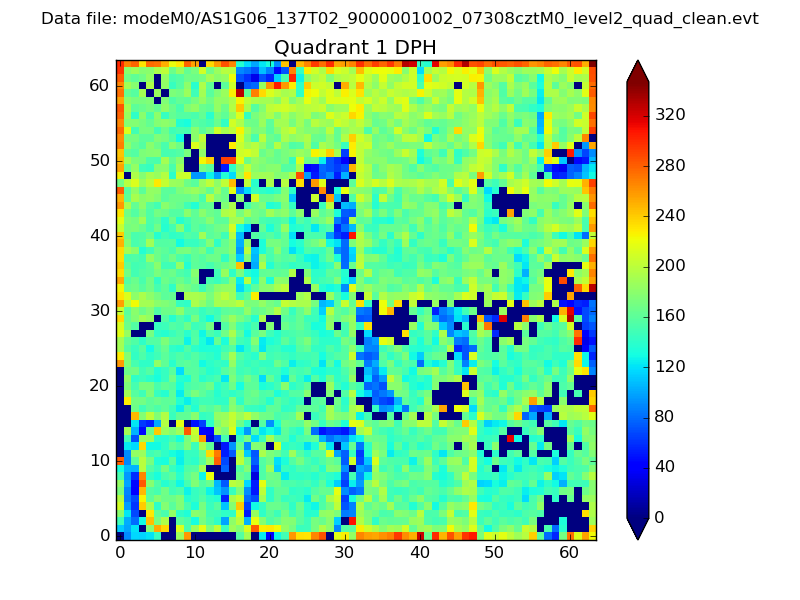 |
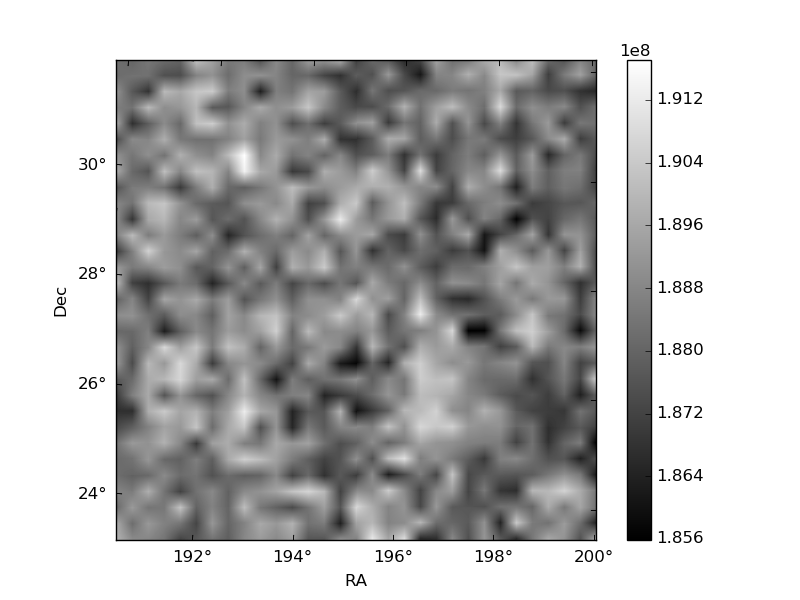
Quadrant B |
|---|---|---|---|
| Quadrant D | 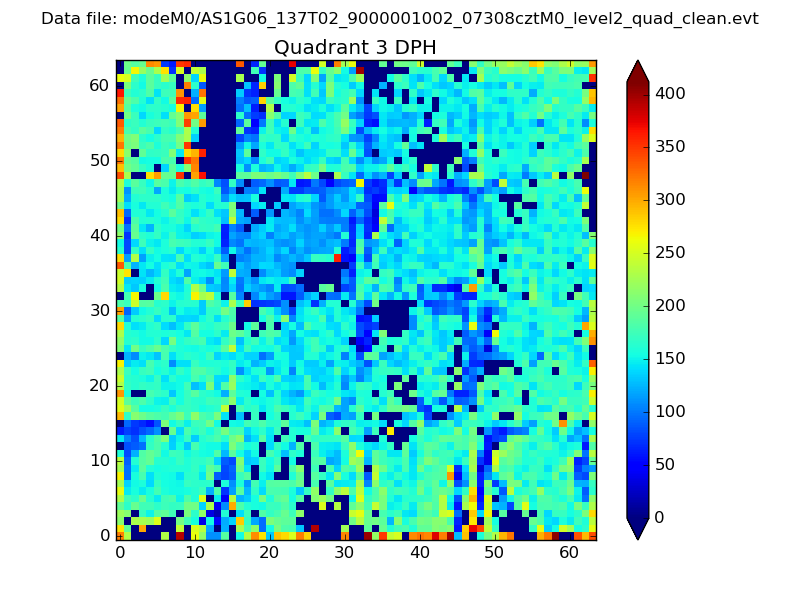 |
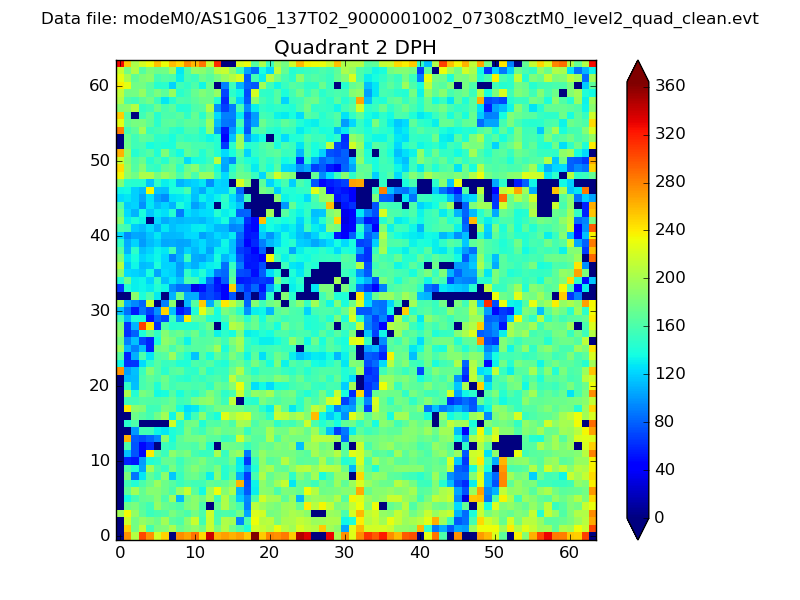 |
Quadrant C |
| Plot type | Count rate plots | Images |
|---|---|---|
| Comparison with Poisson distribution Blue bars denote a histogram of data divided into 1 sec bins. Red curve is a Poisson curve with rate = median count rate of data. |
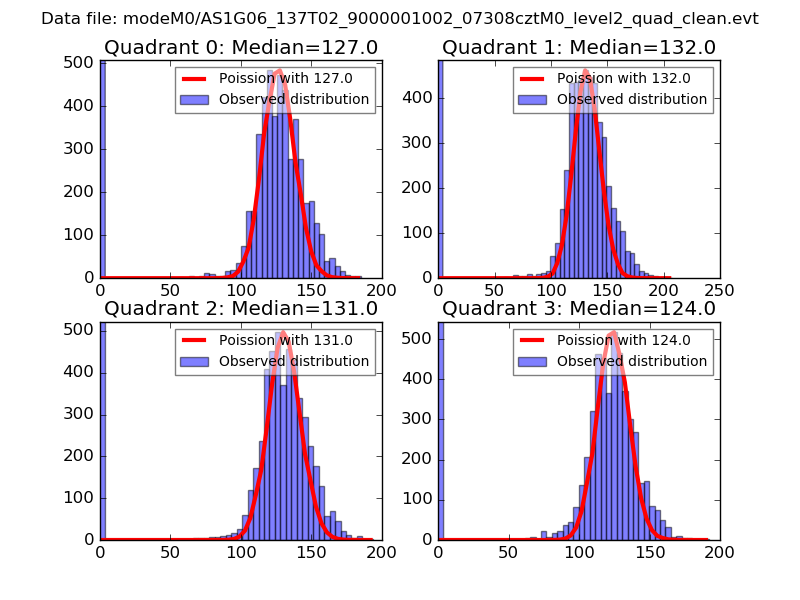 |
 |
| Quadrant-wise count rates Data is divided into 100 sec bins |
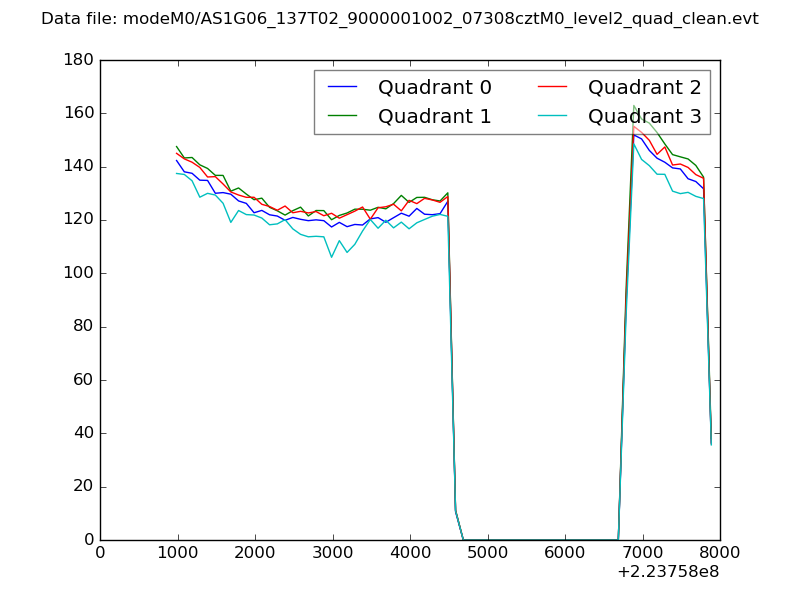 |
|
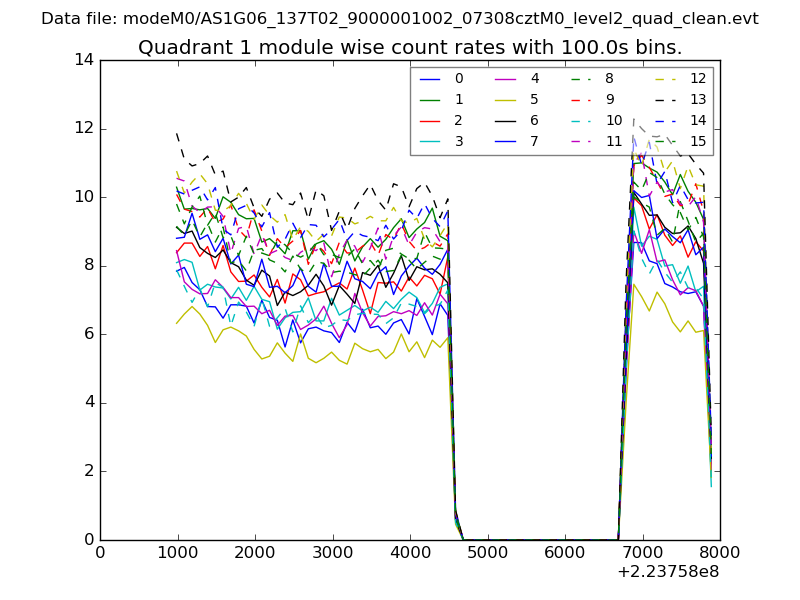
| Module-wise count rates for Quadrant A Data is divided into 100 sec bins |
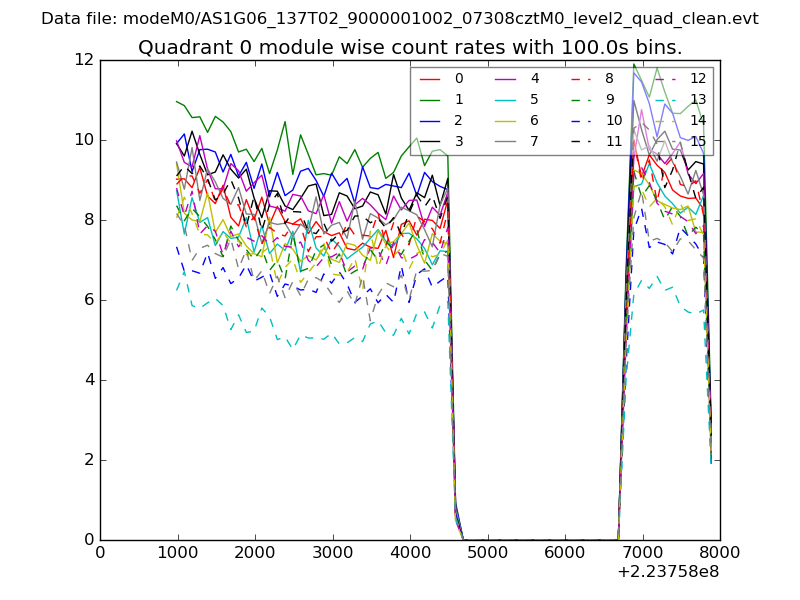 |
 |
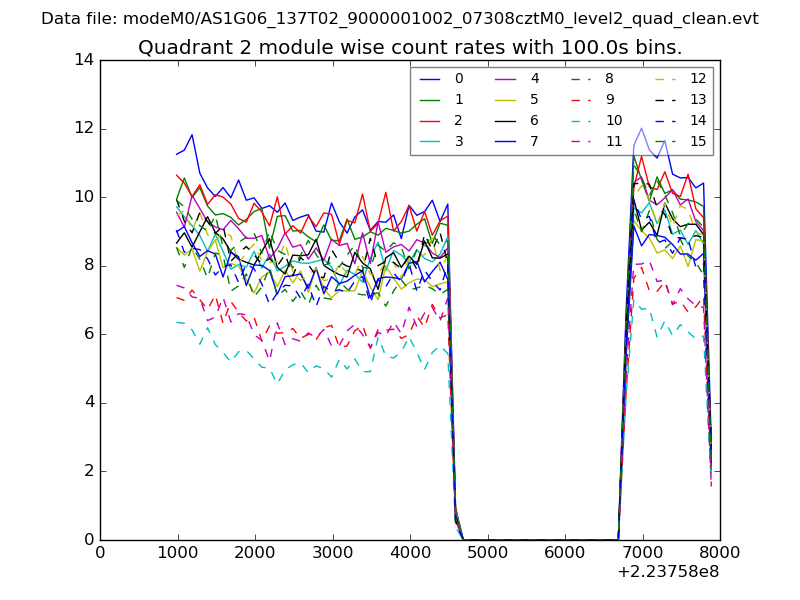
| Module-wise count rates for Quadrant B Data is divided into 100 sec bins |
 |
 |
| Module-wise count rates for Quadrant C Data is divided into 100 sec bins |
 |
 |
| Module-wise count rates for Quadrant D Data is divided into 100 sec bins |
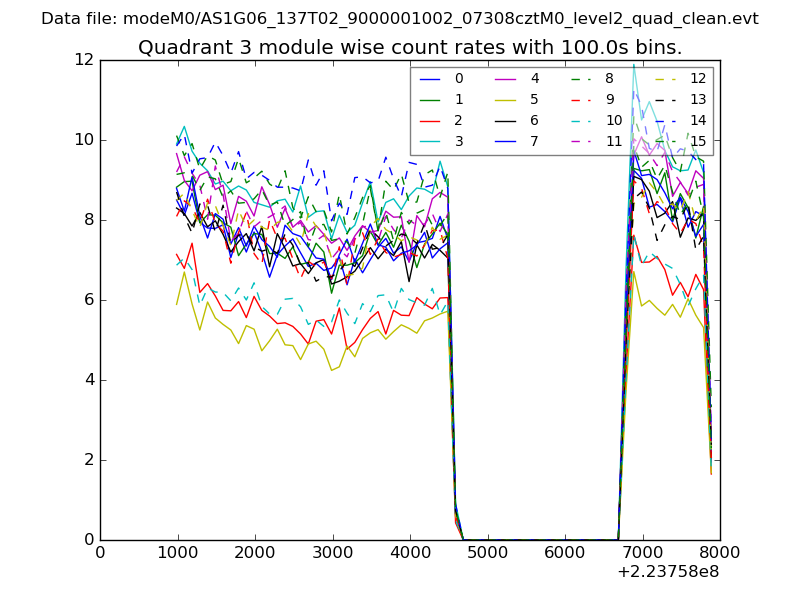 |
 |
| Parameter | Plot |
|---|---|
| CZT HV Monitor | 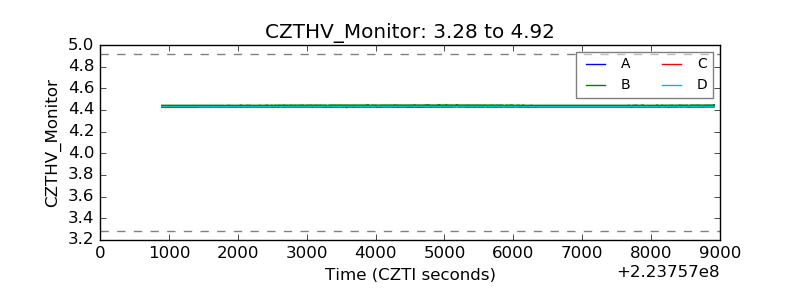 |
| D_VDD | 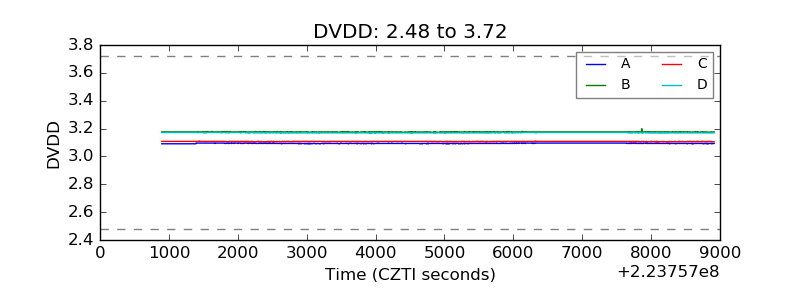 |
| Temperature 1 | 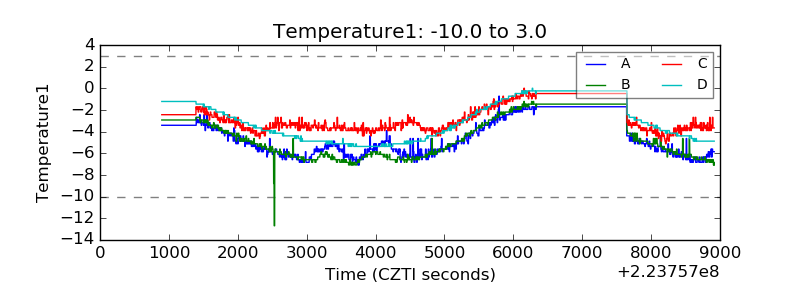 |
| Veto HV Monitor | 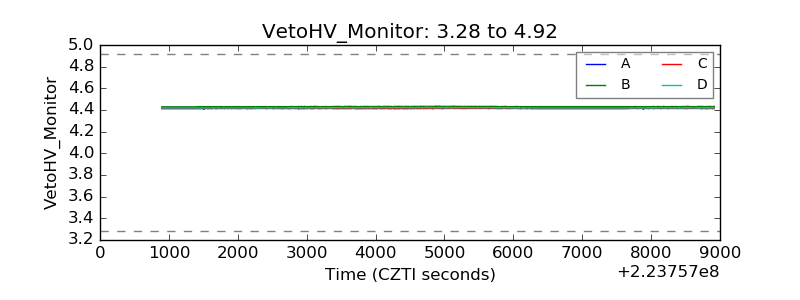 |
| Veto LLD | 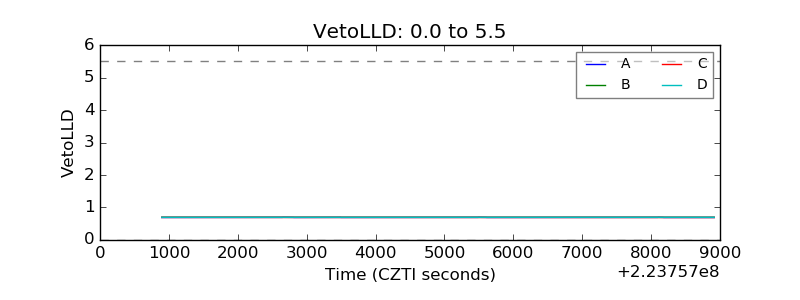 |
| Alpha Counter | 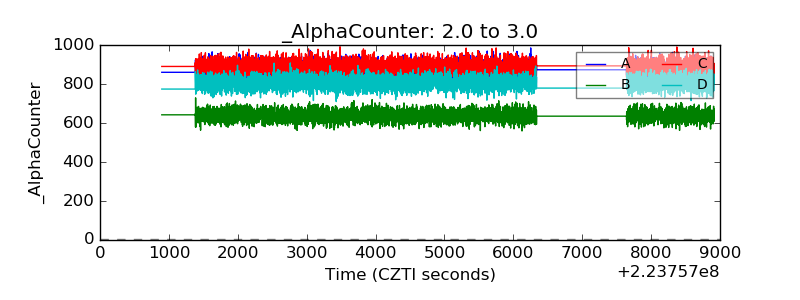 |
| _CPM_Rate | 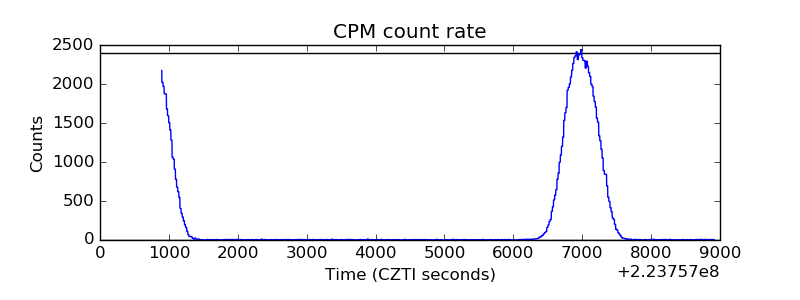 |
| CZT Counter | 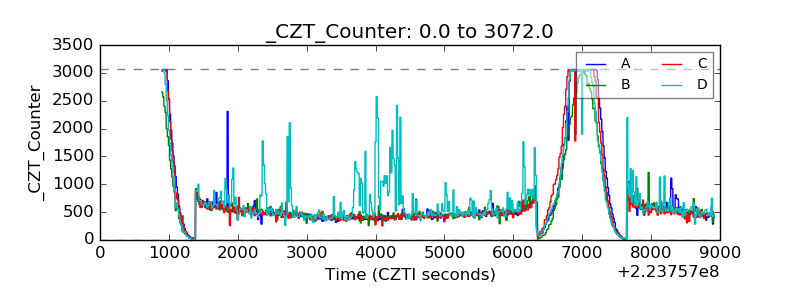 |
| +2.5 Volts monitor |  |
| +5 Volts monitor |  |
| _ROLL_ROT | 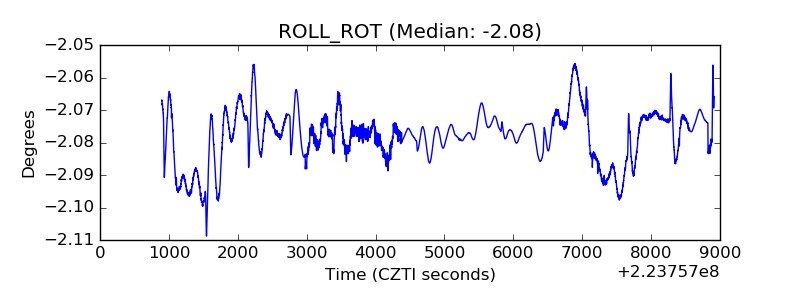 |
| _Roll_DEC | 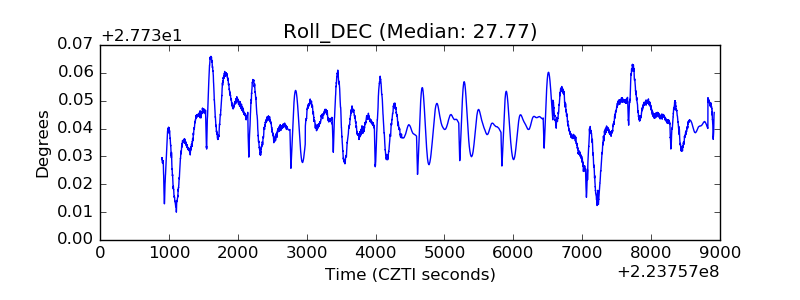 |
| _Roll_RA | 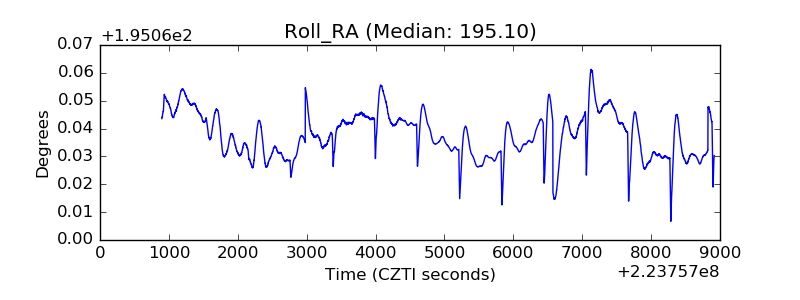 |
| Veto Counter | 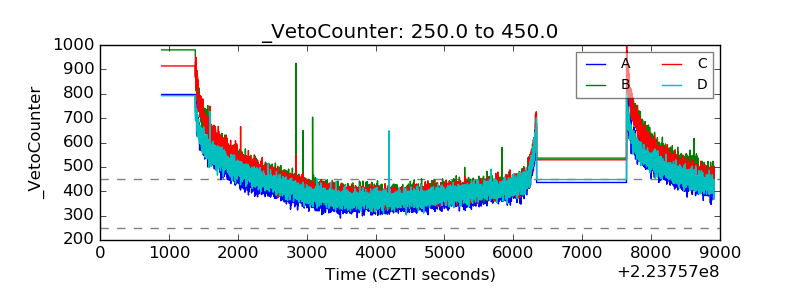 |