| Param | Original file | Final file |
|---|---|---|
| Filename | modeM0/AS1G06_137T02_9000001002_07309cztM0_level2.evt | modeM0/AS1G06_137T02_9000001002_07309cztM0_level2_quad_clean.evt |
| Size (bytes) | 520,646,400 | 96,739,200 |
| Size | 496.5 MB | 92.3 MB |
| Events in quadrant A | 4,690,538 | 562,231 |
| Events in quadrant B | 3,443,591 | 661,049 |
| Events in quadrant C | 3,210,040 | 644,373 |
| Events in quadrant D | 3,974,885 | 600,870 |
| Mode M0 | |||
|---|---|---|---|
| Quadrant | BADHDUFLAG | Total packets | Discarded packets |
| A | 0 | 18412 | 3 |
| B | 0 | 14680 | 2 |
| C | 0 | 13948 | 2 |
| D | 0 | 16268 | 2 |
| Mode SS | |||
|---|---|---|---|
| Quadrant | BADHDUFLAG | Total packets | Discarded packets |
| A | 0 | 136 | 0 |
| B | 0 | 136 | 0 |
| C | 0 | 136 | 0 |
| D | 0 | 136 | 0 |
| Mode M9 | |||
|---|---|---|---|
| Quadrant | BADHDUFLAG | Total packets | Discarded packets |
| A | 0 | 26 | 0 |
| B | 0 | 26 | 0 |
| C | 0 | 26 | 0 |
| D | 0 | 26 | 0 |
| Quadrant | Total seconds | Saturated seconds | Saturation percentage |
|---|---|---|---|
| A | 6612 | 678 | 10.254083% |
| B | 6612 | 96 | 1.451906% |
| C | 6612 | 68 | 1.028433% |
| D | 6612 | 225 | 3.402904% |
Noise dominated data is calculated using 1-second bins in cleaned event files. If a bin has >2000 counts, and if more than 50% of those come from <1% of pixels, then it is considered to be noise-dominated and hence unusable.
| Quadrant | # 1 sec bins | Bins with >0 counts | Bins with >2000 counts | High rate bins dominated by noise | Noise dominated (total time) | Noise dominated (detector-on time) | Marked lightcurve |
|---|---|---|---|---|---|---|---|
| A | 9253 | 6614 | 590 | 590 | 6.38% | 8.92% | 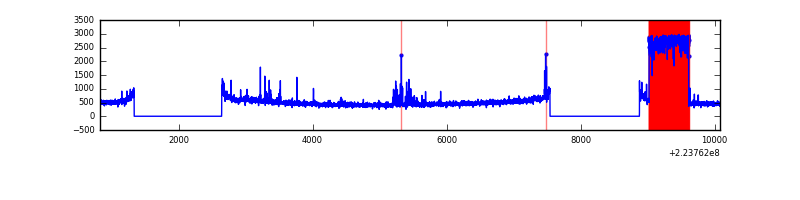 |
| B | 9253 | 6614 | 2 | 2 | 0.02% | 0.03% | 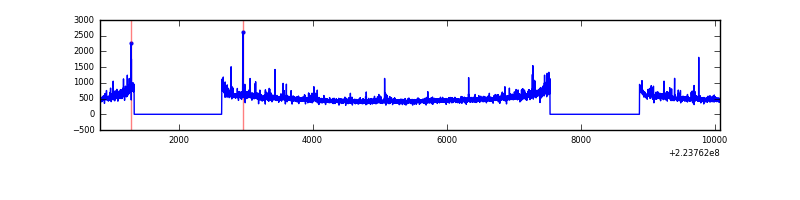 |
| C | 9253 | 6614 | 9 | 9 | 0.10% | 0.14% | 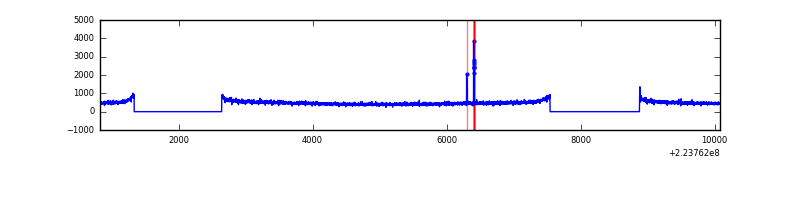 |
| D | 9253 | 6613 | 106 | 106 | 1.15% | 1.60% | 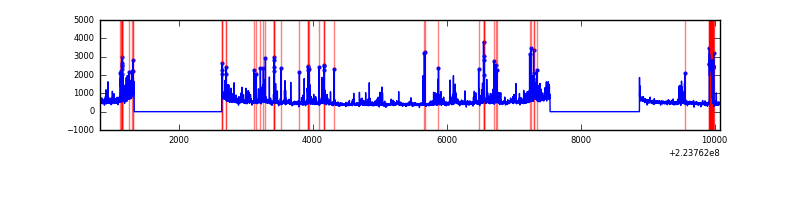 |
Top three noisy pixels from each quadrant. If the there are fewer than three noisy pixels in the level2.evt file, extra rows are filled as -1
| Pixel properties | Quadrant properties | ||||||
|---|---|---|---|---|---|---|---|
| Quadrant | DetID | PixID | Counts | Sigma | Mean | Median | Sigma |
| A | 15 | 234 | 1543395 | 9932.54 | 766 | 751 | 155.3 |
| A | 8 | 15 | 145466 | 931.77 | 766 | 751 | 155.3 |
| A | 13 | 170 | 40080 | 253.23 | 766 | 751 | 155.3 |
| B | 0 | 214 | 82935 | 516.53 | 838 | 819 | 159.0 |
| B | 4 | 81 | 76046 | 473.19 | 838 | 819 | 159.0 |
| B | 12 | 111 | 15885 | 94.77 | 838 | 819 | 159.0 |
| C | 10 | 22 | 38527 | 201.83 | 811 | 816 | 186.8 |
| C | 13 | 61 | 6227 | 28.96 | 811 | 816 | 186.8 |
| C | 9 | 68 | 4629 | 20.41 | 811 | 816 | 186.8 |
| D | 2 | 216 | 468106 | 2401.33 | 791 | 768 | 194.6 |
| D | 1 | 52 | 172725 | 883.57 | 791 | 768 | 194.6 |
| D | 14 | 34 | 98417 | 501.75 | 791 | 768 | 194.6 |
Histogram calculated using DETX and DETY for each event in the final _common_clean file
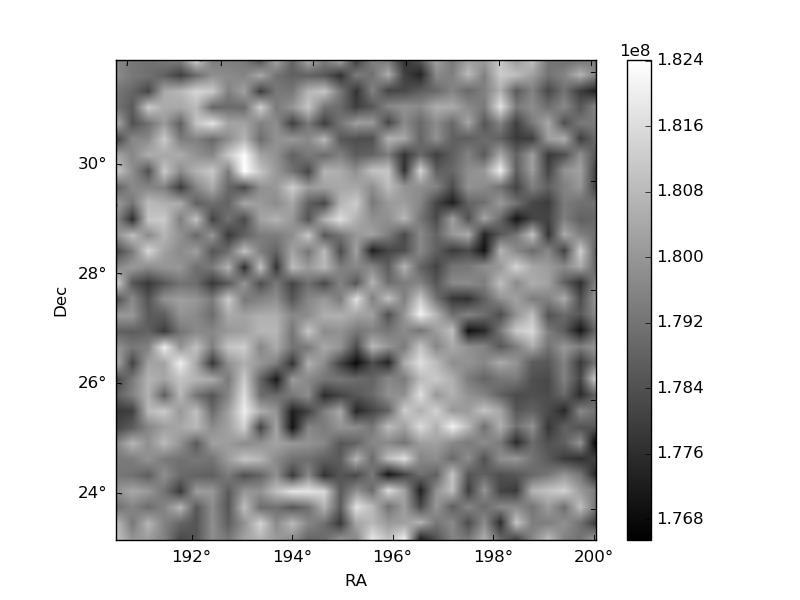
| Quadrant A | 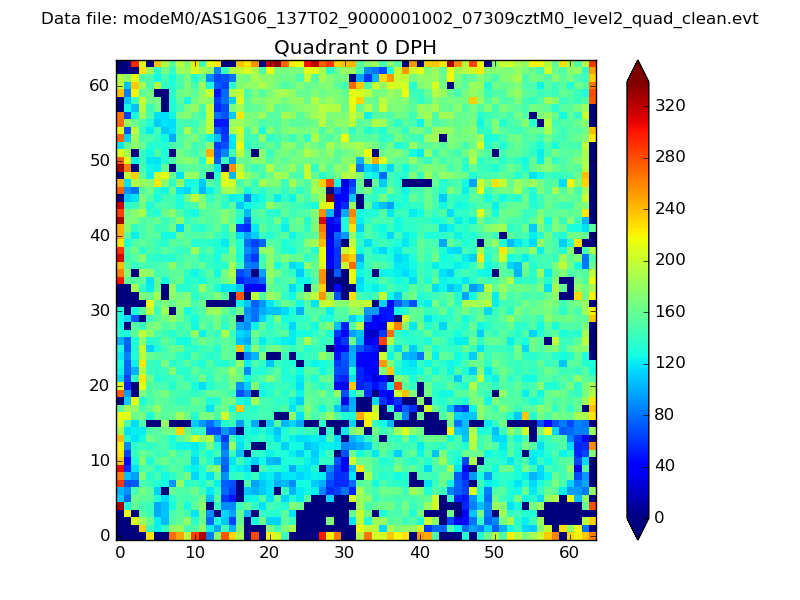 |
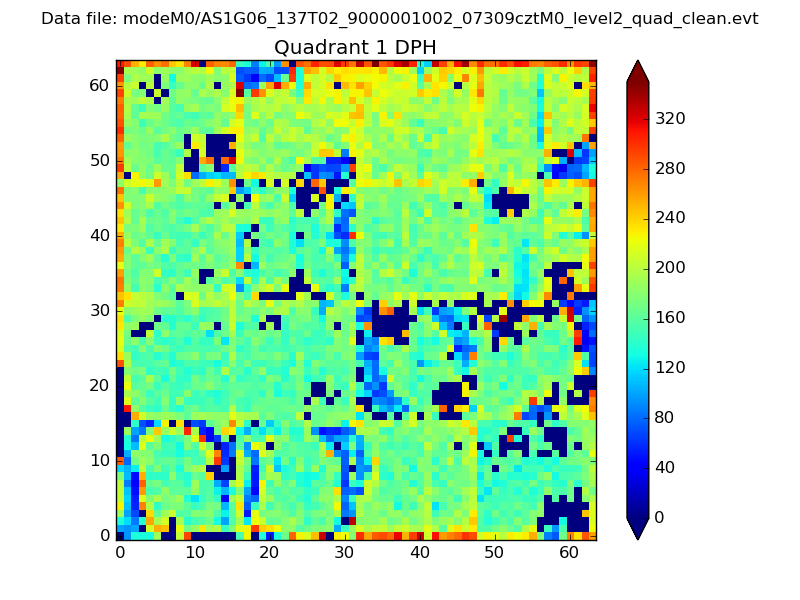 |
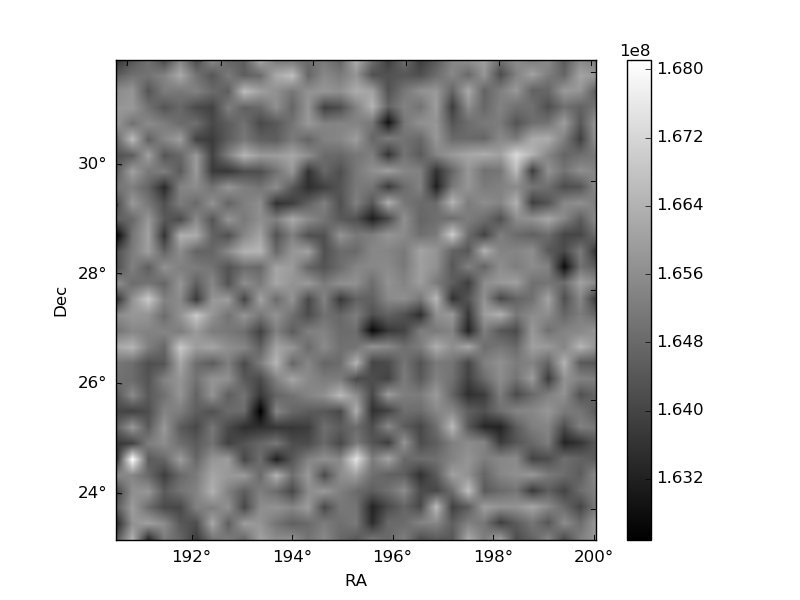
Quadrant B |
|---|---|---|---|
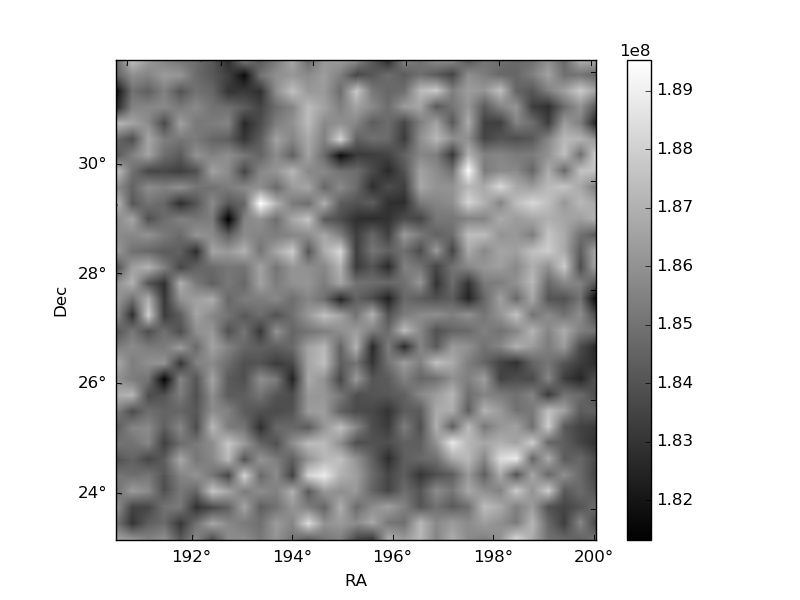
| Quadrant D | 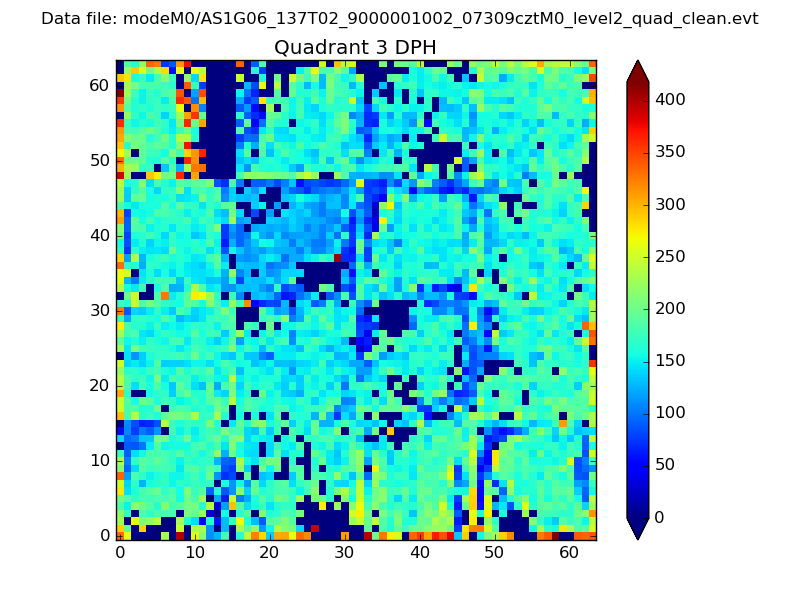 |
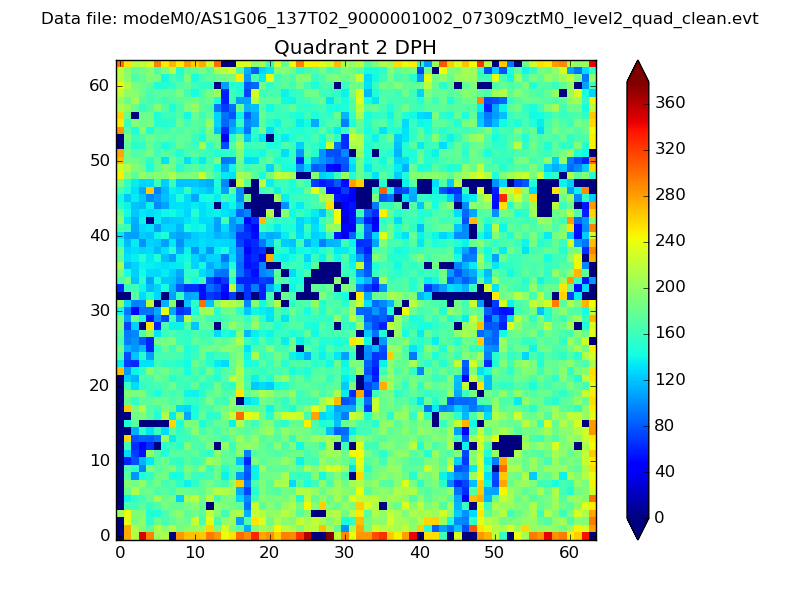 |
Quadrant C |
| Plot type | Count rate plots | Images |
|---|---|---|
| Comparison with Poisson distribution Blue bars denote a histogram of data divided into 1 sec bins. Red curve is a Poisson curve with rate = median count rate of data. |
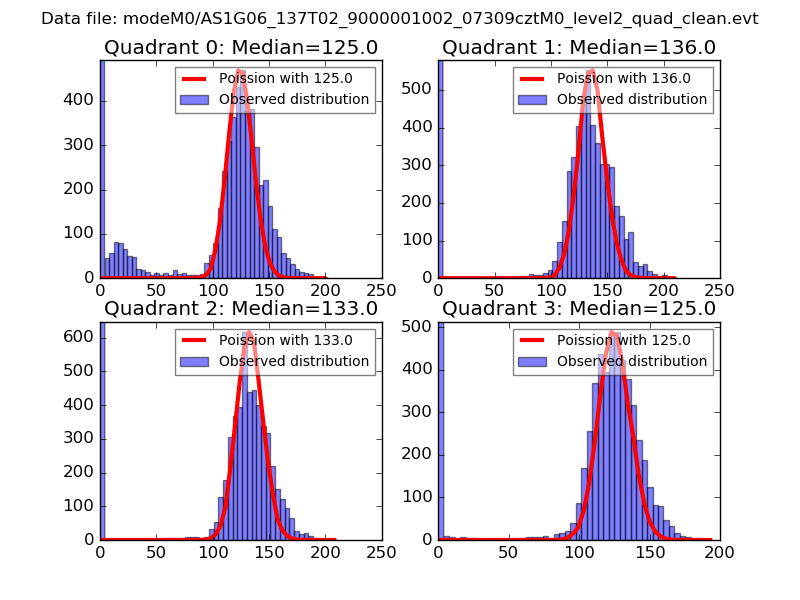 |
 |
| Quadrant-wise count rates Data is divided into 100 sec bins |
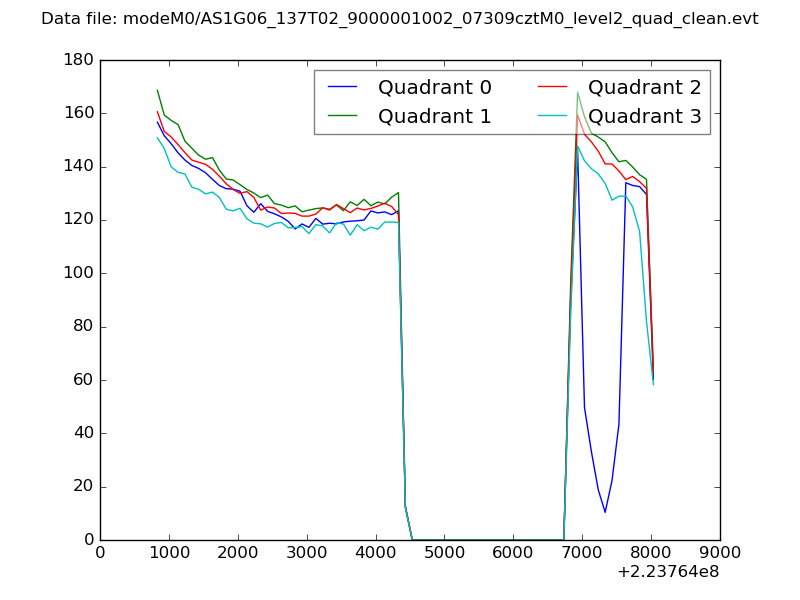 |
|
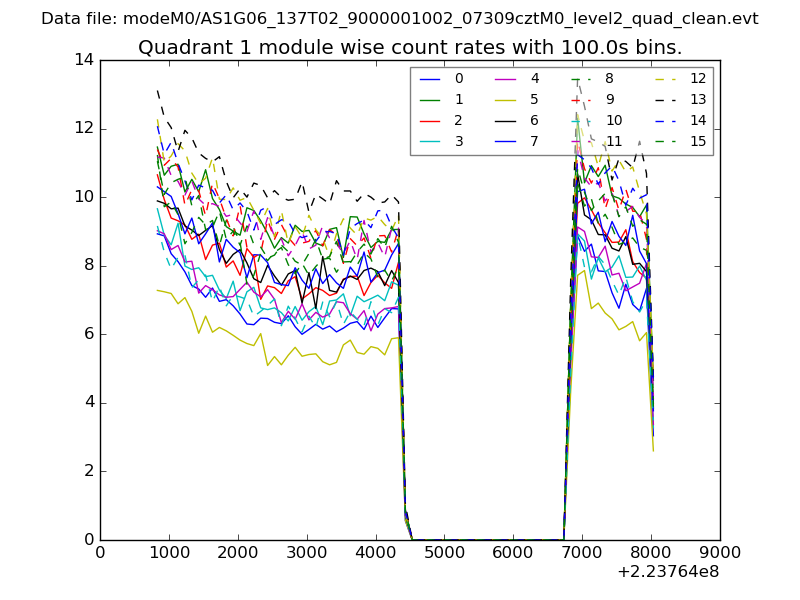
| Module-wise count rates for Quadrant A Data is divided into 100 sec bins |
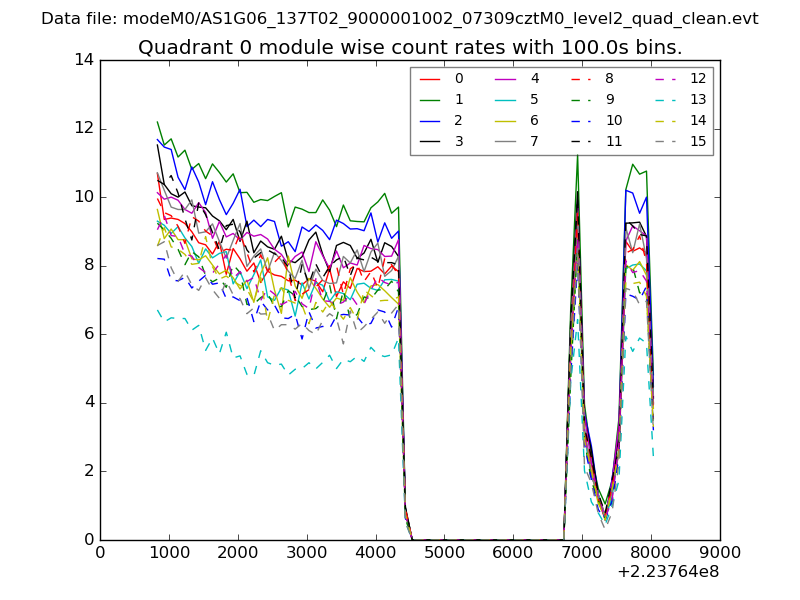 |
 |
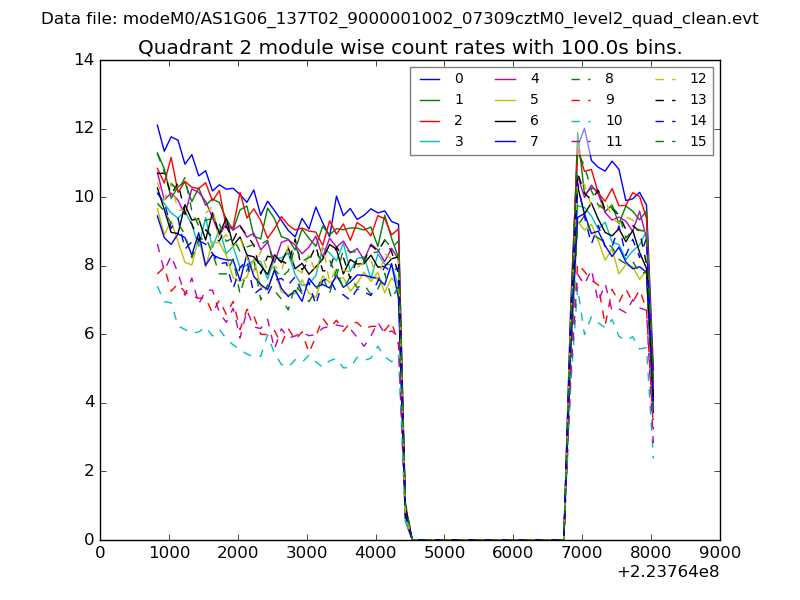
| Module-wise count rates for Quadrant B Data is divided into 100 sec bins |
 |
 |
| Module-wise count rates for Quadrant C Data is divided into 100 sec bins |
 |
 |
| Module-wise count rates for Quadrant D Data is divided into 100 sec bins |
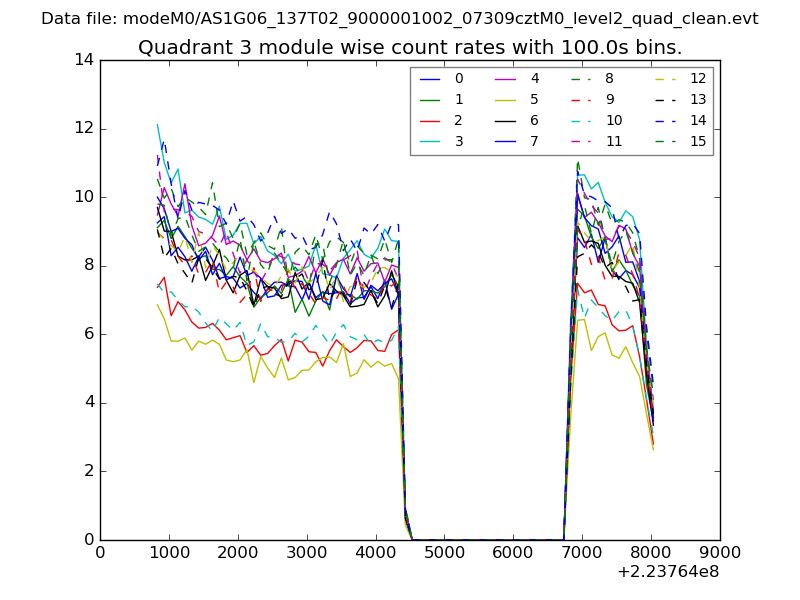 |
 |
| Parameter | Plot |
|---|---|
| CZT HV Monitor | 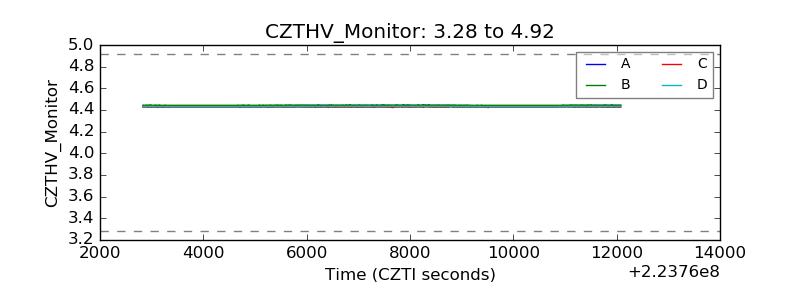 |
| D_VDD | 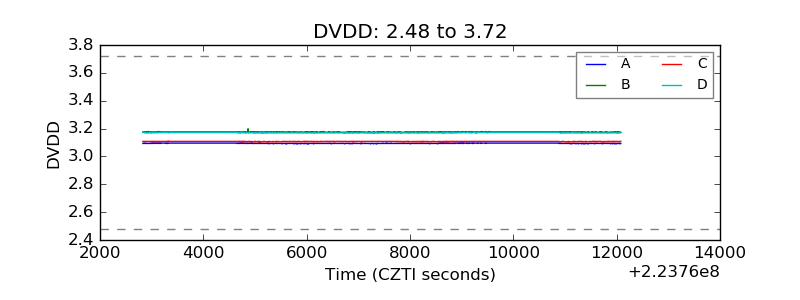 |
| Temperature 1 | 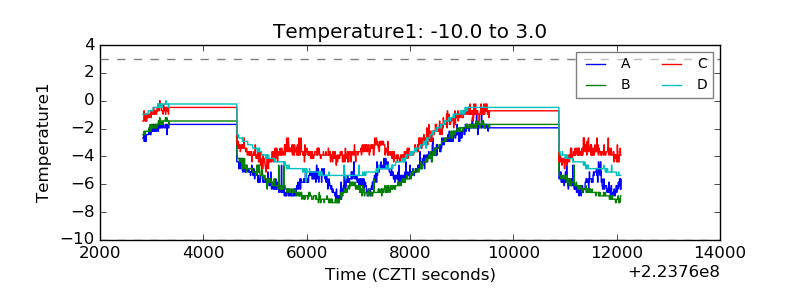 |
| Veto HV Monitor |  |
| Veto LLD | 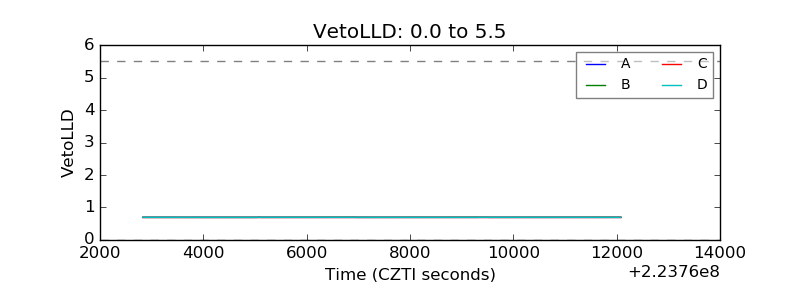 |
| Alpha Counter | 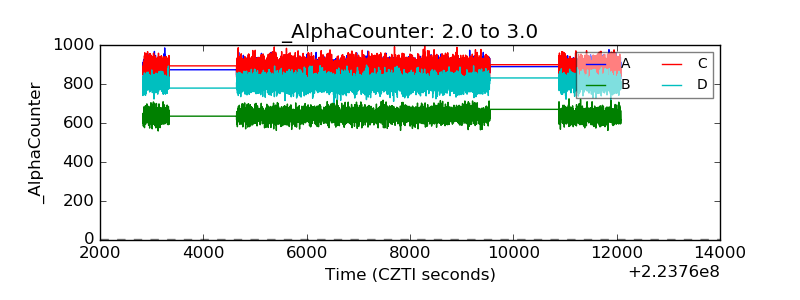 |
| _CPM_Rate | 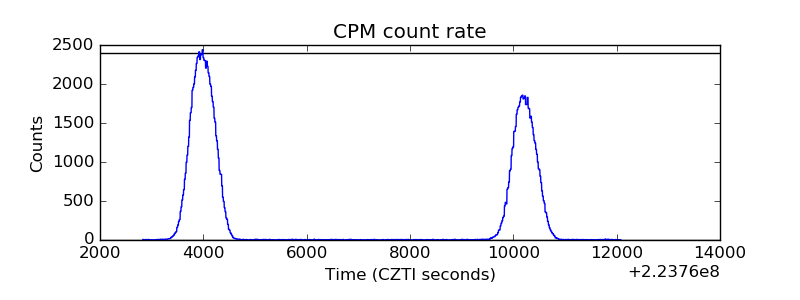 |
| CZT Counter | 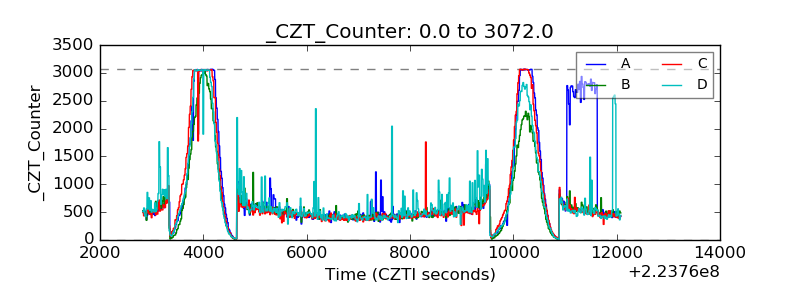 |
| +2.5 Volts monitor |  |
| +5 Volts monitor |  |
| _ROLL_ROT | 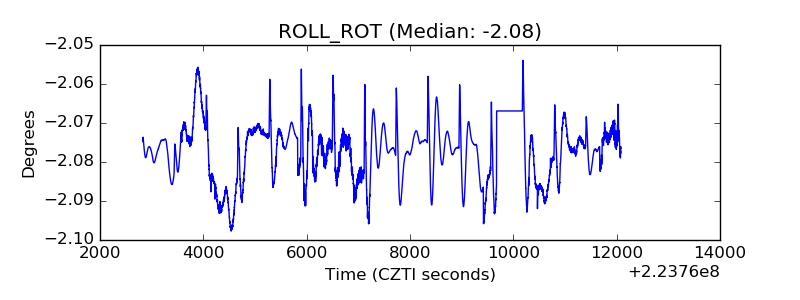 |
| _Roll_DEC | 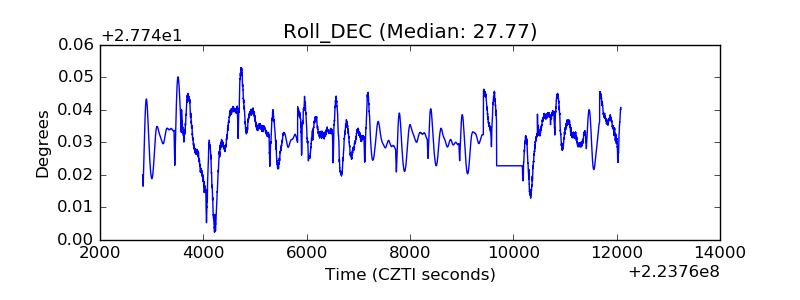 |
| _Roll_RA |  |
| Veto Counter | 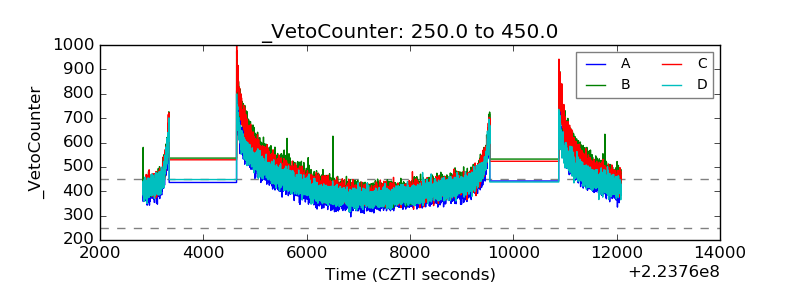 |