| Param | Original file | Final file |
|---|---|---|
| Filename | modeM0/AS1G06_137T02_9000001002_07310cztM0_level2.evt | modeM0/AS1G06_137T02_9000001002_07310cztM0_level2_quad_clean.evt |
| Size (bytes) | 479,448,000 | 92,528,640 |
| Size | 457.2 MB | 88.2 MB |
| Events in quadrant A | 4,404,883 | 538,319 |
| Events in quadrant B | 3,116,095 | 632,285 |
| Events in quadrant C | 2,873,483 | 620,053 |
| Events in quadrant D | 3,701,480 | 575,550 |
| Mode M0 | |||
|---|---|---|---|
| Quadrant | BADHDUFLAG | Total packets | Discarded packets |
| A | 0 | 17402 | 3 |
| B | 0 | 13532 | 2 |
| C | 0 | 12859 | 2 |
| D | 0 | 15548 | 2 |
| Mode SS | |||
|---|---|---|---|
| Quadrant | BADHDUFLAG | Total packets | Discarded packets |
| A | 0 | 128 | 0 |
| B | 0 | 128 | 0 |
| C | 0 | 128 | 0 |
| D | 0 | 128 | 0 |
| Mode M9 | |||
|---|---|---|---|
| Quadrant | BADHDUFLAG | Total packets | Discarded packets |
| A | 0 | 19 | 0 |
| B | 0 | 19 | 0 |
| C | 0 | 19 | 0 |
| D | 0 | 20 | 0 |
| Quadrant | Total seconds | Saturated seconds | Saturation percentage |
|---|---|---|---|
| A | 6238 | 613 | 9.826868% |
| B | 6238 | 36 | 0.577108% |
| C | 6238 | 12 | 0.192369% |
| D | 6238 | 132 | 2.116063% |
Noise dominated data is calculated using 1-second bins in cleaned event files. If a bin has >2000 counts, and if more than 50% of those come from <1% of pixels, then it is considered to be noise-dominated and hence unusable.
| Quadrant | # 1 sec bins | Bins with >0 counts | Bins with >2000 counts | High rate bins dominated by noise | Noise dominated (total time) | Noise dominated (detector-on time) | Marked lightcurve |
|---|---|---|---|---|---|---|---|
| A | 7563 | 6239 | 589 | 589 | 7.79% | 9.44% | 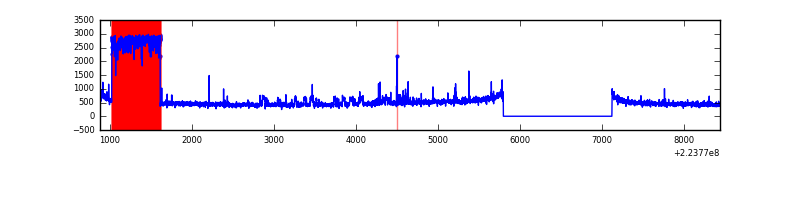 |
| B | 7563 | 6239 | 0 | 0 | 0.00% | 0.00% | 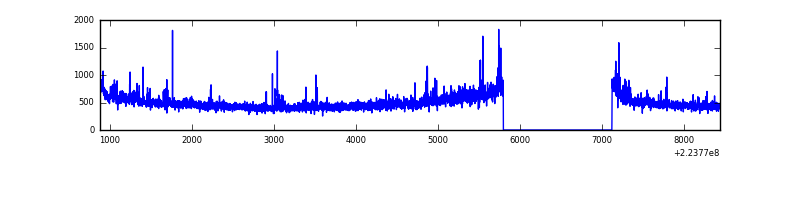 |
| C | 7563 | 6239 | 0 | 0 | 0.00% | 0.00% | 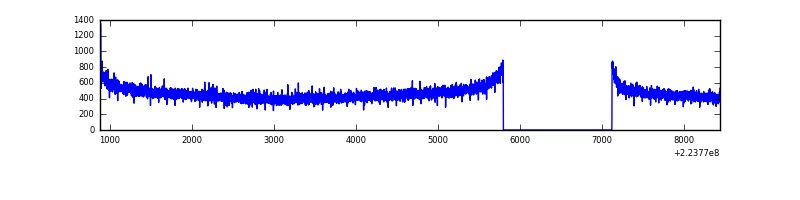 |
| D | 7563 | 6239 | 82 | 82 | 1.08% | 1.31% | 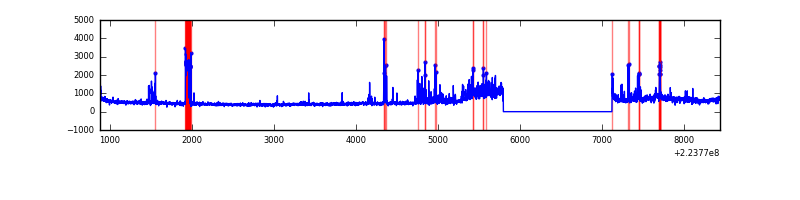 |
Top three noisy pixels from each quadrant. If the there are fewer than three noisy pixels in the level2.evt file, extra rows are filled as -1
| Pixel properties | Quadrant properties | ||||||
|---|---|---|---|---|---|---|---|
| Quadrant | DetID | PixID | Counts | Sigma | Mean | Median | Sigma |
| A | 15 | 234 | 1612271 | 11510.27 | 689 | 674 | 140.0 |
| A | 8 | 15 | 78433 | 555.37 | 689 | 674 | 140.0 |
| A | 13 | 170 | 54473 | 384.24 | 689 | 674 | 140.0 |
| B | 0 | 214 | 64023 | 439.17 | 762 | 744 | 144.1 |
| B | 4 | 81 | 62834 | 430.91 | 762 | 744 | 144.1 |
| B | 12 | 111 | 14898 | 98.23 | 762 | 744 | 144.1 |
| C | 13 | 61 | 5649 | 28.96 | 735 | 739 | 169.5 |
| C | 12 | 4 | 3429 | 15.86 | 735 | 739 | 169.5 |
| C | 10 | 22 | 3052 | 13.64 | 735 | 739 | 169.5 |
| D | 1 | 20 | 484477 | 2737.49 | 716 | 695 | 176.7 |
| D | 2 | 216 | 175751 | 990.56 | 716 | 695 | 176.7 |
| D | 1 | 52 | 166682 | 939.24 | 716 | 695 | 176.7 |
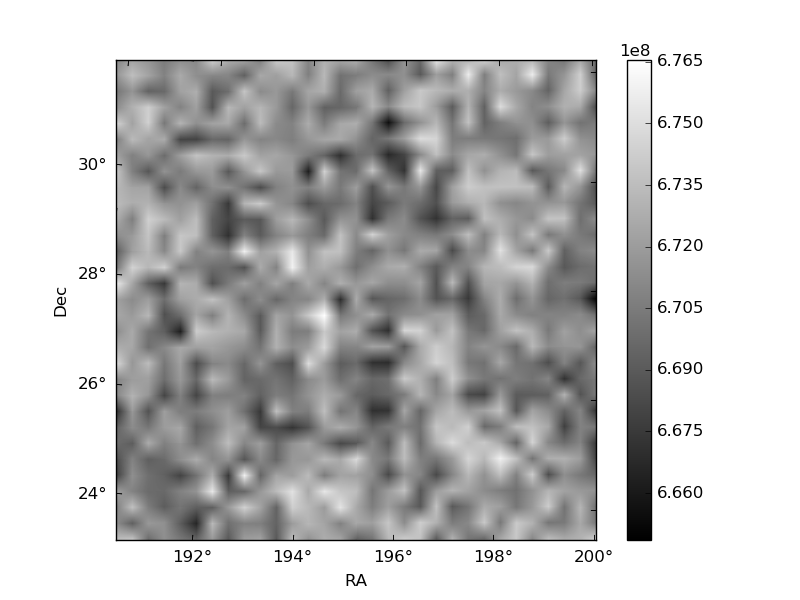
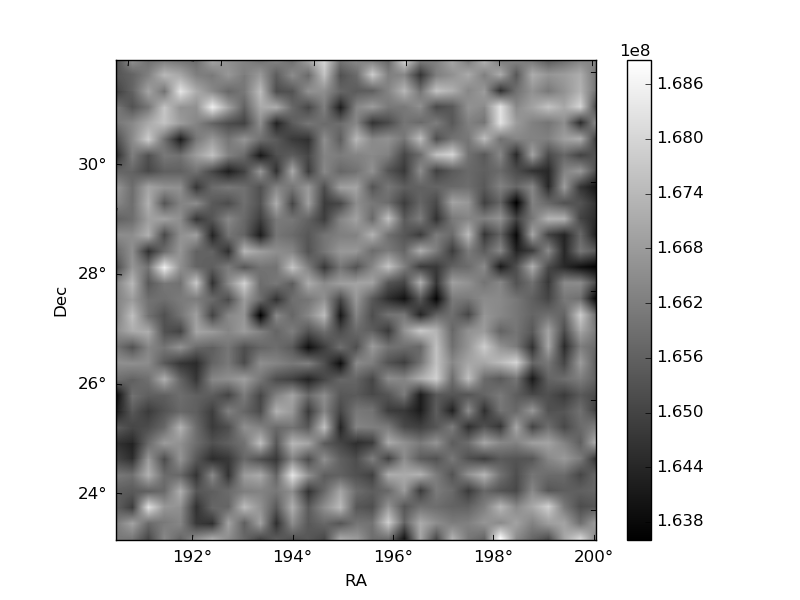
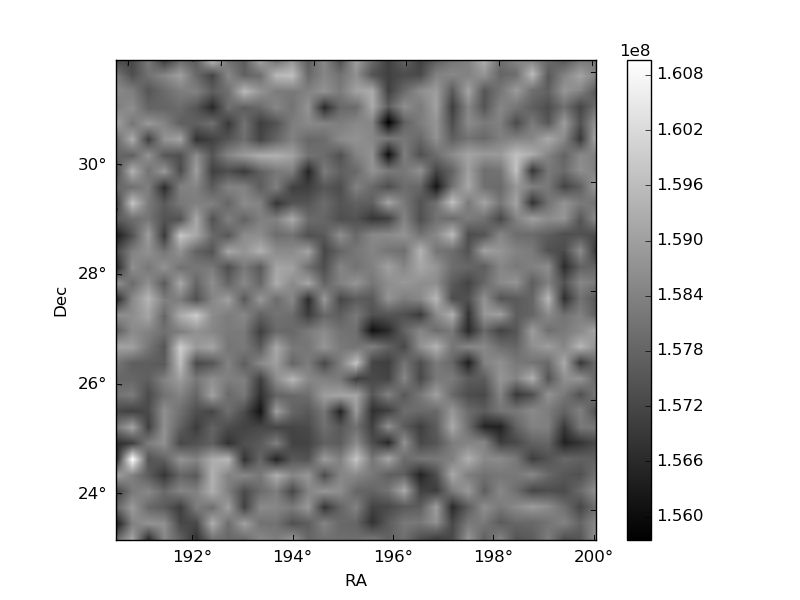
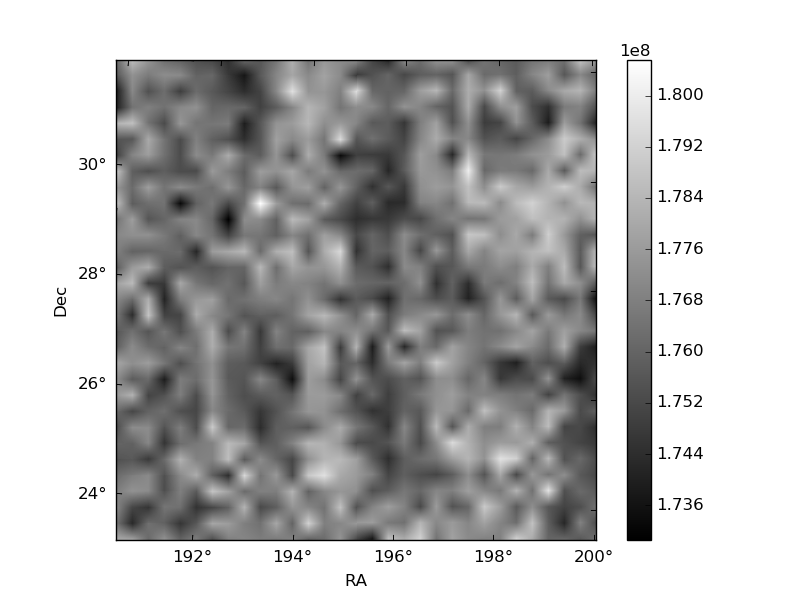
Histogram calculated using DETX and DETY for each event in the final _common_clean file
| Quadrant A | 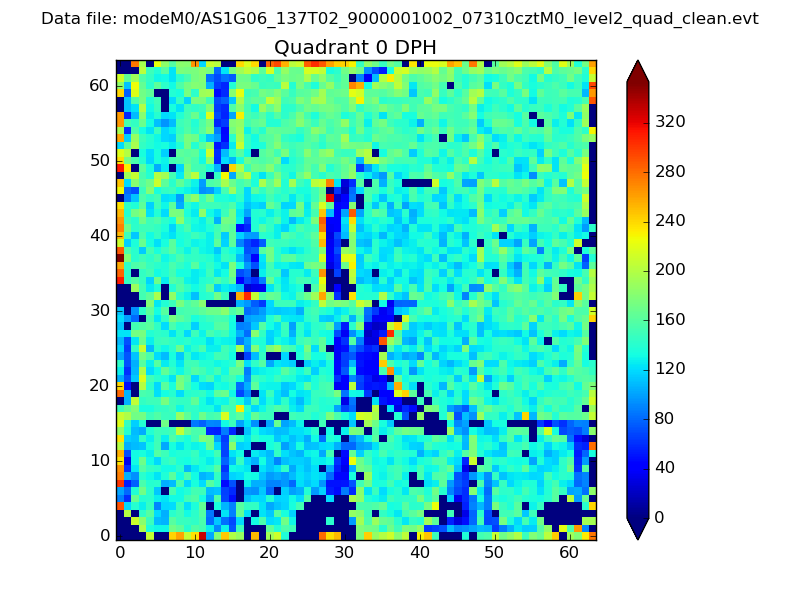 |
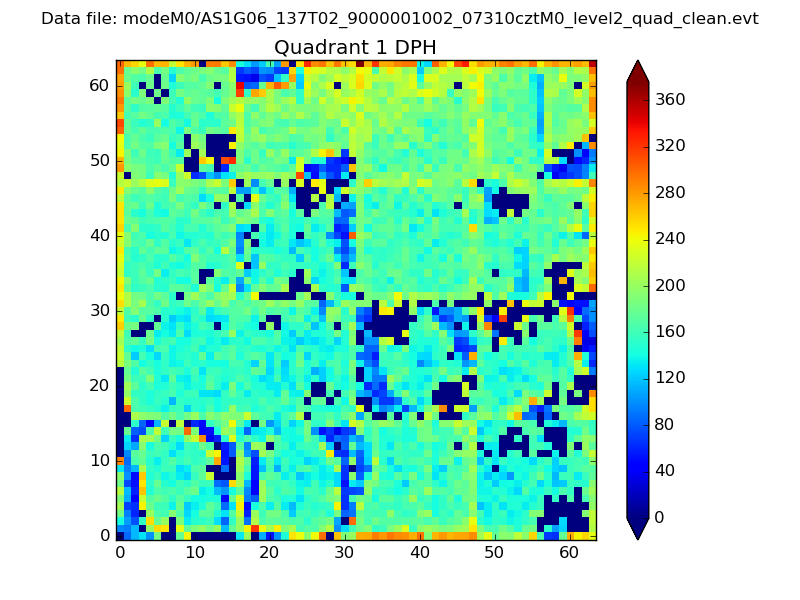 |
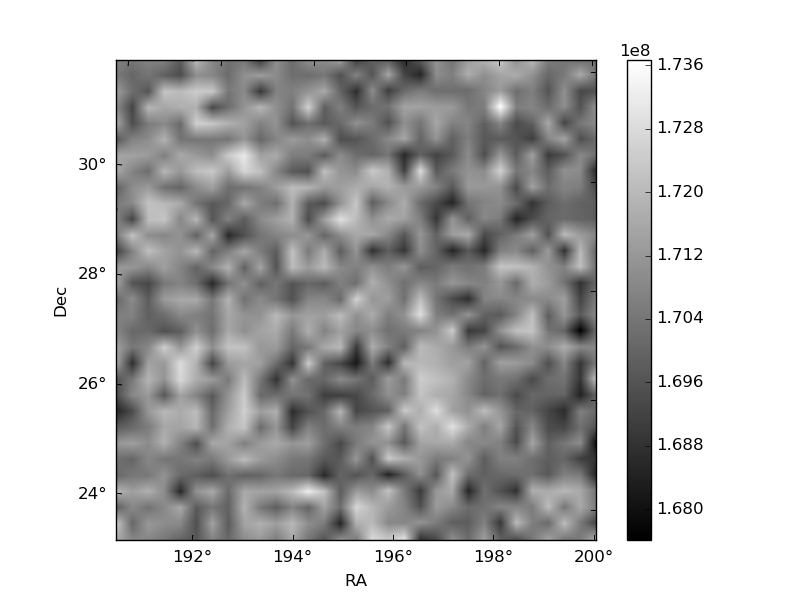
Quadrant B |
|---|---|---|---|
| Quadrant D | 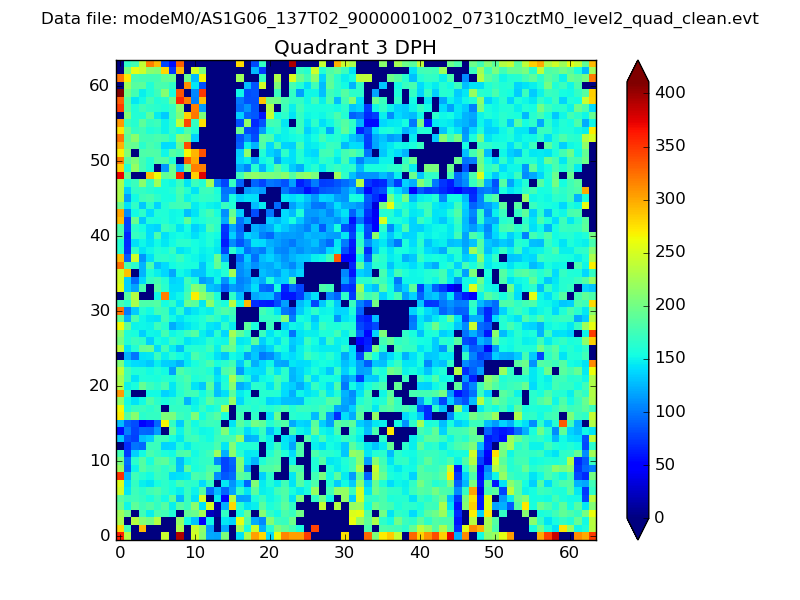 |
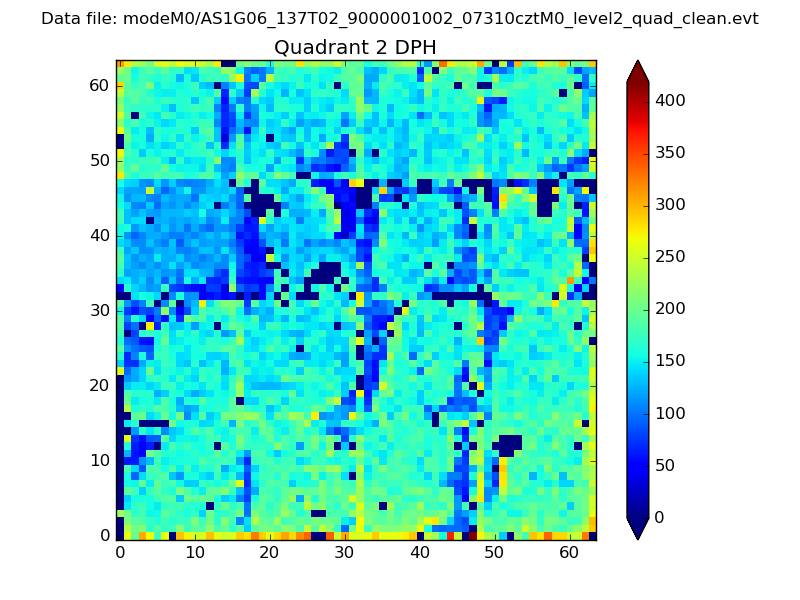 |
Quadrant C |
| Plot type | Count rate plots | Images |
|---|---|---|
| Comparison with Poisson distribution Blue bars denote a histogram of data divided into 1 sec bins. Red curve is a Poisson curve with rate = median count rate of data. |
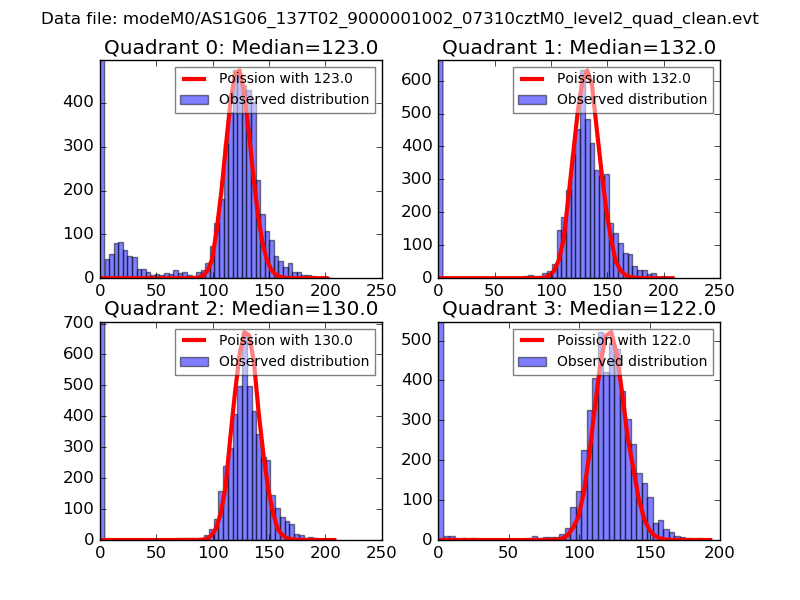 |
 |
| Quadrant-wise count rates Data is divided into 100 sec bins |
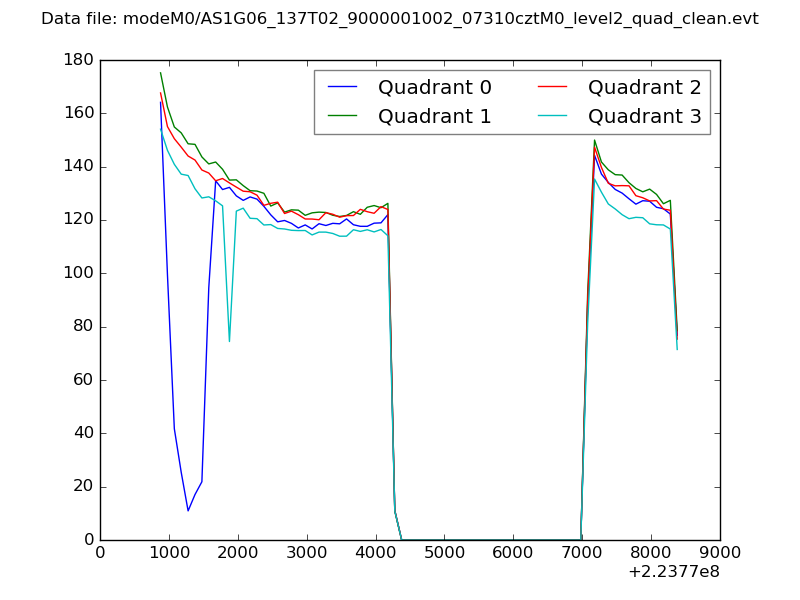 |
|
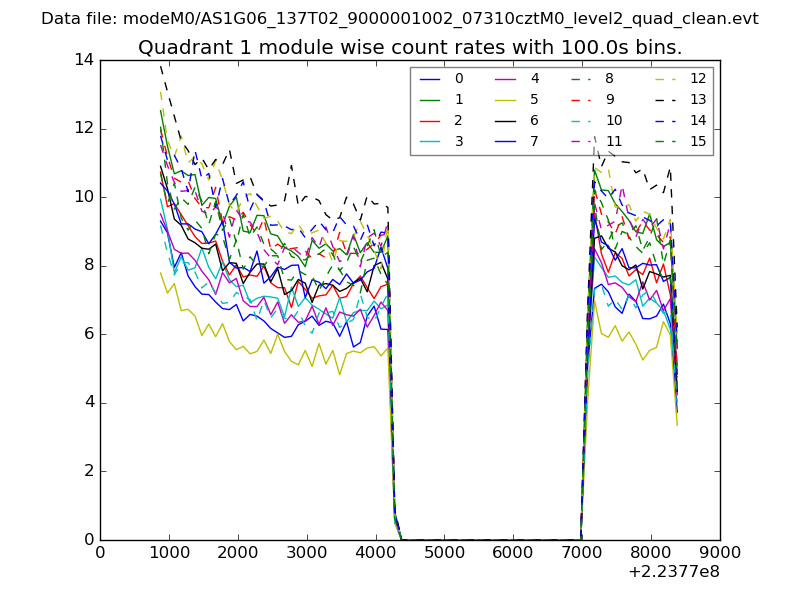
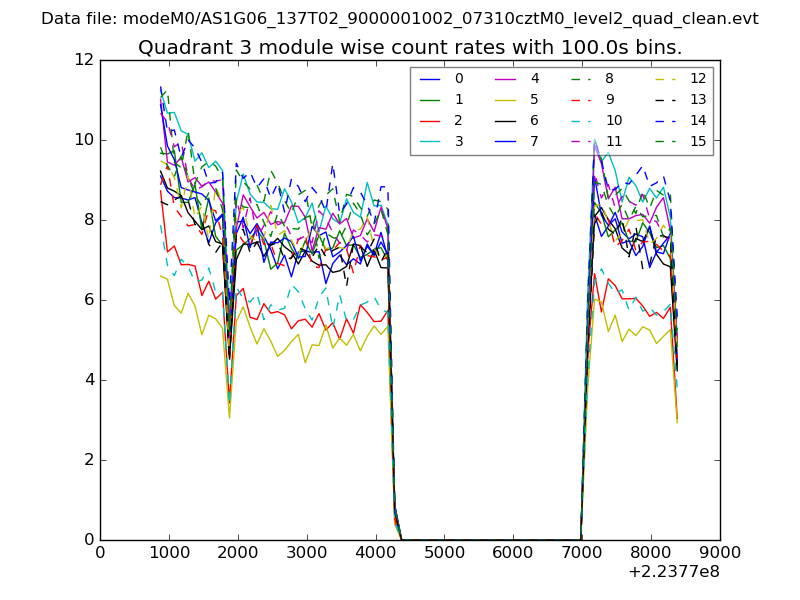
| Module-wise count rates for Quadrant A Data is divided into 100 sec bins |
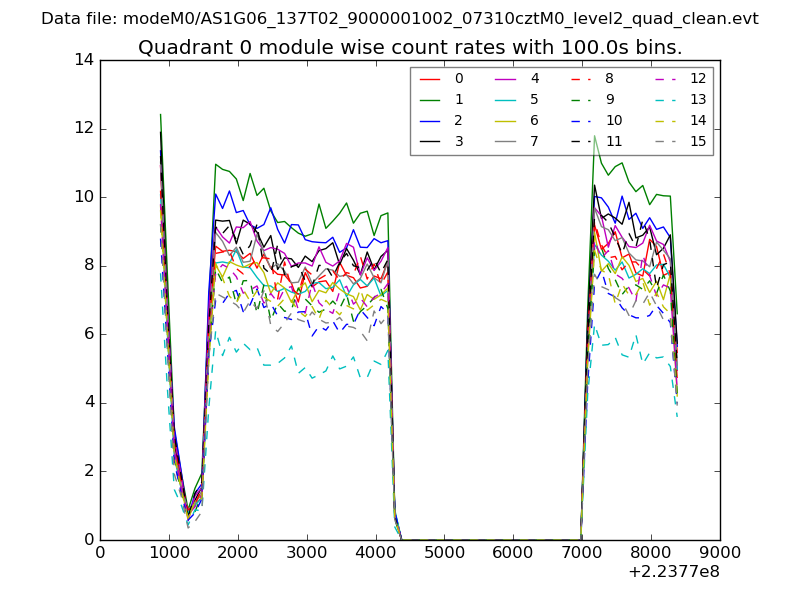 |
 |
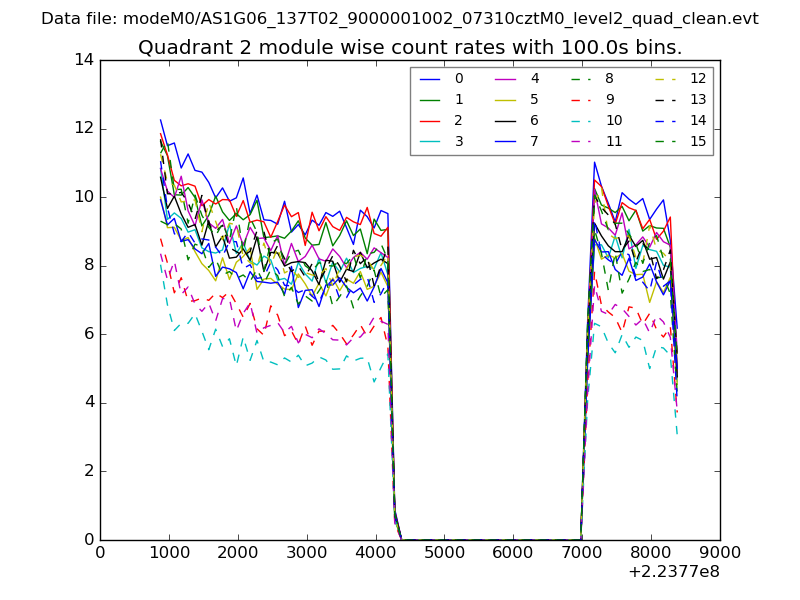
| Module-wise count rates for Quadrant B Data is divided into 100 sec bins |
 |
 |
| Module-wise count rates for Quadrant C Data is divided into 100 sec bins |
 |
 |
| Module-wise count rates for Quadrant D Data is divided into 100 sec bins |
 |
 |
| Parameter | Plot |
|---|---|
| CZT HV Monitor | 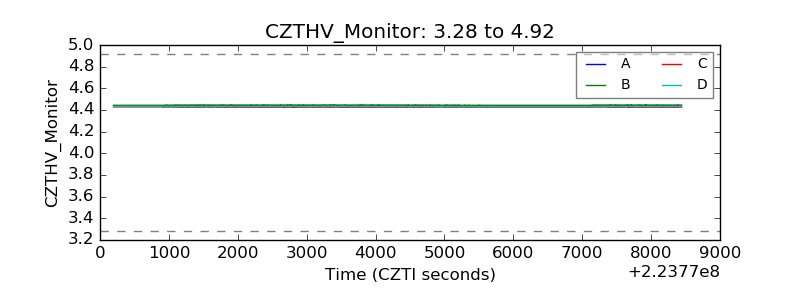 |
| D_VDD | 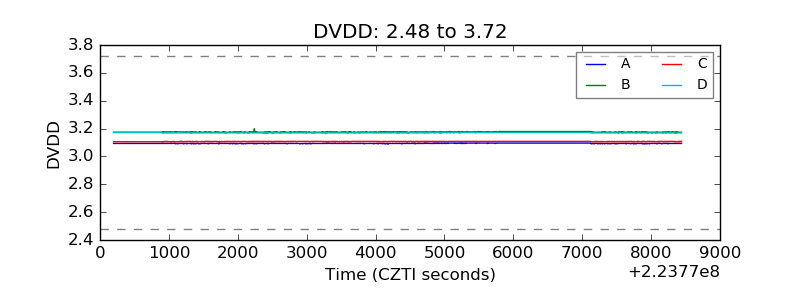 |
| Temperature 1 | 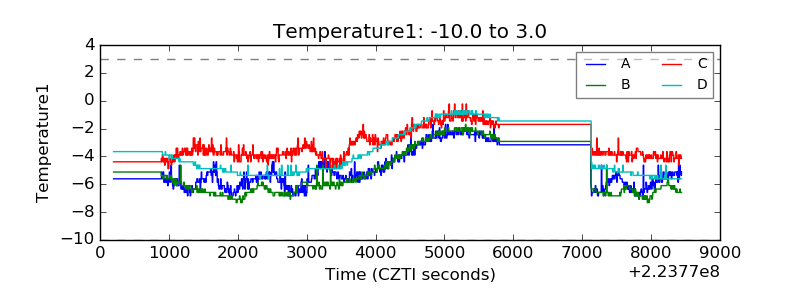 |
| Veto HV Monitor | 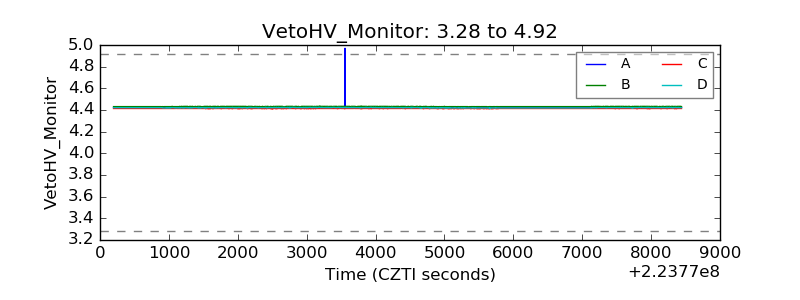 |
| Veto LLD | 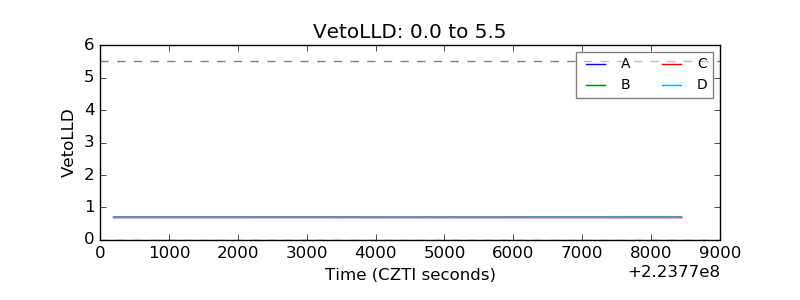 |
| Alpha Counter | 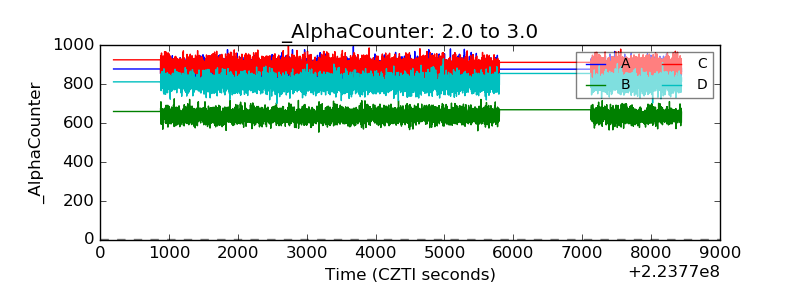 |
| _CPM_Rate | 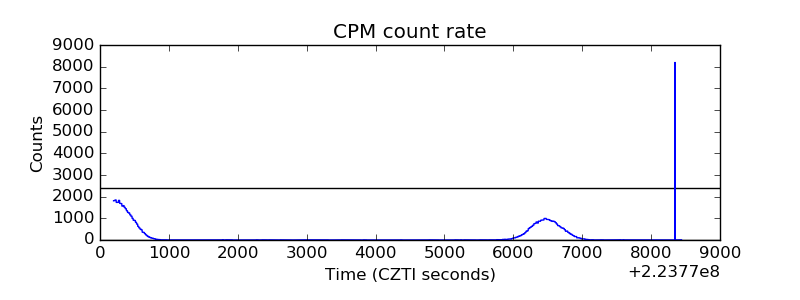 |
| CZT Counter | 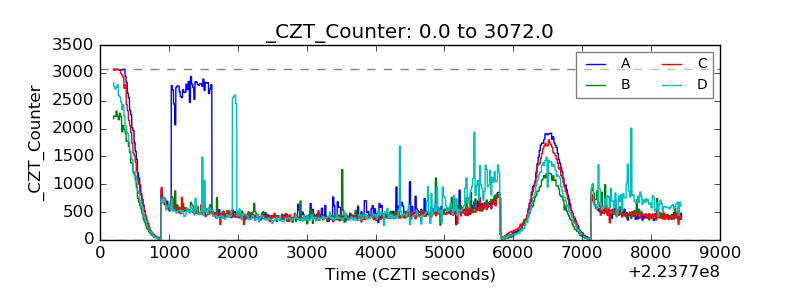 |
| +2.5 Volts monitor |  |
| +5 Volts monitor |  |
| _ROLL_ROT | 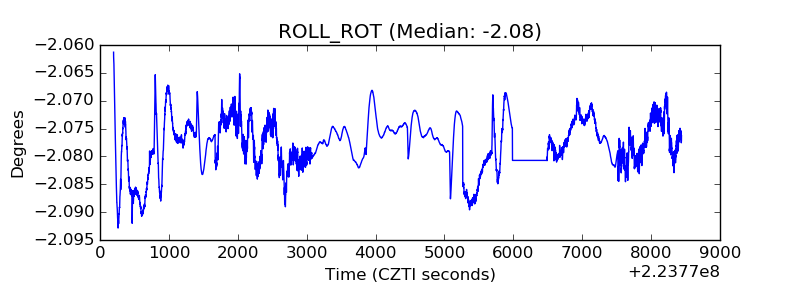 |
| _Roll_DEC |  |
| _Roll_RA | 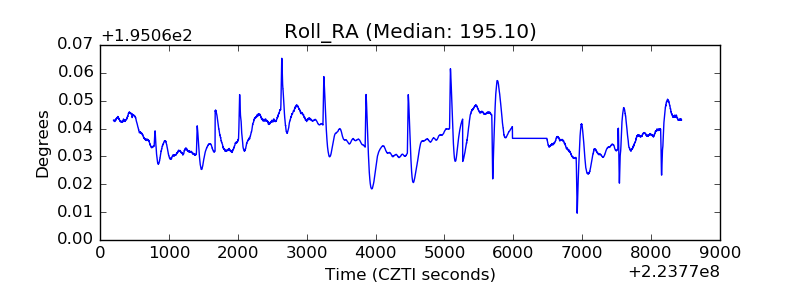 |
| Veto Counter | 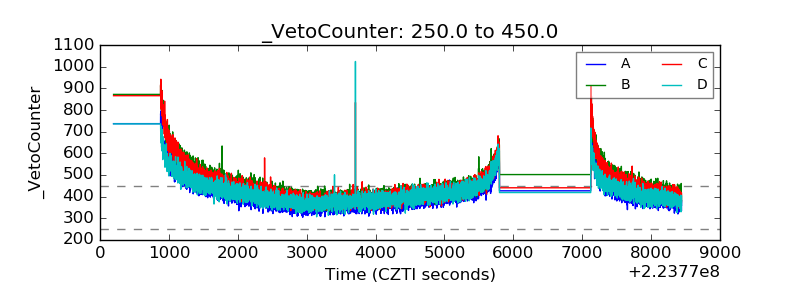 |