| Param | Original file | Final file |
|---|---|---|
| Filename | modeM0/AS1G06_137T02_9000001002_07311cztM0_level2.evt | modeM0/AS1G06_137T02_9000001002_07311cztM0_level2_quad_clean.evt |
| Size (bytes) | 483,428,160 | 91,624,320 |
| Size | 461.0 MB | 87.4 MB |
| Events in quadrant A | 3,440,777 | 572,253 |
| Events in quadrant B | 3,360,075 | 593,536 |
| Events in quadrant C | 3,058,470 | 584,699 |
| Events in quadrant D | 4,317,051 | 547,640 |
| Mode M0 | |||
|---|---|---|---|
| Quadrant | BADHDUFLAG | Total packets | Discarded packets |
| A | 0 | 14942 | 3 |
| B | 0 | 14758 | 2 |
| C | 0 | 14039 | 2 |
| D | 0 | 17479 | 2 |
| Mode SS | |||
|---|---|---|---|
| Quadrant | BADHDUFLAG | Total packets | Discarded packets |
| A | 0 | 138 | 0 |
| B | 0 | 138 | 0 |
| C | 0 | 138 | 0 |
| D | 0 | 138 | 0 |
| Mode M9 | |||
|---|---|---|---|
| Quadrant | BADHDUFLAG | Total packets | Discarded packets |
| A | 0 | 17 | 0 |
| B | 0 | 17 | 0 |
| C | 0 | 17 | 0 |
| D | 0 | 18 | 0 |
| Quadrant | Total seconds | Saturated seconds | Saturation percentage |
|---|---|---|---|
| A | 6841 | 36 | 0.526239% |
| B | 6841 | 56 | 0.818594% |
| C | 6841 | 17 | 0.248502% |
| D | 6841 | 61 | 0.891683% |
Noise dominated data is calculated using 1-second bins in cleaned event files. If a bin has >2000 counts, and if more than 50% of those come from <1% of pixels, then it is considered to be noise-dominated and hence unusable.
| Quadrant | # 1 sec bins | Bins with >0 counts | Bins with >2000 counts | High rate bins dominated by noise | Noise dominated (total time) | Noise dominated (detector-on time) | Marked lightcurve |
|---|---|---|---|---|---|---|---|
| A | 7926 | 6842 | 2 | 2 | 0.03% | 0.03% | 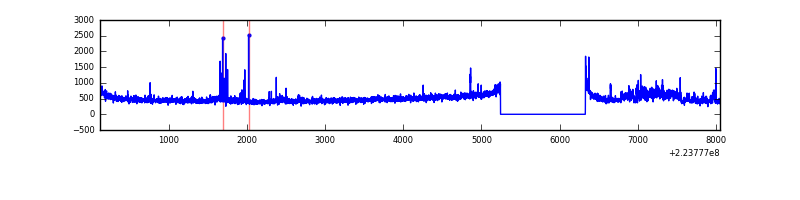 |
| B | 7926 | 6842 | 6 | 6 | 0.08% | 0.09% | 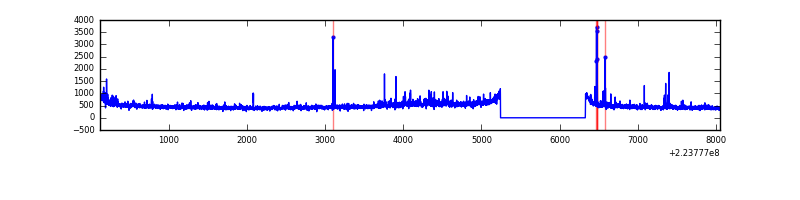 |
| C | 7926 | 6842 | 0 | 0 | 0.00% | 0.00% |  |
| D | 7926 | 6842 | 42 | 42 | 0.53% | 0.61% | 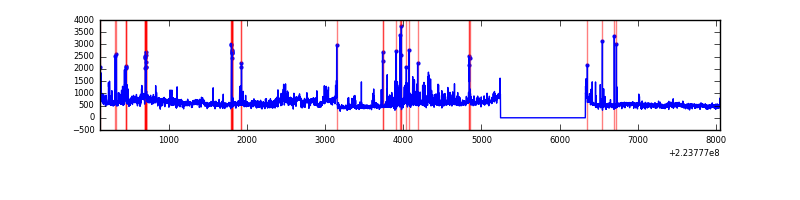 |
Top three noisy pixels from each quadrant. If the there are fewer than three noisy pixels in the level2.evt file, extra rows are filled as -1
| Pixel properties | Quadrant properties | ||||||
|---|---|---|---|---|---|---|---|
| Quadrant | DetID | PixID | Counts | Sigma | Mean | Median | Sigma |
| A | 8 | 15 | 267954 | 1638.81 | 801 | 785 | 163.0 |
| A | 13 | 170 | 61522 | 372.56 | 801 | 785 | 163.0 |
| A | 14 | 111 | 15493 | 90.22 | 801 | 785 | 163.0 |
| B | 4 | 81 | 125684 | 803.22 | 815 | 797 | 155.5 |
| B | 0 | 214 | 43590 | 275.23 | 815 | 797 | 155.5 |
| B | 11 | 51 | 23567 | 146.45 | 815 | 797 | 155.5 |
| C | 13 | 61 | 6092 | 29.01 | 783 | 788 | 182.8 |
| C | 10 | 22 | 3933 | 17.2 | 783 | 788 | 182.8 |
| C | 1 | 16 | 2194 | 7.69 | 783 | 788 | 182.8 |
| D | 1 | 20 | 945615 | 4933.51 | 773 | 748 | 191.5 |
| D | 2 | 216 | 297378 | 1548.82 | 773 | 748 | 191.5 |
| D | 12 | 233 | 62131 | 320.5 | 773 | 748 | 191.5 |
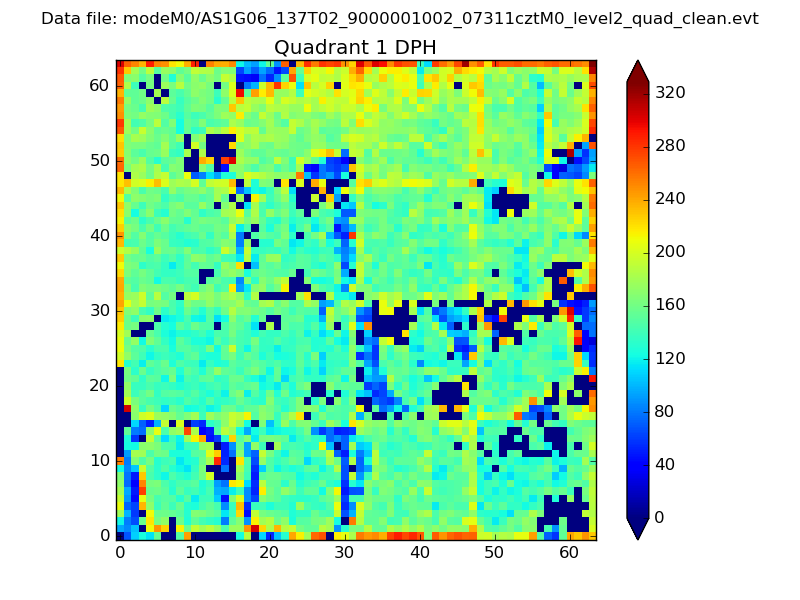
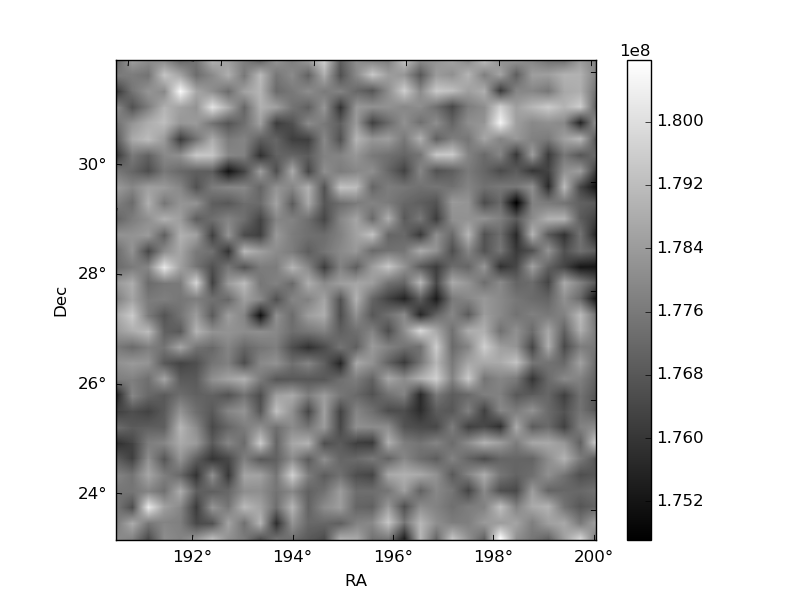
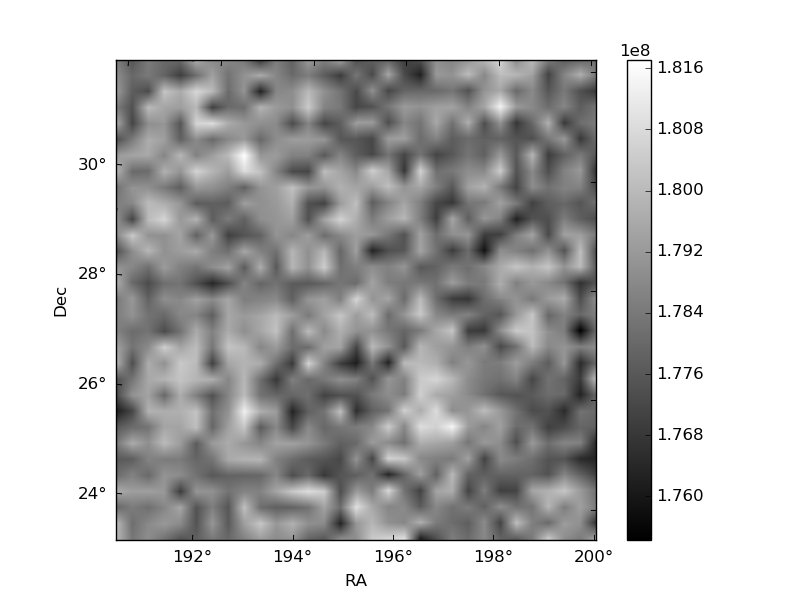
Histogram calculated using DETX and DETY for each event in the final _common_clean file
| Quadrant A | 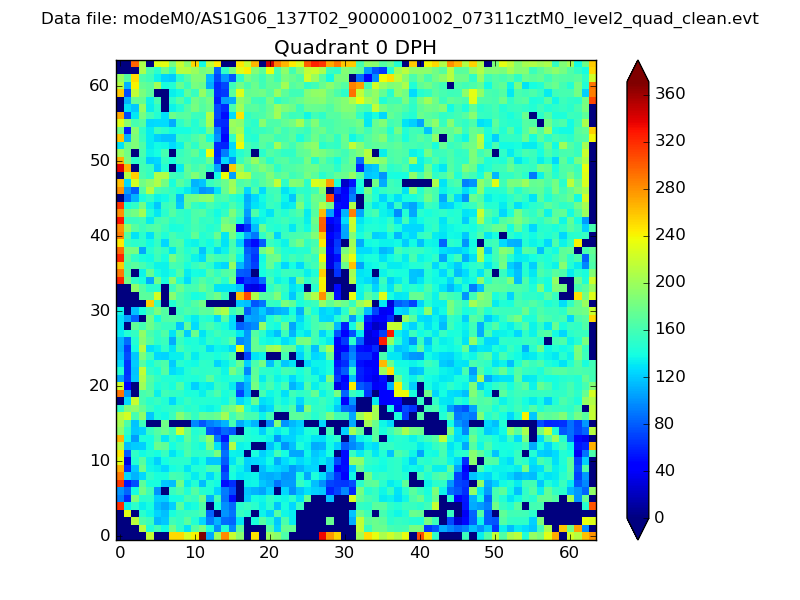 |
 |
Quadrant B |
|---|---|---|---|
| Quadrant D | 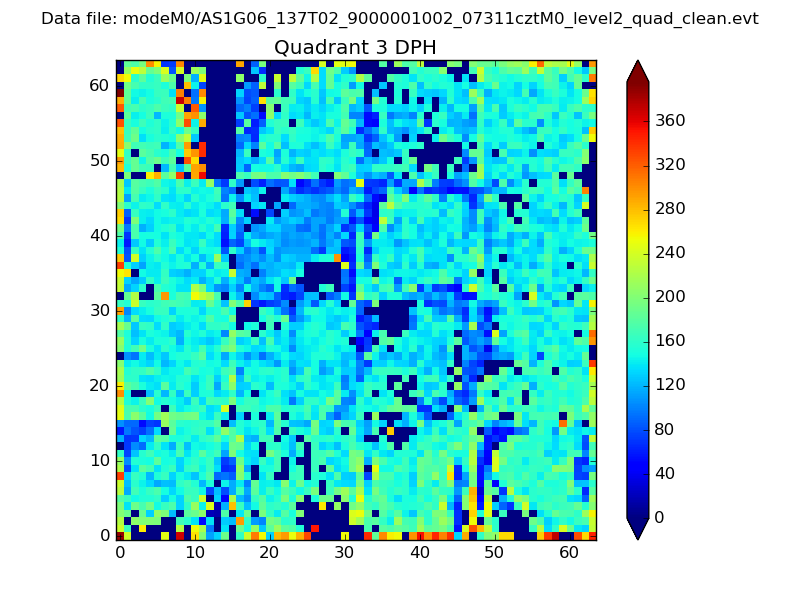 |
 |
Quadrant C |
| Plot type | Count rate plots | Images |
|---|---|---|
| Comparison with Poisson distribution Blue bars denote a histogram of data divided into 1 sec bins. Red curve is a Poisson curve with rate = median count rate of data. |
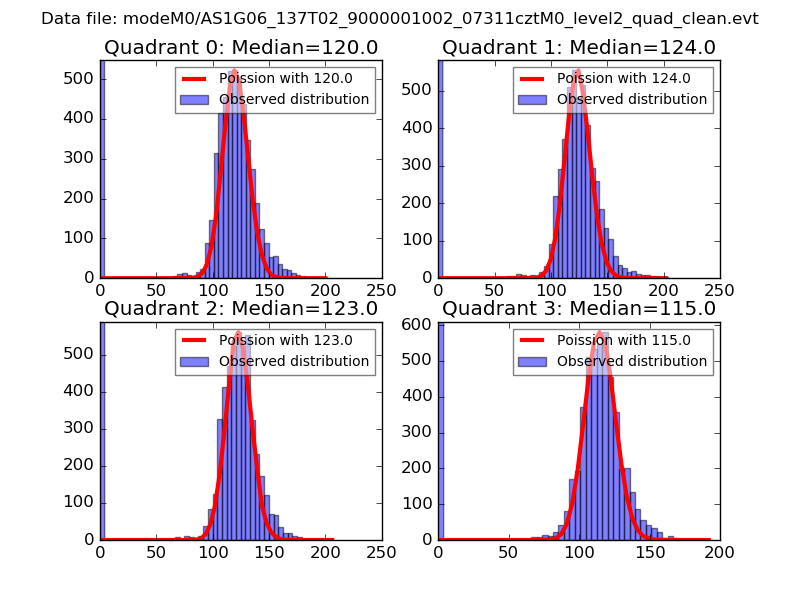 |
 |
| Quadrant-wise count rates Data is divided into 100 sec bins |
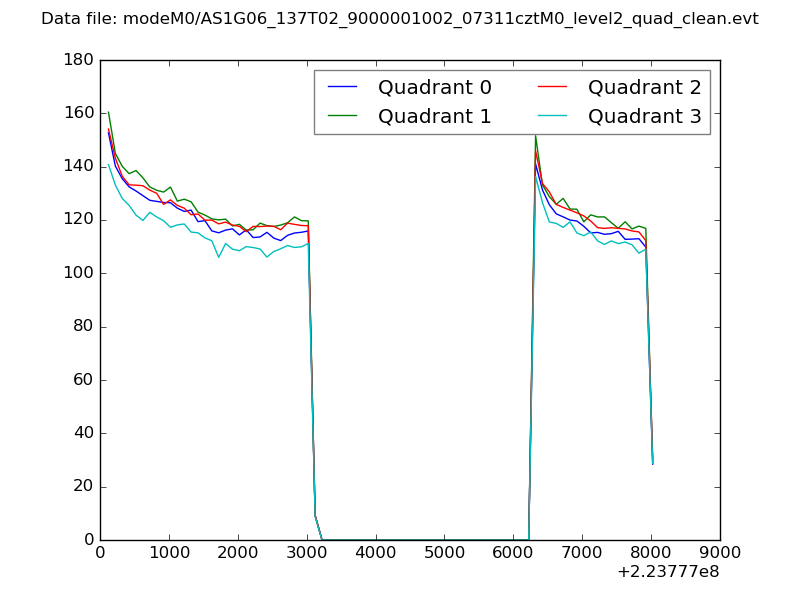 |
|
| Module-wise count rates for Quadrant A Data is divided into 100 sec bins |
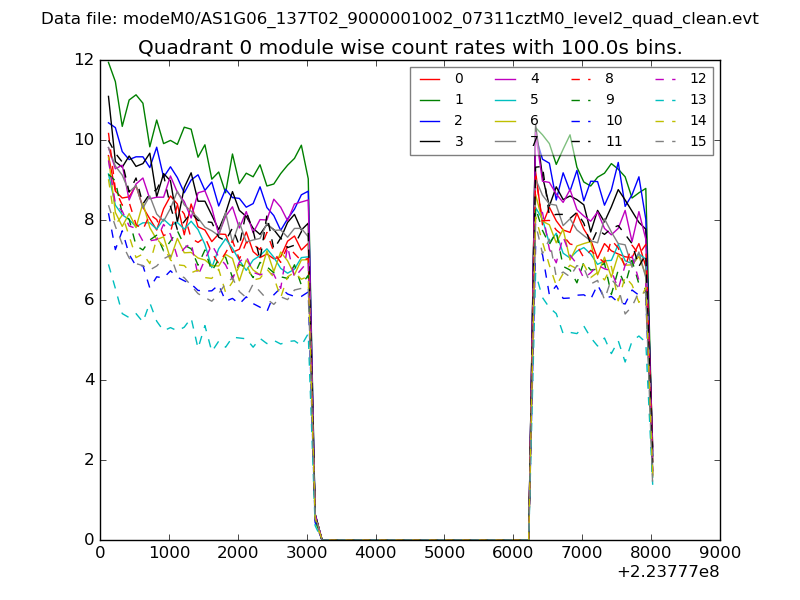 |
 |
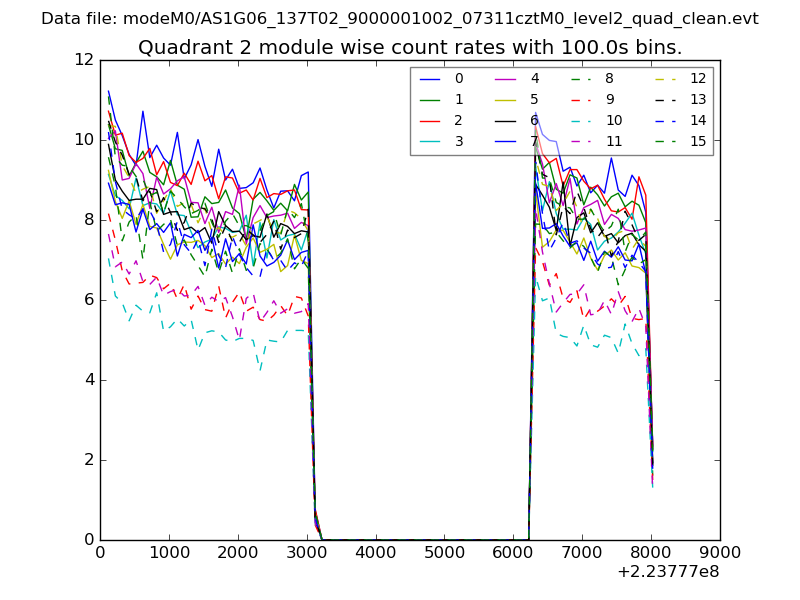
| Module-wise count rates for Quadrant B Data is divided into 100 sec bins |
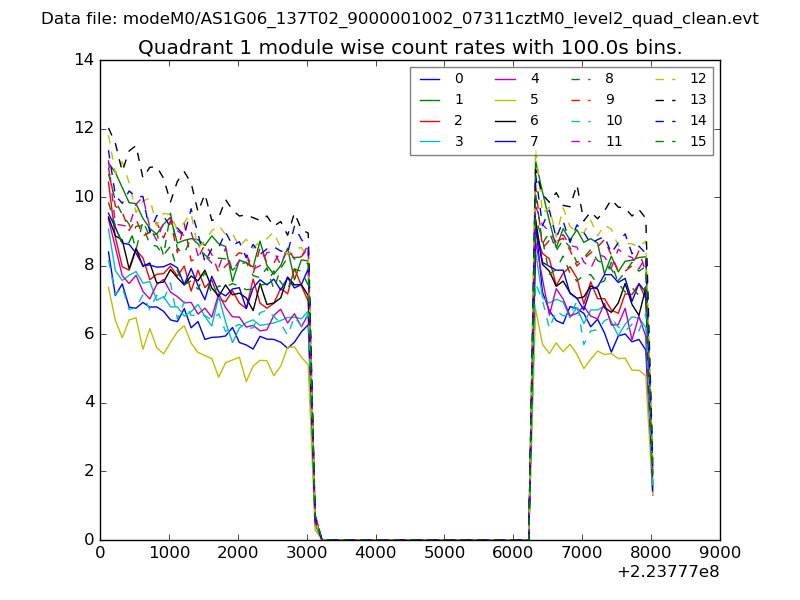 |
 |
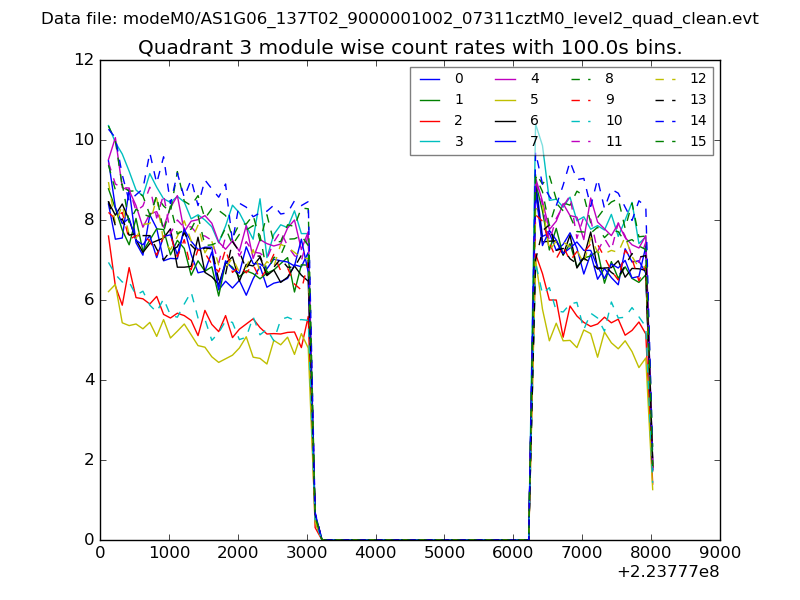
| Module-wise count rates for Quadrant C Data is divided into 100 sec bins |
 |
 |
| Module-wise count rates for Quadrant D Data is divided into 100 sec bins |
 |
 |
| Parameter | Plot |
|---|---|
| CZT HV Monitor | 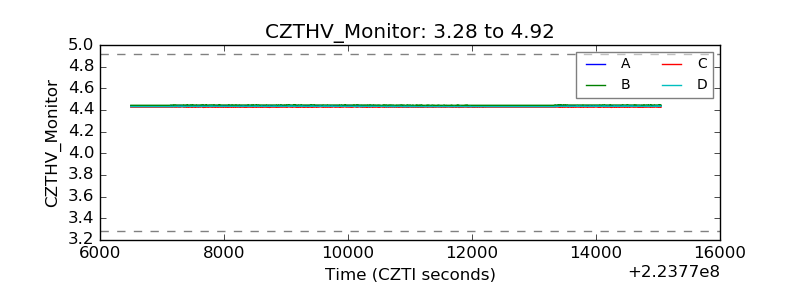 |
| D_VDD | 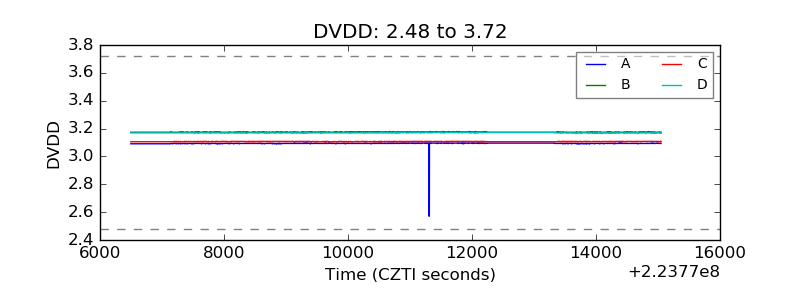 |
| Temperature 1 | 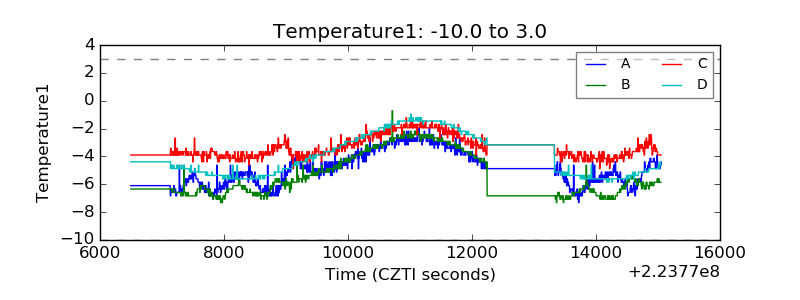 |
| Veto HV Monitor |  |
| Veto LLD | 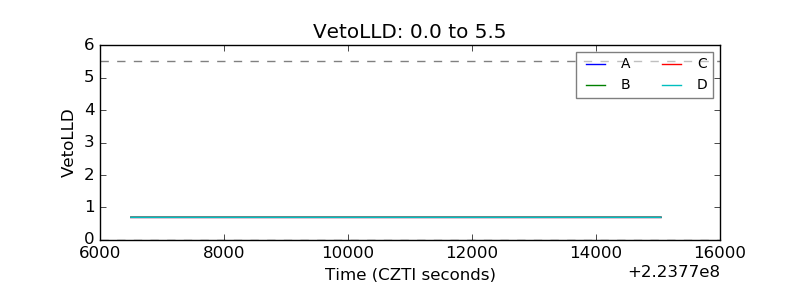 |
| Alpha Counter | 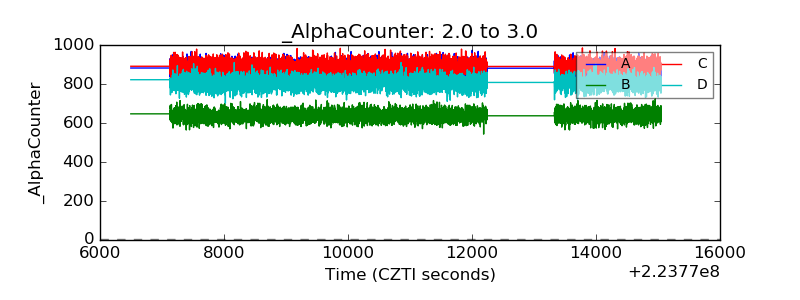 |
| _CPM_Rate | 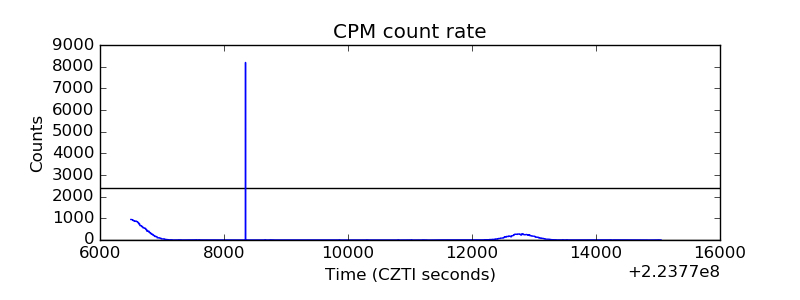 |
| CZT Counter |  |
| +2.5 Volts monitor |  |
| +5 Volts monitor |  |
| _ROLL_ROT | 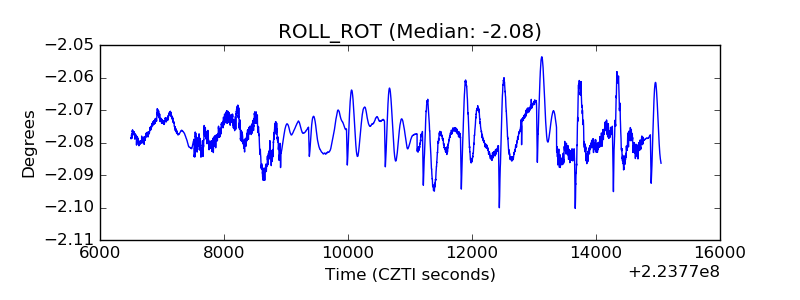 |
| _Roll_DEC | 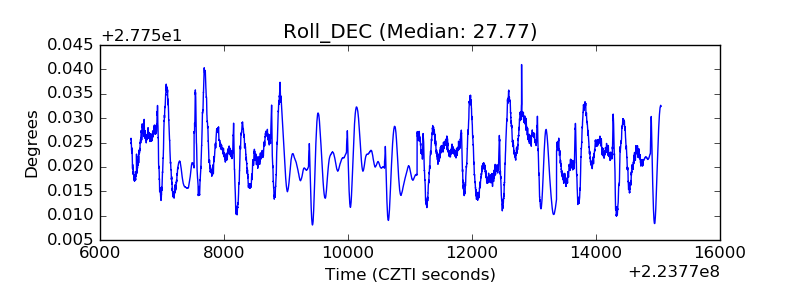 |
| _Roll_RA |  |
| Veto Counter | 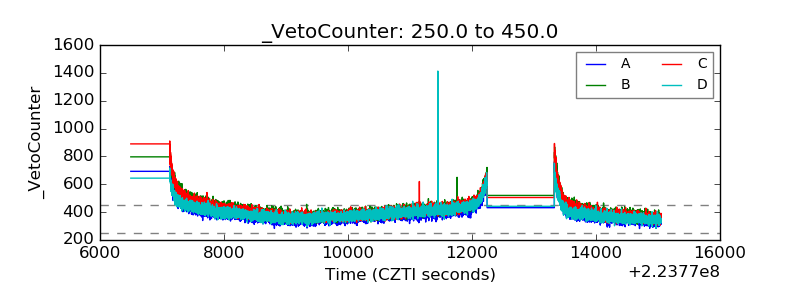 |