| Param | Original file | Final file |
|---|---|---|
| Filename | modeM0/AS1G06_137T02_9000001002_07313cztM0_level2.evt | modeM0/AS1G06_137T02_9000001002_07313cztM0_level2_quad_clean.evt |
| Size (bytes) | 284,843,520 | 44,254,080 |
| Size | 271.6 MB | 42.2 MB |
| Events in quadrant A | 2,044,324 | 258,503 |
| Events in quadrant B | 1,981,833 | 268,036 |
| Events in quadrant C | 1,822,950 | 267,573 |
| Events in quadrant D | 2,492,157 | 251,177 |
| Mode M0 | |||
|---|---|---|---|
| Quadrant | BADHDUFLAG | Total packets | Discarded packets |
| A | 0 | 10010 | 959 |
| B | 0 | 9749 | 946 |
| C | 0 | 9471 | 904 |
| D | 0 | 11073 | 1101 |
| Mode SS | |||
|---|---|---|---|
| Quadrant | BADHDUFLAG | Total packets | Discarded packets |
| A | 0 | 95 | 11 |
| B | 0 | 92 | 8 |
| C | 0 | 97 | 15 |
| D | 0 | 91 | 9 |
| Mode M9 | |||
|---|---|---|---|
| Quadrant | BADHDUFLAG | Total packets | Discarded packets |
| A | 0 | 7 | 1 |
| B | 0 | 7 | 1 |
| C | 0 | 7 | 1 |
| D | 0 | 7 | 1 |
| Quadrant | Total seconds | Saturated seconds | Saturation percentage |
|---|---|---|---|
| A | 4184 | 87 | 2.079350% |
| B | 4172 | 44 | 1.054650% |
| C | 4182 | 37 | 0.884744% |
| D | 4171 | 52 | 1.246703% |
Noise dominated data is calculated using 1-second bins in cleaned event files. If a bin has >2000 counts, and if more than 50% of those come from <1% of pixels, then it is considered to be noise-dominated and hence unusable.
| Quadrant | # 1 sec bins | Bins with >0 counts | Bins with >2000 counts | High rate bins dominated by noise | Noise dominated (total time) | Noise dominated (detector-on time) | Marked lightcurve |
|---|---|---|---|---|---|---|---|
| A | 4279 | 4260 | 15 | 15 | 0.35% | 0.35% | 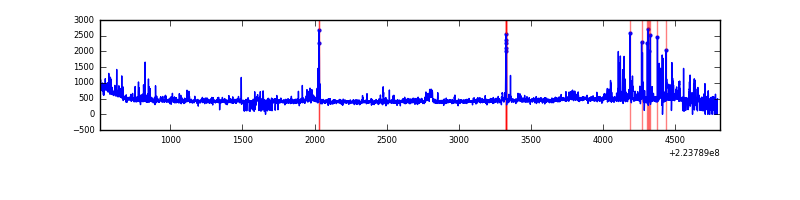 |
| B | 4295 | 4255 | 1 | 1 | 0.02% | 0.02% | 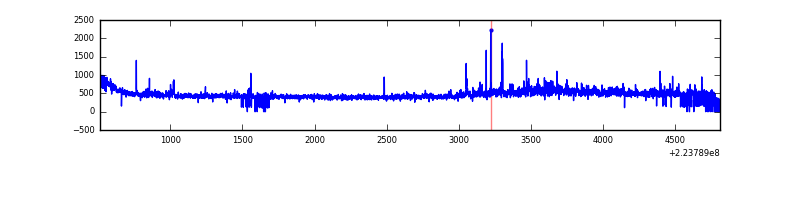 |
| C | 4278 | 4250 | 9 | 9 | 0.21% | 0.21% | 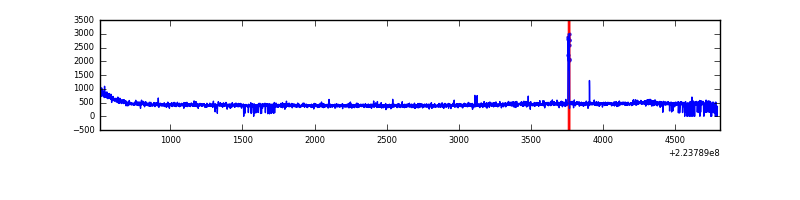 |
| D | 4283 | 4258 | 14 | 14 | 0.33% | 0.33% | 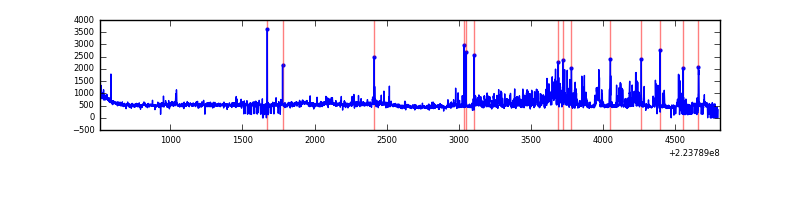 |
Top three noisy pixels from each quadrant. If the there are fewer than three noisy pixels in the level2.evt file, extra rows are filled as -1
| Pixel properties | Quadrant properties | ||||||
|---|---|---|---|---|---|---|---|
| Quadrant | DetID | PixID | Counts | Sigma | Mean | Median | Sigma |
| A | 8 | 15 | 184530 | 1898.66 | 466 | 455 | 96.9 |
| A | 14 | 111 | 55177 | 564.44 | 466 | 455 | 96.9 |
| A | 13 | 248 | 4683 | 43.61 | 466 | 455 | 96.9 |
| B | 0 | 214 | 81332 | 871.24 | 470 | 458 | 92.8 |
| B | 11 | 51 | 43133 | 459.73 | 470 | 458 | 92.8 |
| B | 4 | 81 | 28020 | 296.92 | 470 | 458 | 92.8 |
| C | 9 | 68 | 46751 | 432.1 | 454 | 454 | 107.1 |
| C | 13 | 61 | 3732 | 30.59 | 454 | 454 | 107.1 |
| C | 12 | 4 | 1806 | 12.62 | 454 | 454 | 107.1 |
| D | 1 | 20 | 374197 | 3366.82 | 452 | 438 | 111.0 |
| D | 2 | 216 | 358163 | 3222.38 | 452 | 438 | 111.0 |
| D | 12 | 233 | 31713 | 281.72 | 452 | 438 | 111.0 |
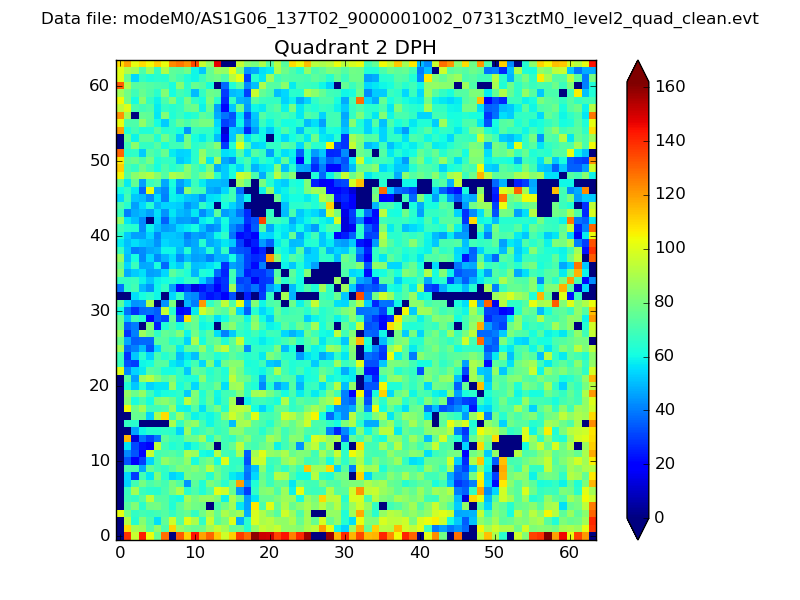
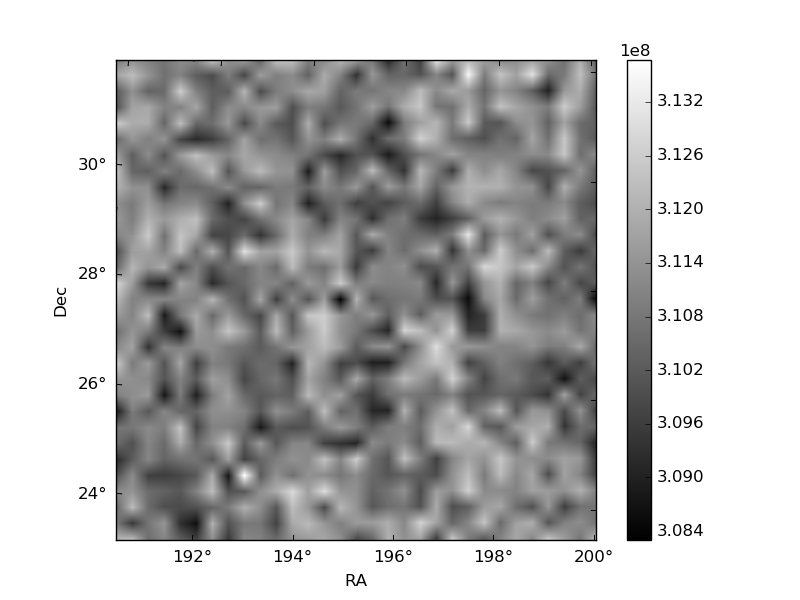
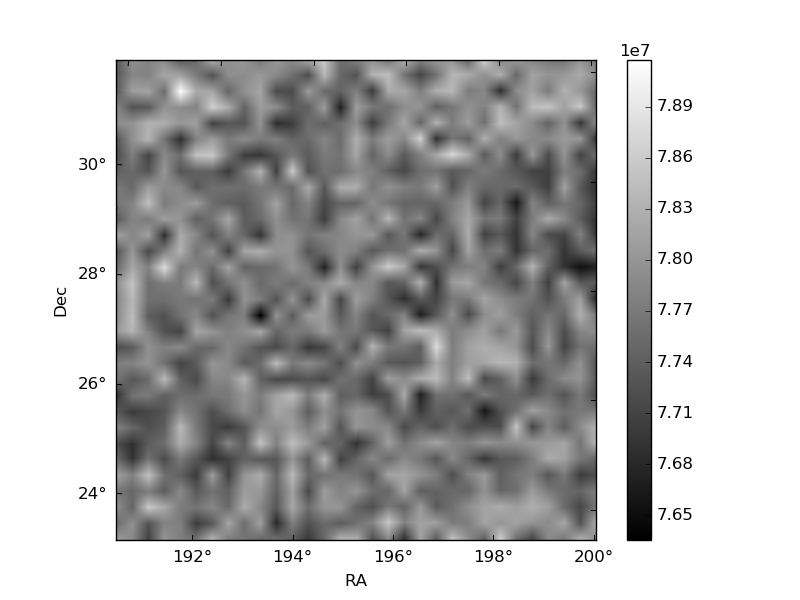
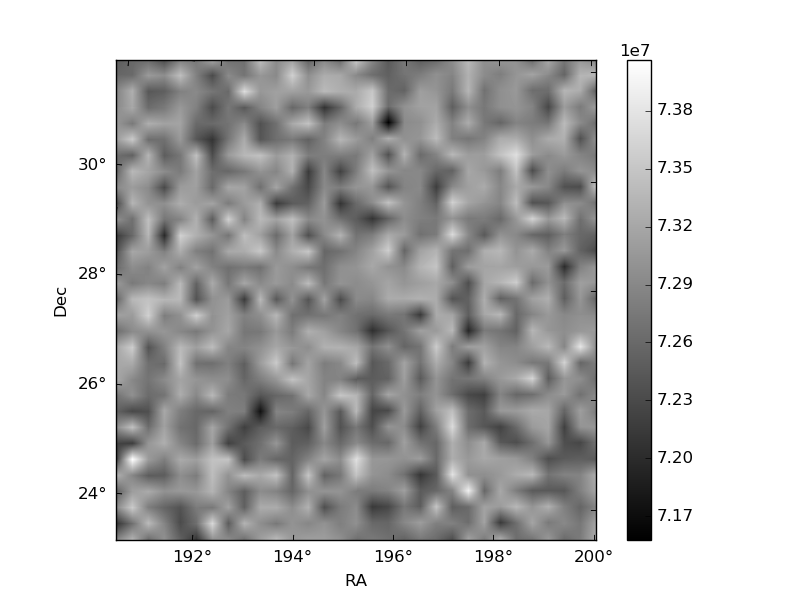
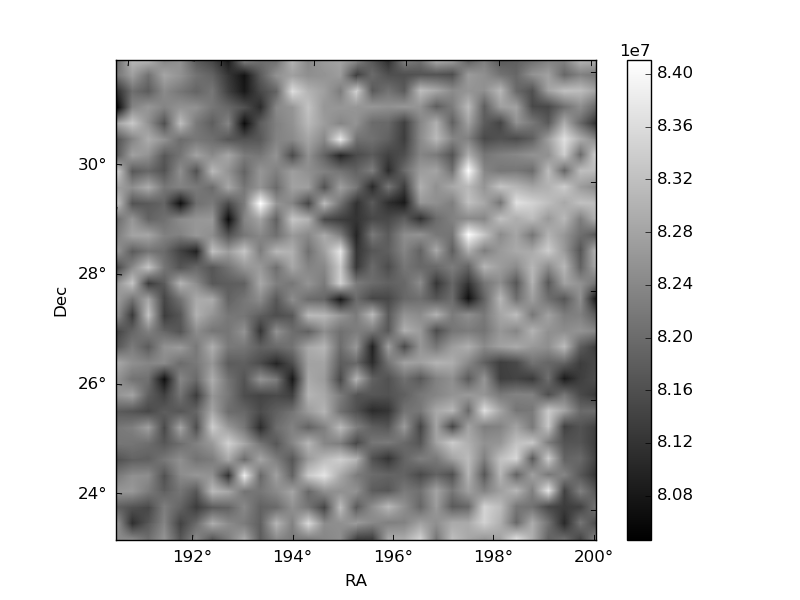
Histogram calculated using DETX and DETY for each event in the final _common_clean file
| Quadrant A | 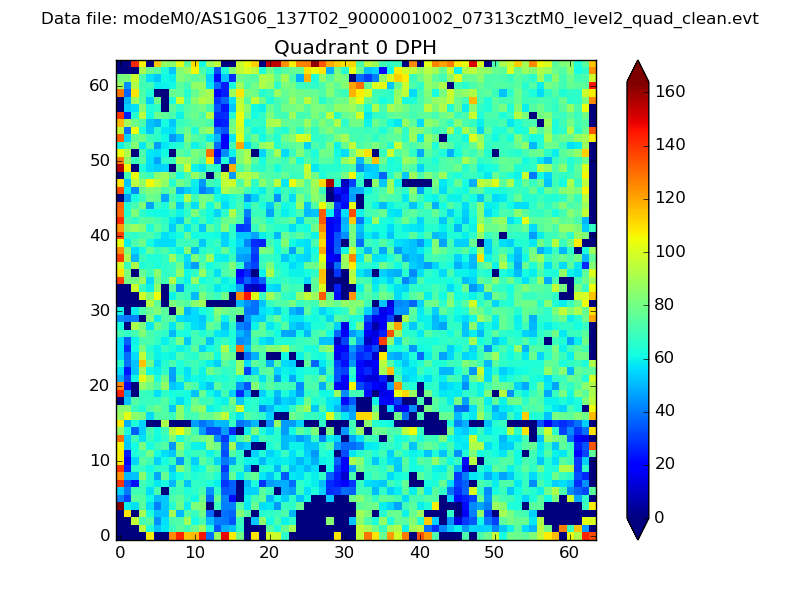 |
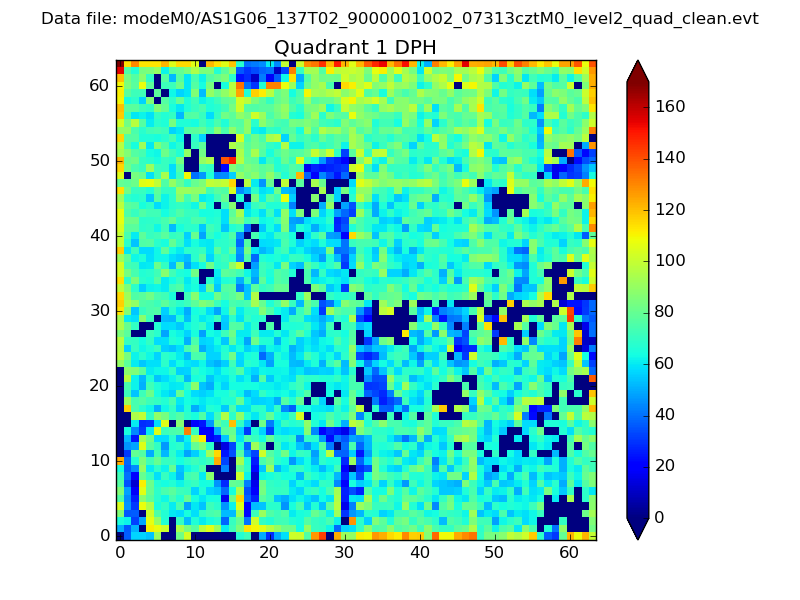 |
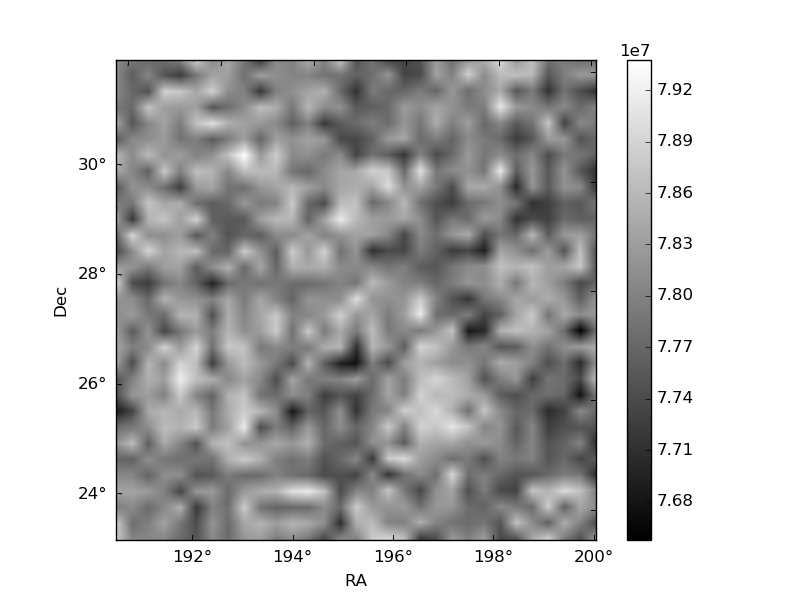
Quadrant B |
|---|---|---|---|
| Quadrant D | 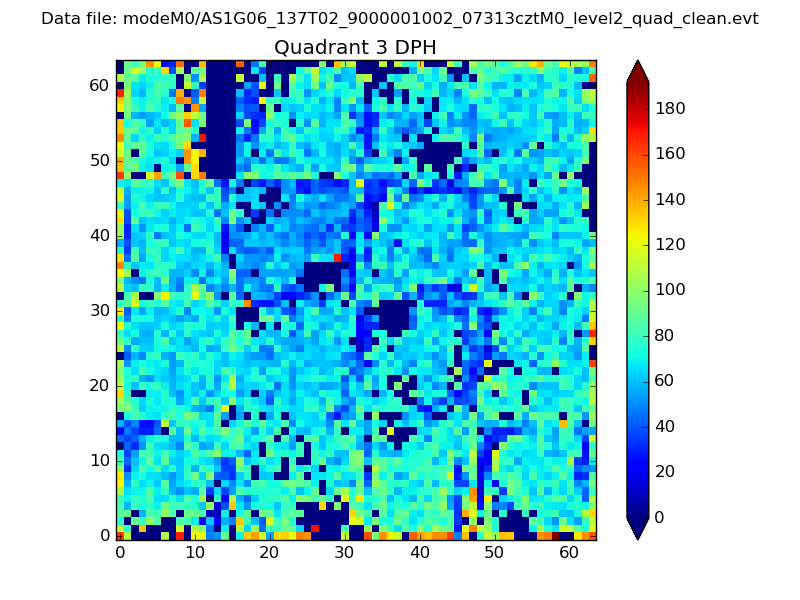 |
 |
Quadrant C |
| Plot type | Count rate plots | Images |
|---|---|---|
| Comparison with Poisson distribution Blue bars denote a histogram of data divided into 1 sec bins. Red curve is a Poisson curve with rate = median count rate of data. |
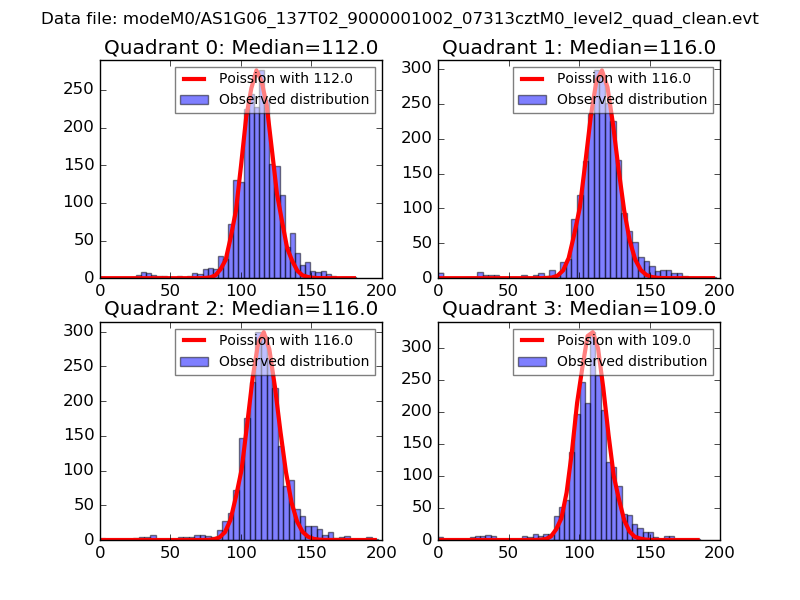 |
 |
| Quadrant-wise count rates Data is divided into 100 sec bins |
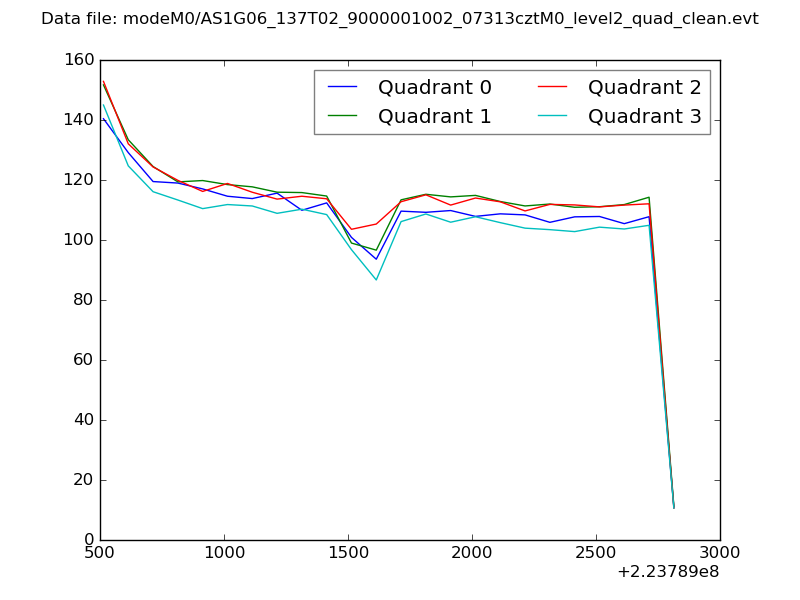 |
|
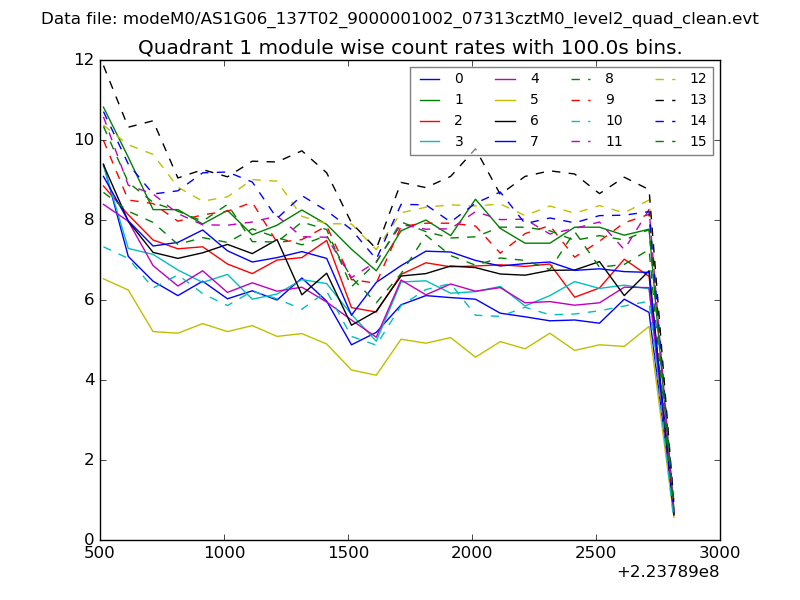
| Module-wise count rates for Quadrant A Data is divided into 100 sec bins |
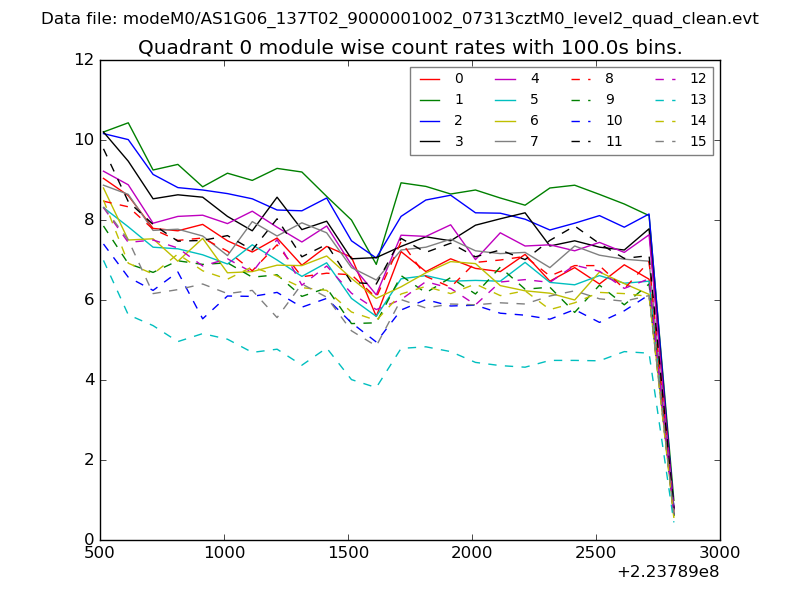 |
 |
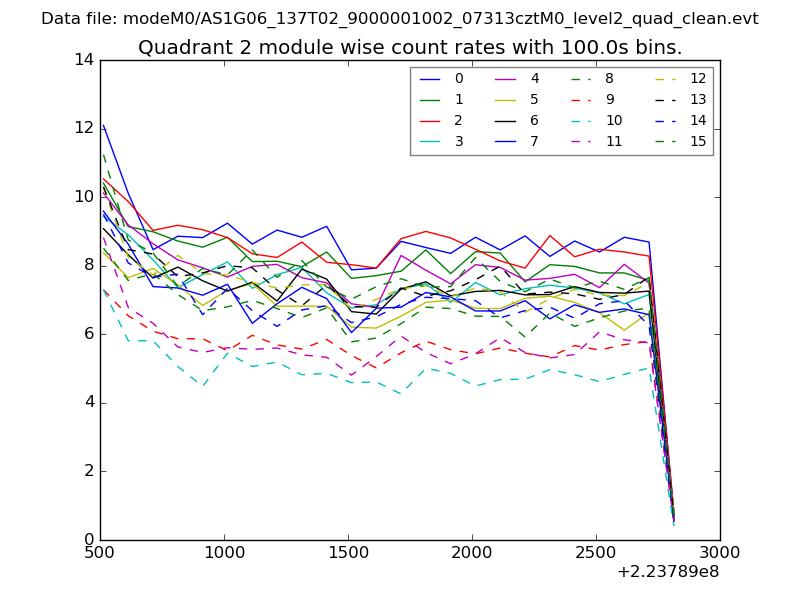
| Module-wise count rates for Quadrant B Data is divided into 100 sec bins |
 |
 |
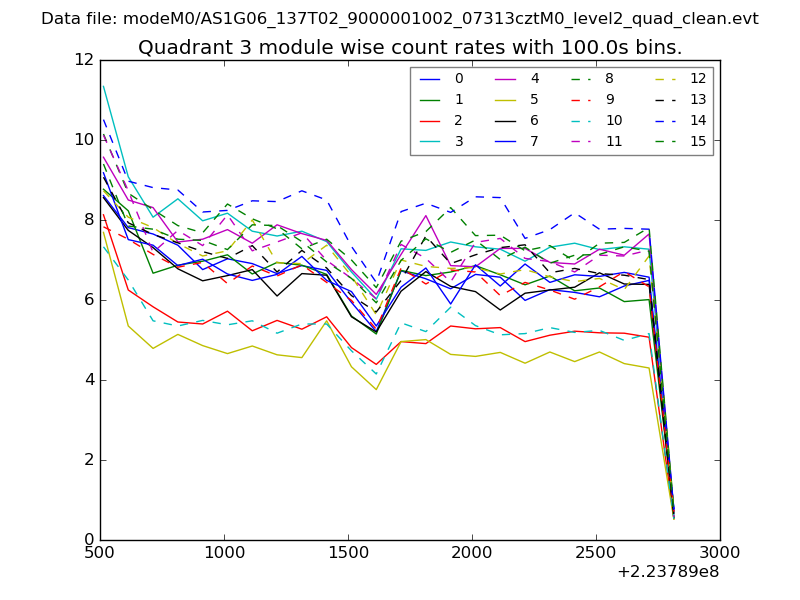
| Module-wise count rates for Quadrant C Data is divided into 100 sec bins |
 |
 |
| Module-wise count rates for Quadrant D Data is divided into 100 sec bins |
 |
 |
| Parameter | Plot |
|---|---|
| CZT HV Monitor | 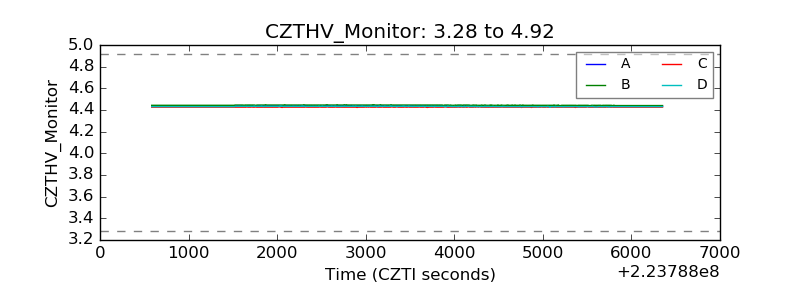 |
| D_VDD |  |
| Temperature 1 | 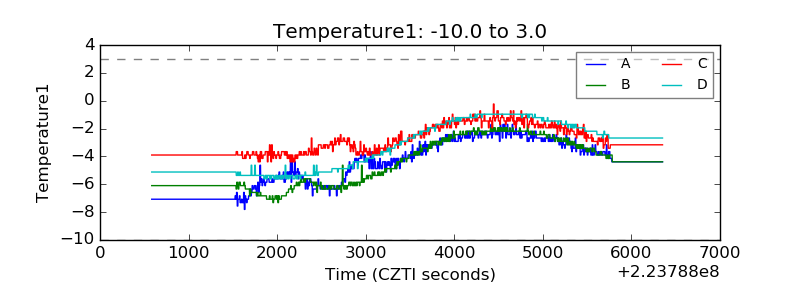 |
| Veto HV Monitor | 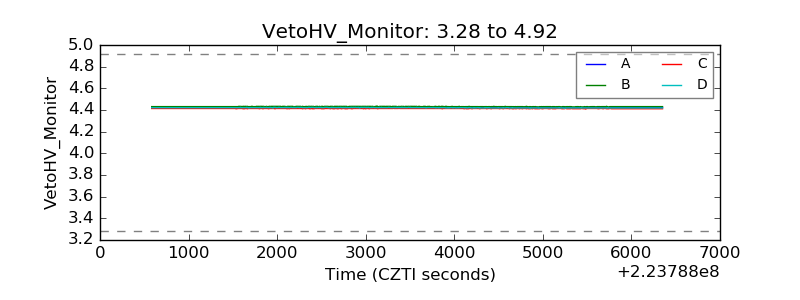 |
| Veto LLD | 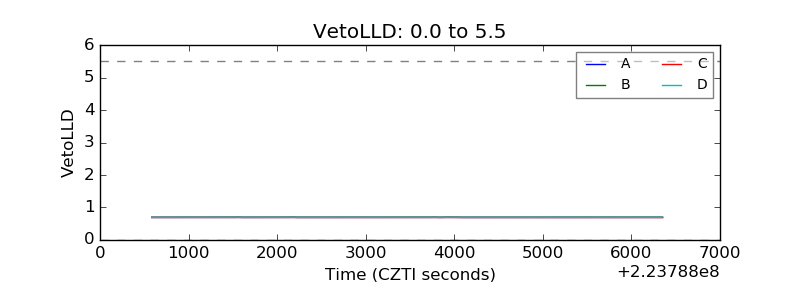 |
| Alpha Counter | 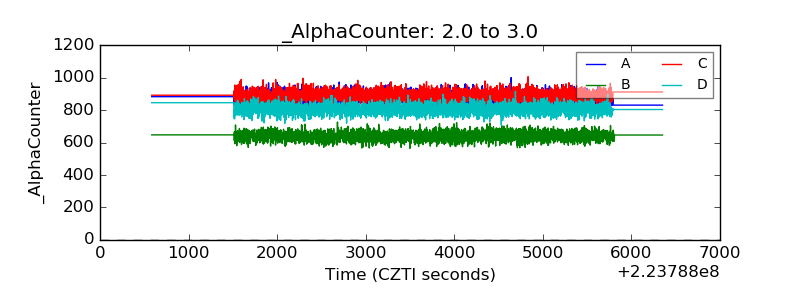 |
| _CPM_Rate | 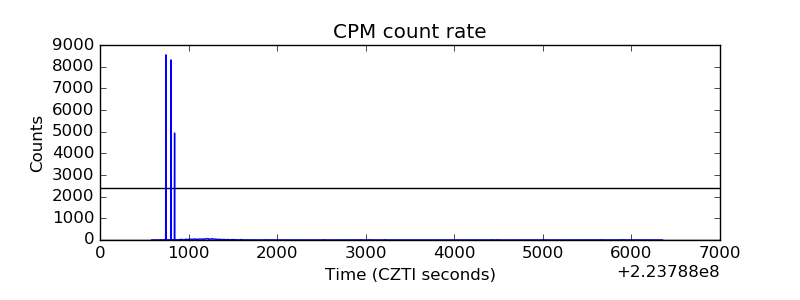 |
| CZT Counter | 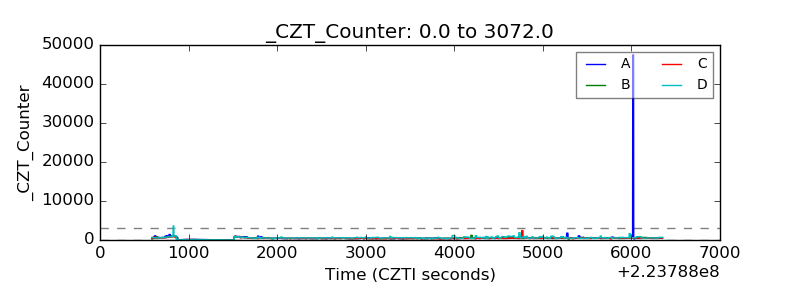 |
| +2.5 Volts monitor |  |
| +5 Volts monitor |  |
| _ROLL_ROT | 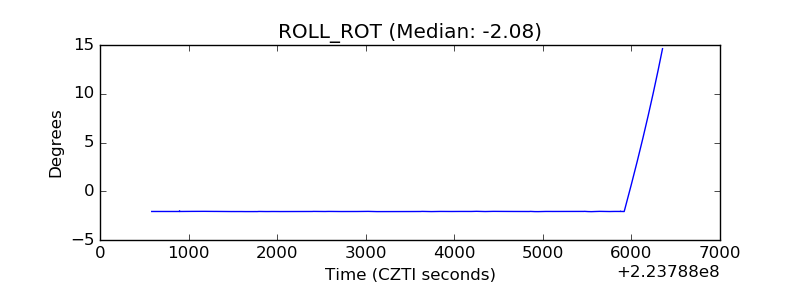 |
| _Roll_DEC | 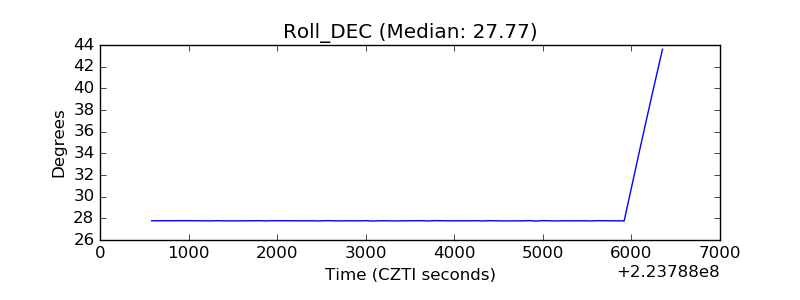 |
| _Roll_RA | 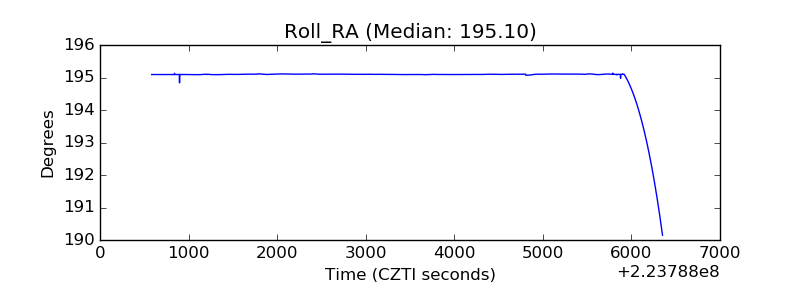 |
| Veto Counter |  |