| Param | Original file | Final file |
|---|---|---|
| Filename | modeM0/AS1A02_178T01_9000001006_07319cztM0_level2.evt | modeM0/AS1A02_178T01_9000001006_07319cztM0_level2_quad_clean.evt |
| Size (bytes) | 454,815,360 | 66,617,280 |
| Size | 433.7 MB | 63.5 MB |
| Events in quadrant A | 3,482,530 | 388,952 |
| Events in quadrant B | 3,354,465 | 394,655 |
| Events in quadrant C | 3,070,451 | 391,180 |
| Events in quadrant D | 3,412,849 | 376,550 |
| Mode M0 | |||
|---|---|---|---|
| Quadrant | BADHDUFLAG | Total packets | Discarded packets |
| A | 0 | 14767 | 3 |
| B | 0 | 14494 | 2 |
| C | 0 | 13805 | 2 |
| D | 0 | 14850 | 2 |
| Mode SS | |||
|---|---|---|---|
| Quadrant | BADHDUFLAG | Total packets | Discarded packets |
| A | 0 | 136 | 0 |
| B | 0 | 136 | 0 |
| C | 0 | 136 | 0 |
| D | 0 | 136 | 0 |
| Mode M9 | |||
|---|---|---|---|
| Quadrant | BADHDUFLAG | Total packets | Discarded packets |
| A | 0 | 10 | 0 |
| B | 0 | 10 | 0 |
| C | 0 | 10 | 0 |
| D | 0 | 11 | 0 |
| Quadrant | Total seconds | Saturated seconds | Saturation percentage |
|---|---|---|---|
| A | 6677 | 81 | 1.213120% |
| B | 6677 | 65 | 0.973491% |
| C | 6677 | 30 | 0.449304% |
| D | 6677 | 112 | 1.677400% |
Noise dominated data is calculated using 1-second bins in cleaned event files. If a bin has >2000 counts, and if more than 50% of those come from <1% of pixels, then it is considered to be noise-dominated and hence unusable.
| Quadrant | # 1 sec bins | Bins with >0 counts | Bins with >2000 counts | High rate bins dominated by noise | Noise dominated (total time) | Noise dominated (detector-on time) | Marked lightcurve |
|---|---|---|---|---|---|---|---|
| A | 7717 | 6677 | 10 | 10 | 0.13% | 0.15% | 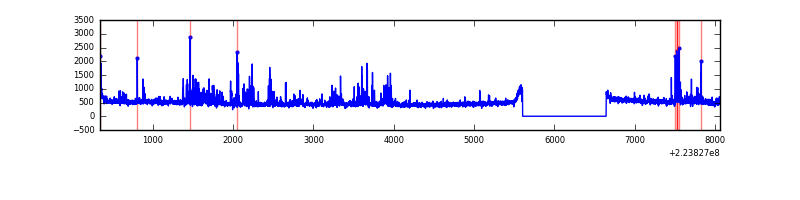 |
| B | 7717 | 6677 | 2 | 2 | 0.03% | 0.03% | 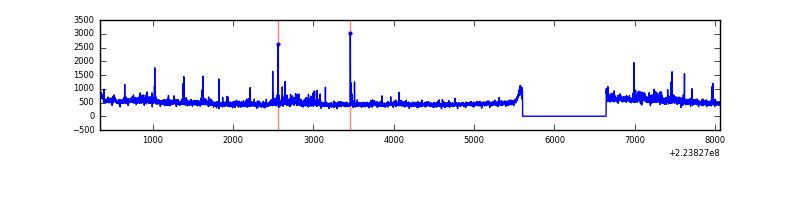 |
| C | 7717 | 6677 | 0 | 0 | 0.00% | 0.00% | 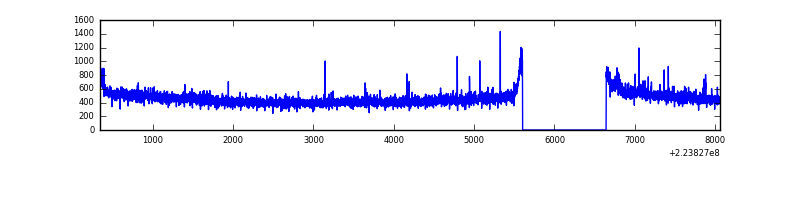 |
| D | 7717 | 6677 | 65 | 65 | 0.84% | 0.97% | 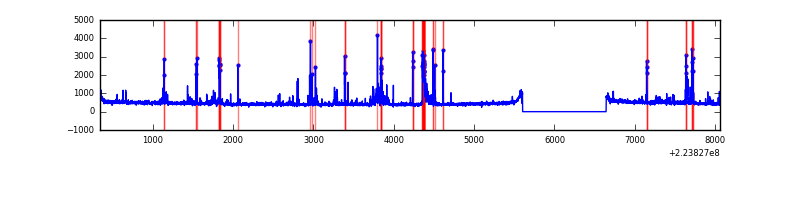 |
Top three noisy pixels from each quadrant. If the there are fewer than three noisy pixels in the level2.evt file, extra rows are filled as -1
| Pixel properties | Quadrant properties | ||||||
|---|---|---|---|---|---|---|---|
| Quadrant | DetID | PixID | Counts | Sigma | Mean | Median | Sigma |
| A | 8 | 15 | 384583 | 2359.27 | 797 | 779 | 162.7 |
| A | 3 | 1 | 10351 | 58.84 | 797 | 779 | 162.7 |
| A | 0 | 226 | 7657 | 42.28 | 797 | 779 | 162.7 |
| B | 0 | 214 | 100113 | 646.09 | 803 | 784 | 153.7 |
| B | 11 | 51 | 93784 | 604.93 | 803 | 784 | 153.7 |
| B | 4 | 81 | 24199 | 152.3 | 803 | 784 | 153.7 |
| C | 9 | 68 | 44842 | 245.82 | 774 | 778 | 179.3 |
| C | 13 | 61 | 6021 | 29.25 | 774 | 778 | 179.3 |
| C | 10 | 22 | 3177 | 13.38 | 774 | 778 | 179.3 |
| D | 14 | 34 | 158551 | 831.58 | 773 | 749 | 189.8 |
| D | 1 | 52 | 131529 | 689.18 | 773 | 749 | 189.8 |
| D | 2 | 14 | 88008 | 459.83 | 773 | 749 | 189.8 |
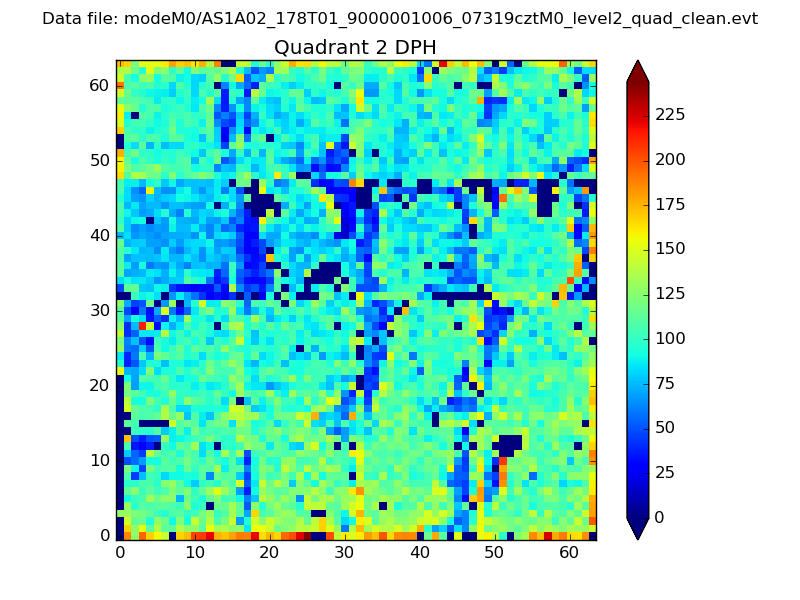
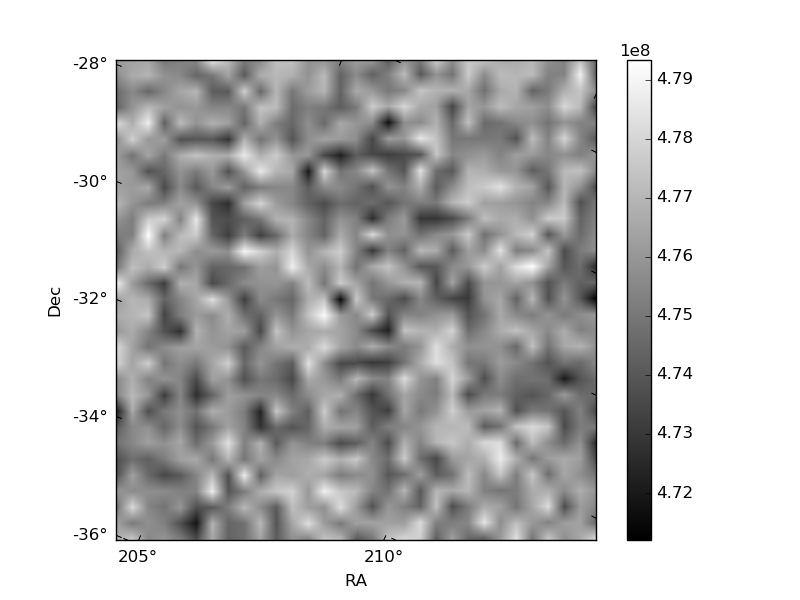
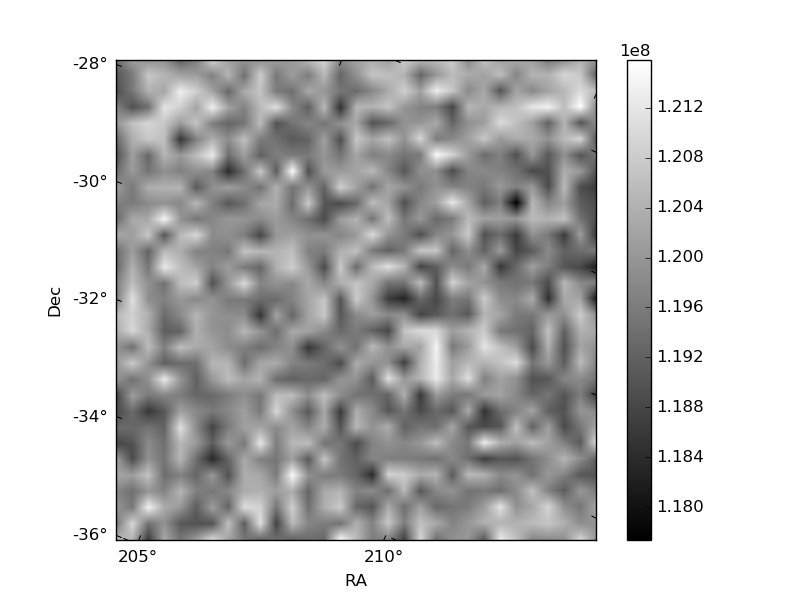
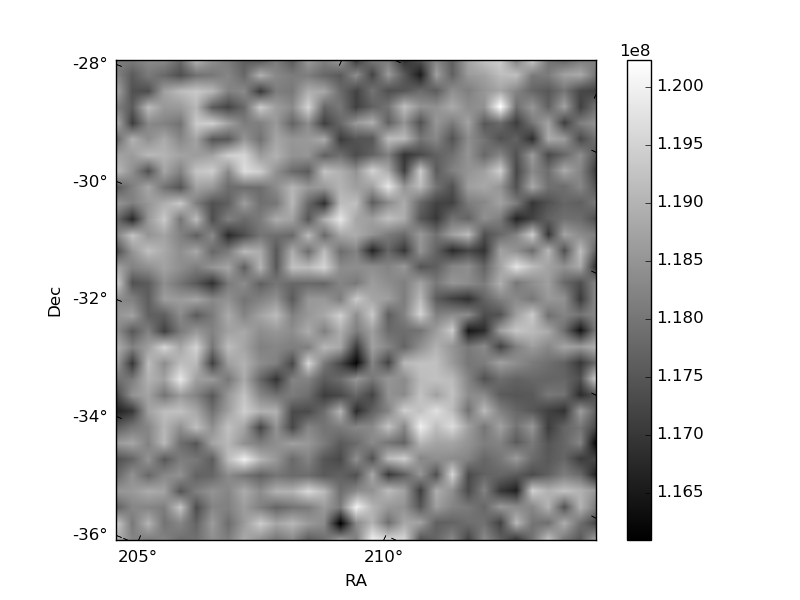
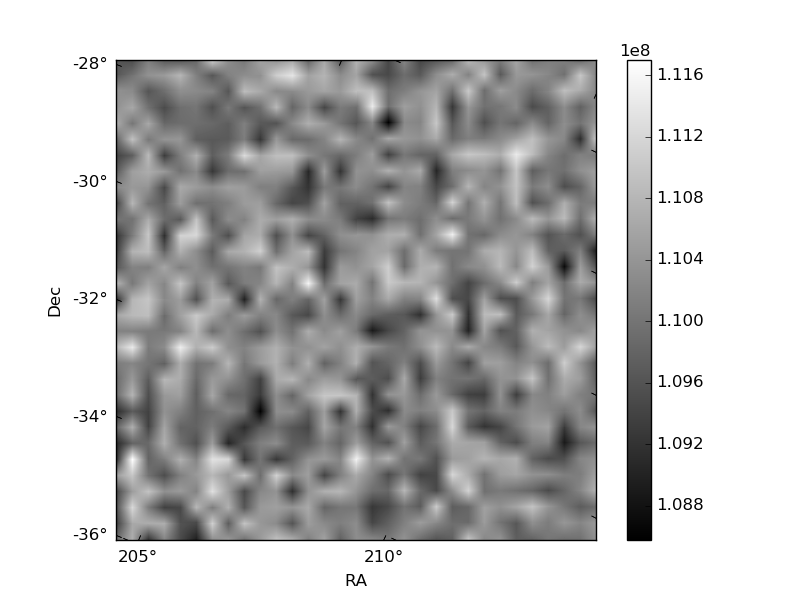
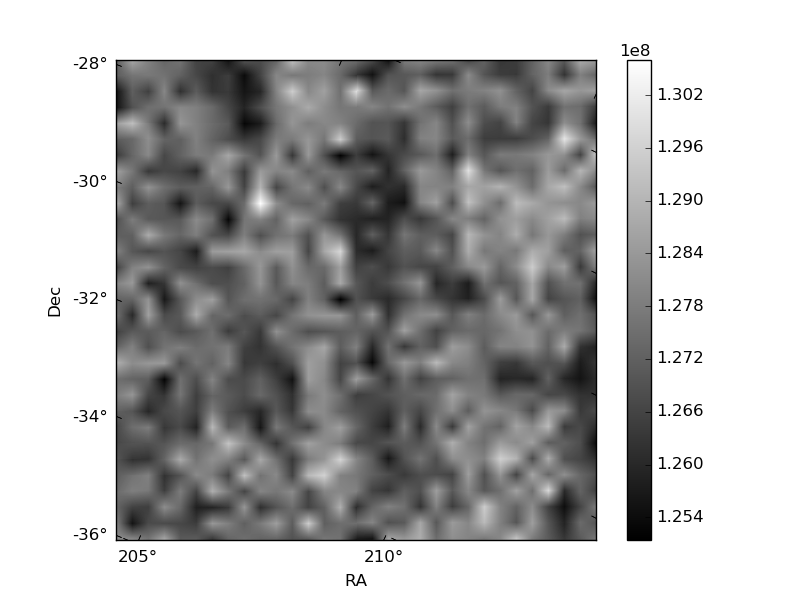
Histogram calculated using DETX and DETY for each event in the final _common_clean file
| Quadrant A | 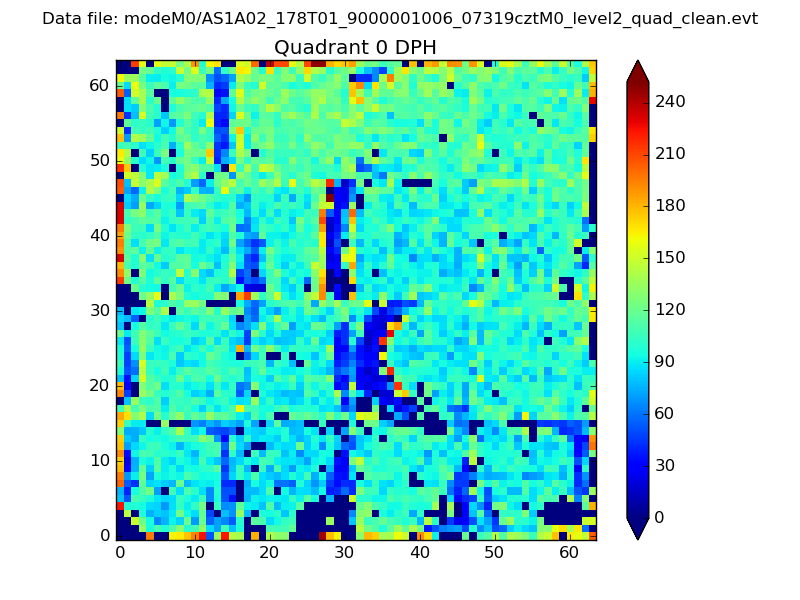 |
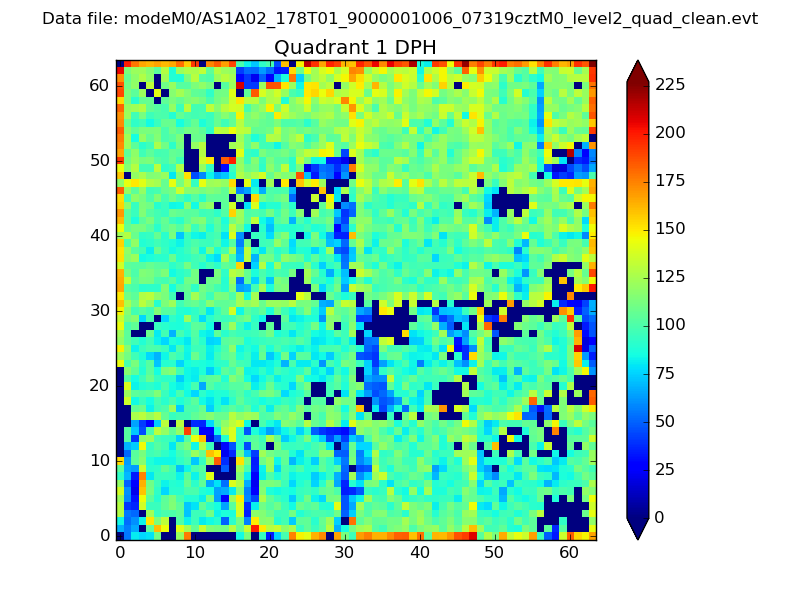 |
Quadrant B |
|---|---|---|---|
| Quadrant D | 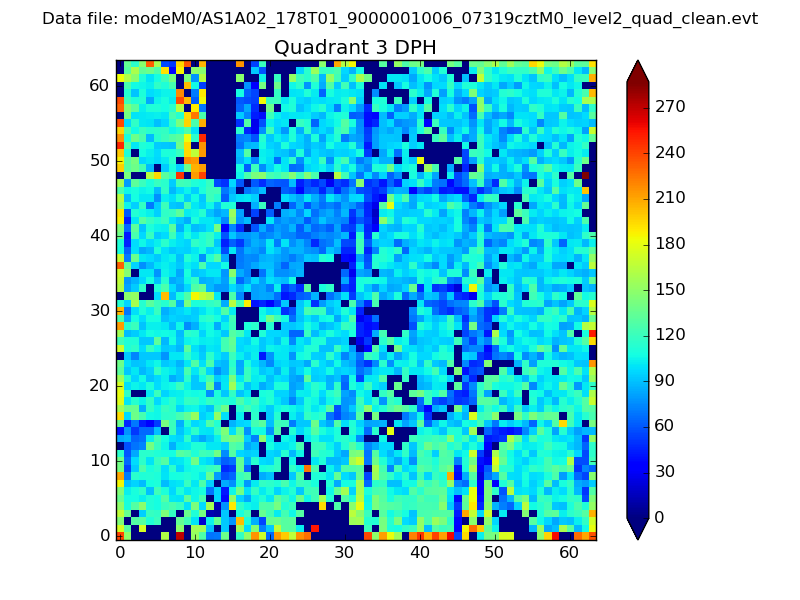 |
 |
Quadrant C |
| Plot type | Count rate plots | Images |
|---|---|---|
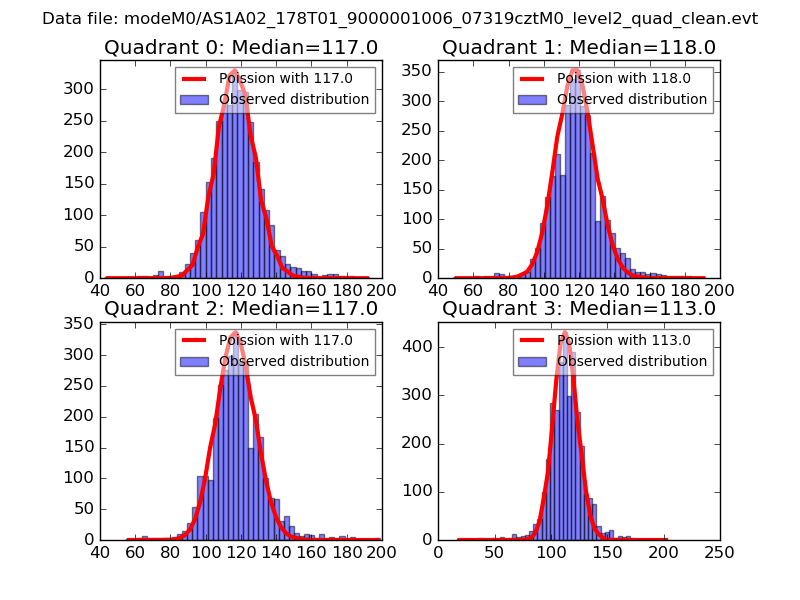
| Comparison with Poisson distribution Blue bars denote a histogram of data divided into 1 sec bins. Red curve is a Poisson curve with rate = median count rate of data. |
 |
 |
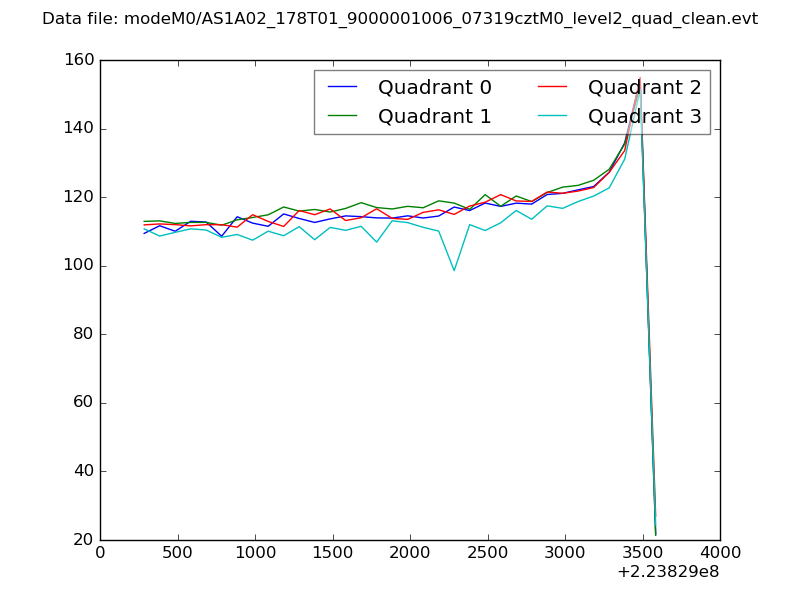
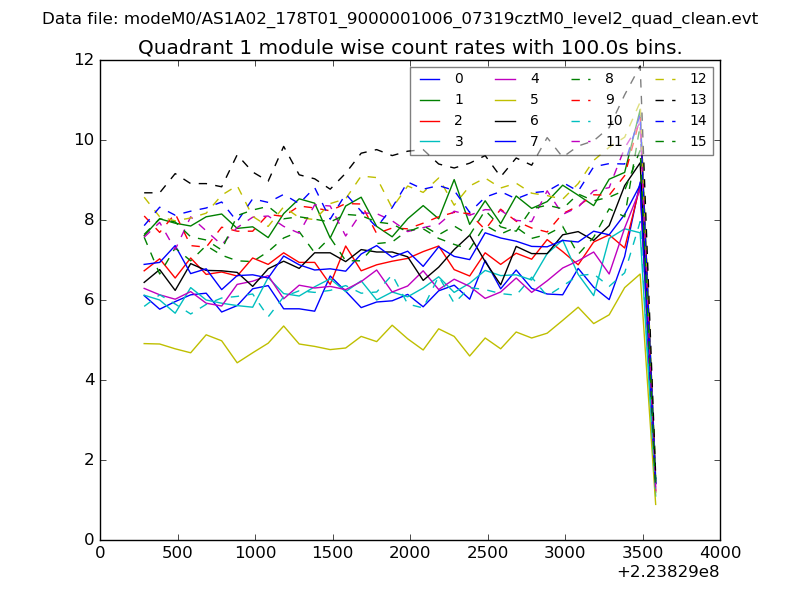
| Quadrant-wise count rates Data is divided into 100 sec bins |
 |
|
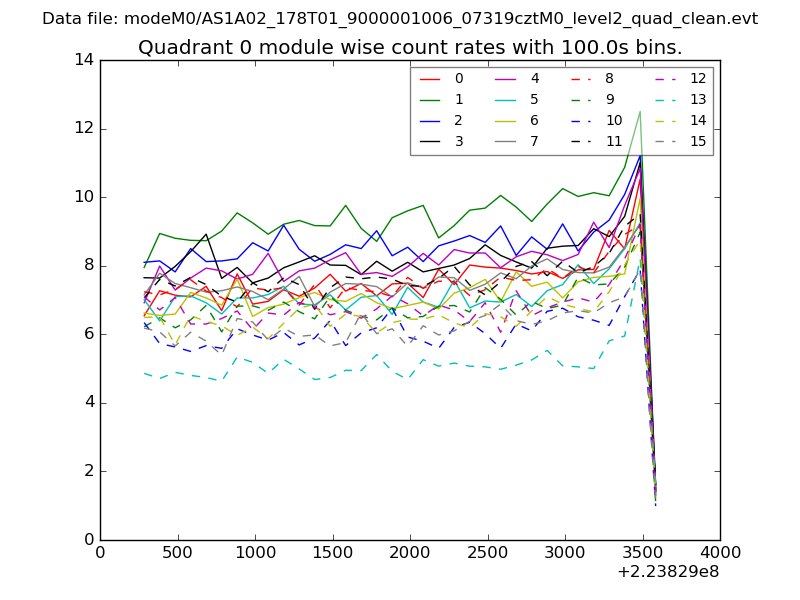
| Module-wise count rates for Quadrant A Data is divided into 100 sec bins |
 |
 |
| Module-wise count rates for Quadrant B Data is divided into 100 sec bins |
 |
 |
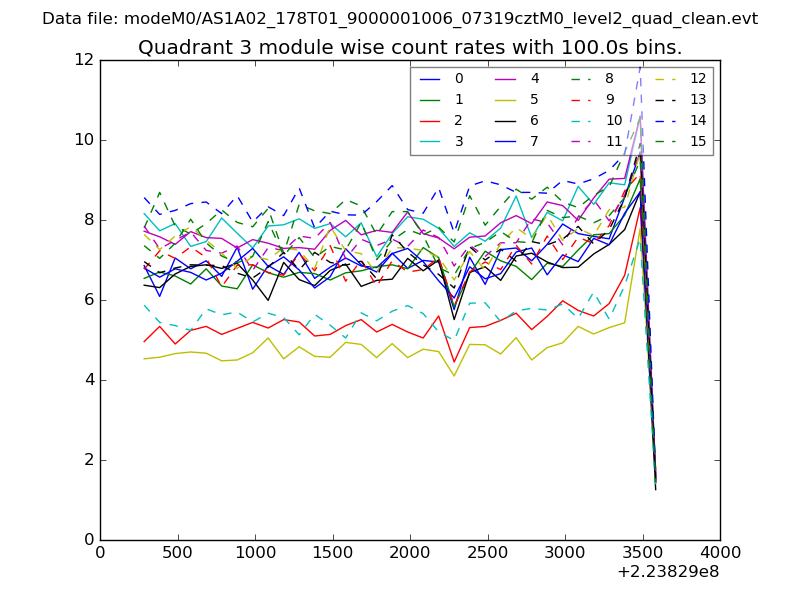
| Module-wise count rates for Quadrant C Data is divided into 100 sec bins |
 |
 |
| Module-wise count rates for Quadrant D Data is divided into 100 sec bins |
 |
 |
| Parameter | Plot |
|---|---|
| CZT HV Monitor | 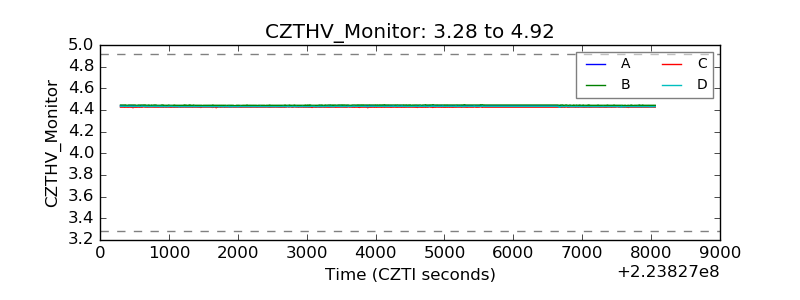 |
| D_VDD | 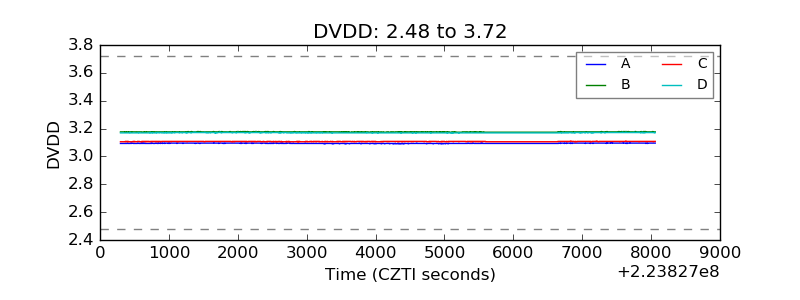 |
| Temperature 1 | 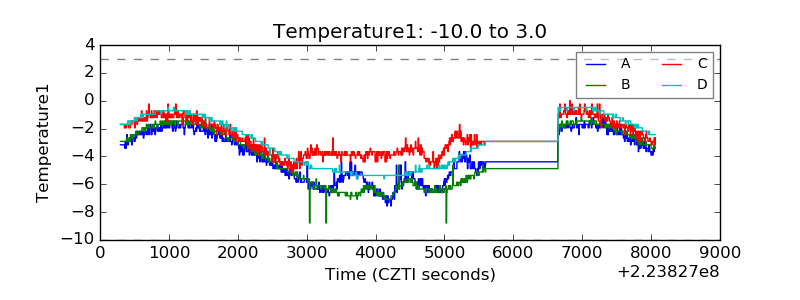 |
| Veto HV Monitor | 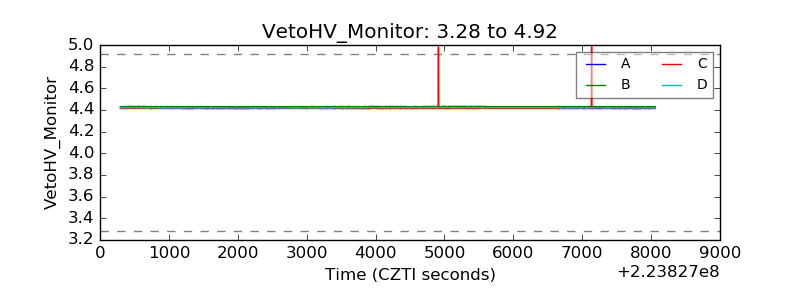 |
| Veto LLD | 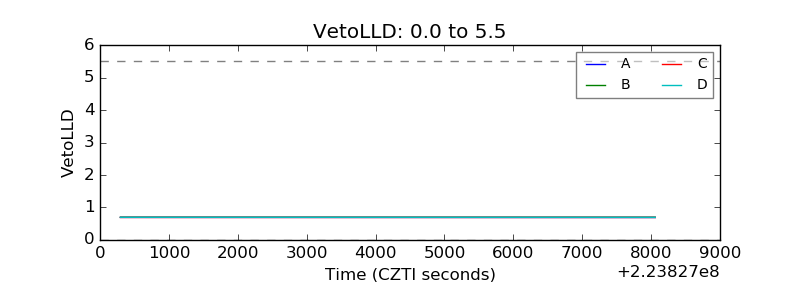 |
| Alpha Counter | 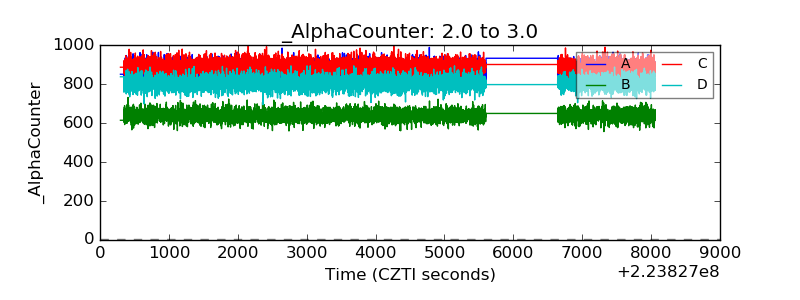 |
| _CPM_Rate | 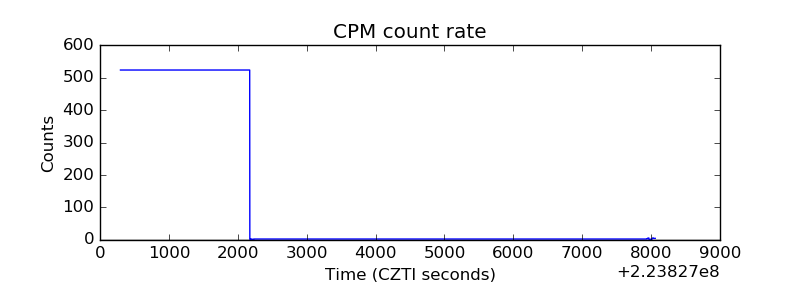 |
| CZT Counter | 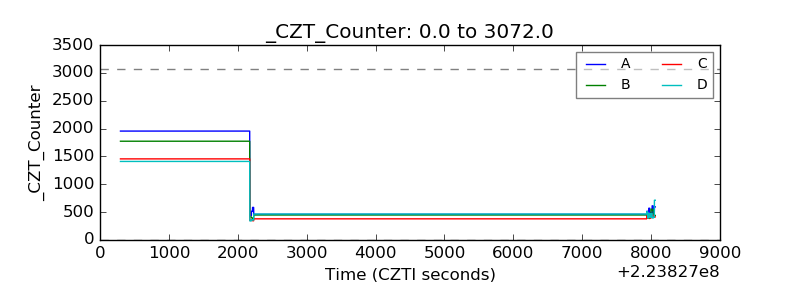 |
| +2.5 Volts monitor |  |
| +5 Volts monitor |  |
| _ROLL_ROT |  |
| _Roll_DEC | 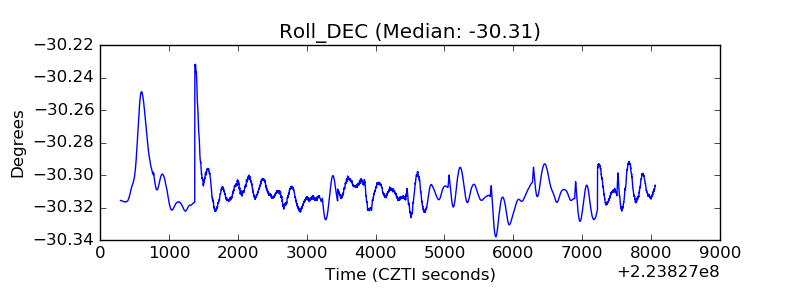 |
| _Roll_RA | 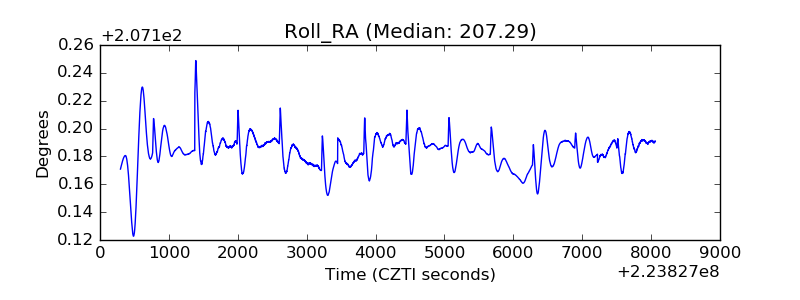 |
| Veto Counter | 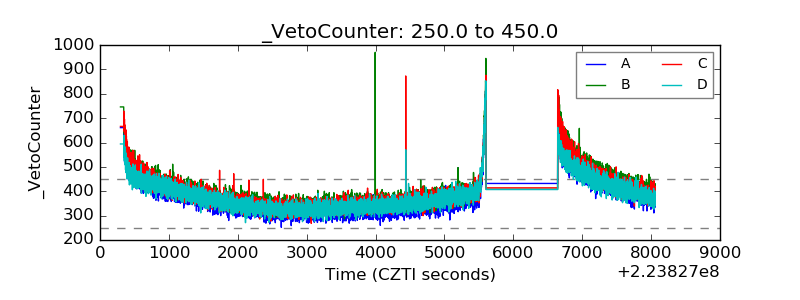 |