| Param | Original file | Final file |
|---|---|---|
| Filename | modeM0/AS1A02_178T01_9000001006_07321cztM0_level2.evt | modeM0/AS1A02_178T01_9000001006_07321cztM0_level2_quad_clean.evt |
| Size (bytes) | 448,934,400 | 79,004,160 |
| Size | 428.1 MB | 75.3 MB |
| Events in quadrant A | 3,427,918 | 486,538 |
| Events in quadrant B | 3,418,272 | 494,236 |
| Events in quadrant C | 3,123,589 | 486,075 |
| Events in quadrant D | 3,179,409 | 467,157 |
| Mode M0 | |||
|---|---|---|---|
| Quadrant | BADHDUFLAG | Total packets | Discarded packets |
| A | 0 | 14594 | 3 |
| B | 0 | 14589 | 2 |
| C | 0 | 13807 | 2 |
| D | 0 | 14134 | 2 |
| Mode SS | |||
|---|---|---|---|
| Quadrant | BADHDUFLAG | Total packets | Discarded packets |
| A | 0 | 136 | 0 |
| B | 0 | 136 | 0 |
| C | 0 | 136 | 0 |
| D | 0 | 136 | 0 |
| Mode M9 | |||
|---|---|---|---|
| Quadrant | BADHDUFLAG | Total packets | Discarded packets |
| A | 0 | 22 | 0 |
| B | 0 | 22 | 0 |
| C | 0 | 22 | 0 |
| D | 0 | 22 | 0 |
| Quadrant | Total seconds | Saturated seconds | Saturation percentage |
|---|---|---|---|
| A | 6570 | 120 | 1.826484% |
| B | 6570 | 104 | 1.582953% |
| C | 6570 | 58 | 0.882801% |
| D | 6570 | 84 | 1.278539% |
Noise dominated data is calculated using 1-second bins in cleaned event files. If a bin has >2000 counts, and if more than 50% of those come from <1% of pixels, then it is considered to be noise-dominated and hence unusable.
| Quadrant | # 1 sec bins | Bins with >0 counts | Bins with >2000 counts | High rate bins dominated by noise | Noise dominated (total time) | Noise dominated (detector-on time) | Marked lightcurve |
|---|---|---|---|---|---|---|---|
| A | 8765 | 6570 | 7 | 7 | 0.08% | 0.11% | 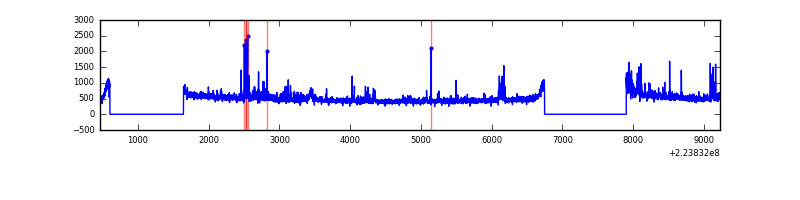 |
| B | 8765 | 6570 | 3 | 3 | 0.03% | 0.05% | 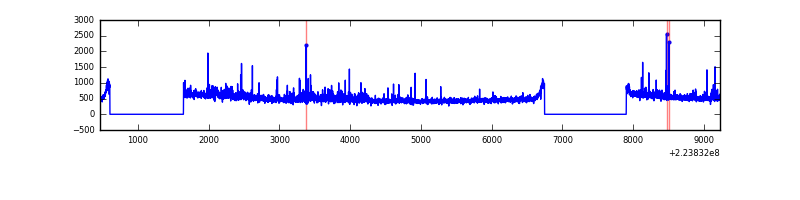 |
| C | 8765 | 6571 | 1 | 1 | 0.01% | 0.02% | 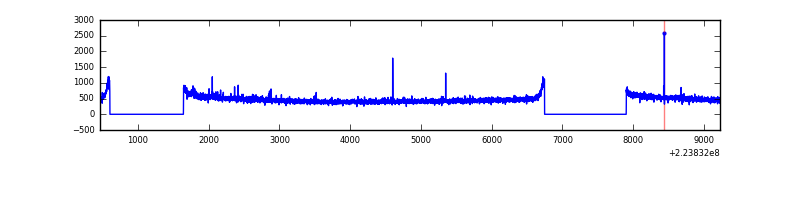 |
| D | 8765 | 6570 | 17 | 17 | 0.19% | 0.26% | 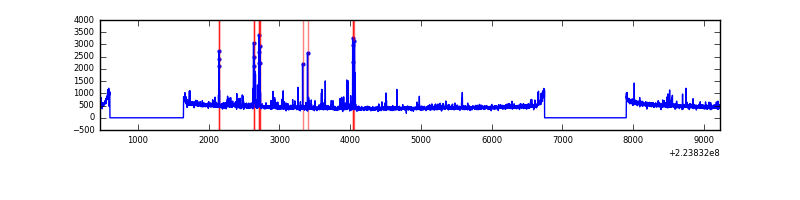 |
Top three noisy pixels from each quadrant. If the there are fewer than three noisy pixels in the level2.evt file, extra rows are filled as -1
| Pixel properties | Quadrant properties | ||||||
|---|---|---|---|---|---|---|---|
| Quadrant | DetID | PixID | Counts | Sigma | Mean | Median | Sigma |
| A | 8 | 15 | 261793 | 1580.47 | 811 | 795 | 165.1 |
| A | 14 | 111 | 23474 | 137.33 | 811 | 795 | 165.1 |
| A | 15 | 239 | 10611 | 59.44 | 811 | 795 | 165.1 |
| B | 11 | 51 | 152405 | 982.98 | 818 | 799 | 154.2 |
| B | 0 | 214 | 43769 | 278.61 | 818 | 799 | 154.2 |
| B | 4 | 81 | 31663 | 200.11 | 818 | 799 | 154.2 |
| C | 9 | 68 | 56373 | 308.12 | 784 | 787 | 180.4 |
| C | 1 | 16 | 7425 | 36.79 | 784 | 787 | 180.4 |
| C | 13 | 61 | 6046 | 29.15 | 784 | 787 | 180.4 |
| D | 14 | 34 | 95536 | 497.79 | 784 | 760 | 190.4 |
| D | 2 | 14 | 56592 | 293.25 | 784 | 760 | 190.4 |
| D | 0 | 11 | 19509 | 98.48 | 784 | 760 | 190.4 |
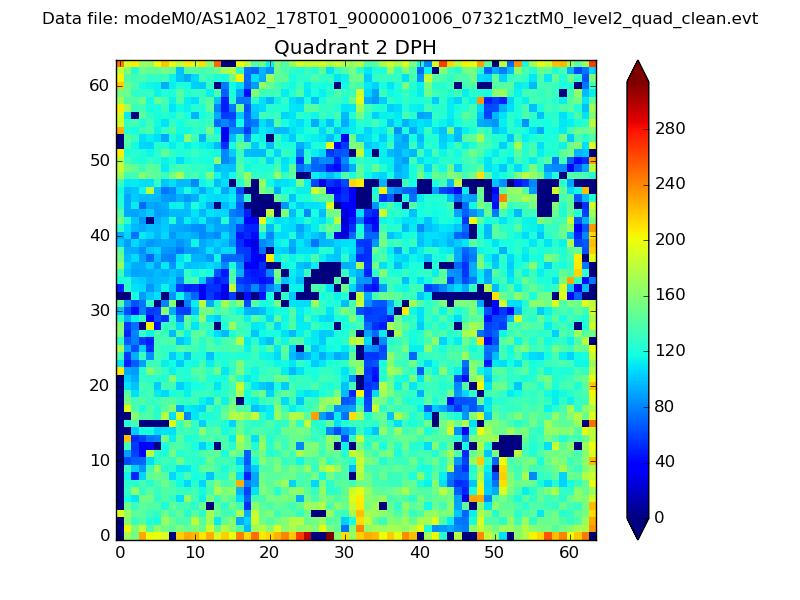
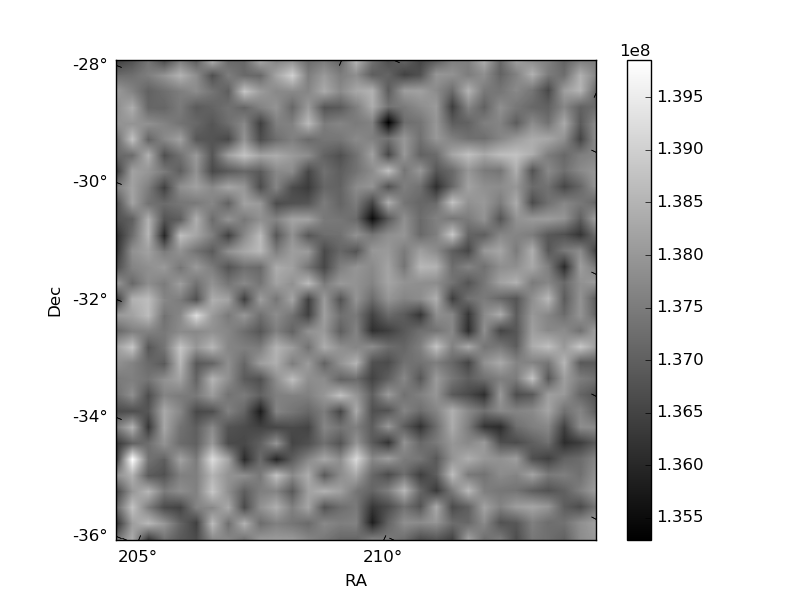
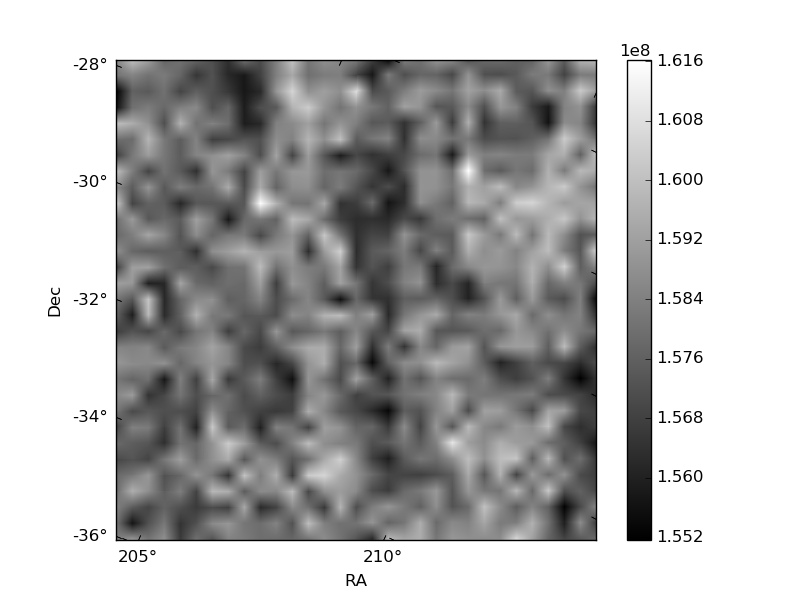
Histogram calculated using DETX and DETY for each event in the final _common_clean file
| Quadrant A | 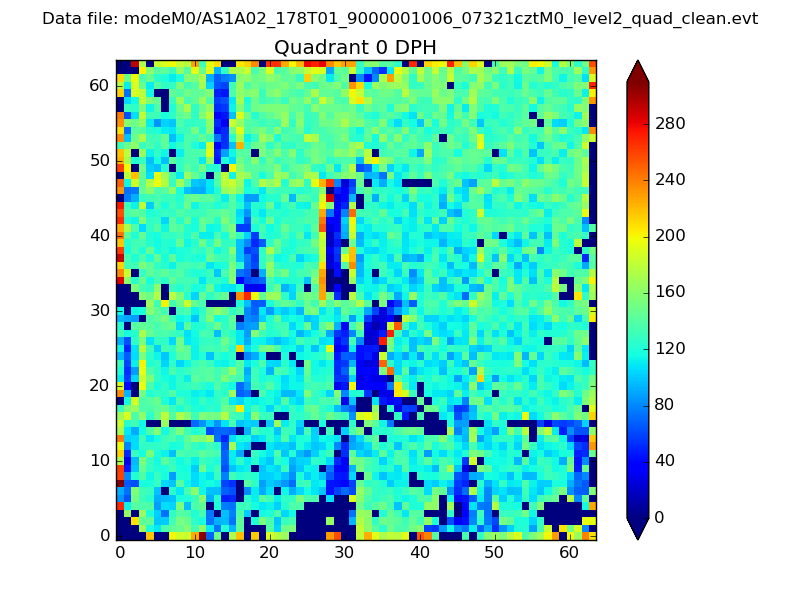 |
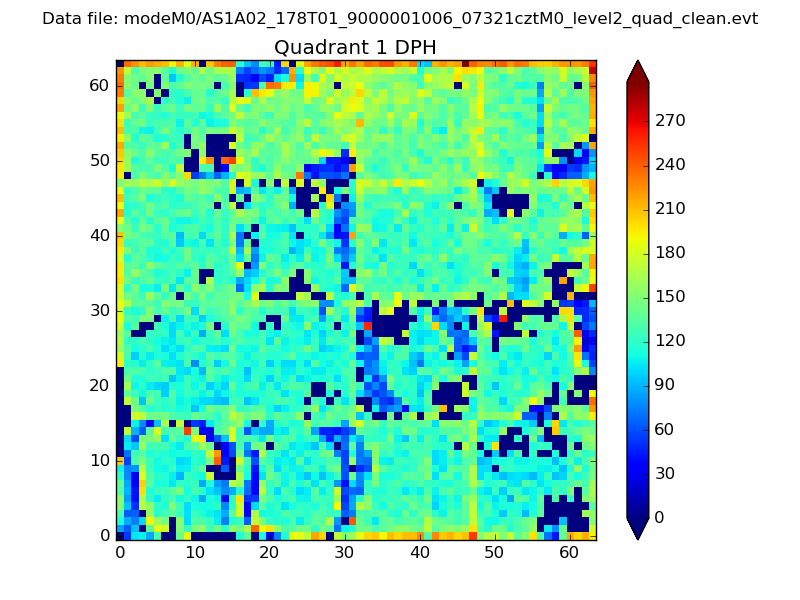 |
Quadrant B |
|---|---|---|---|
| Quadrant D | 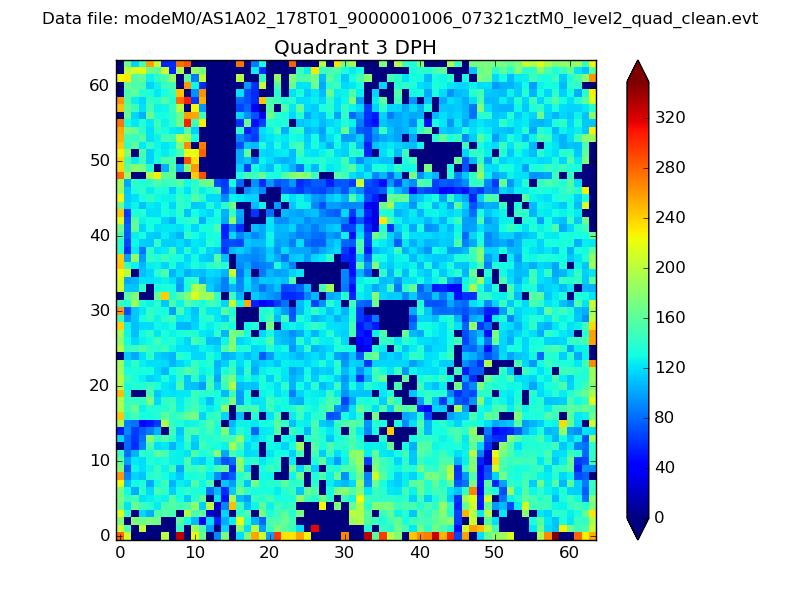 |
 |
Quadrant C |
| Plot type | Count rate plots | Images |
|---|---|---|
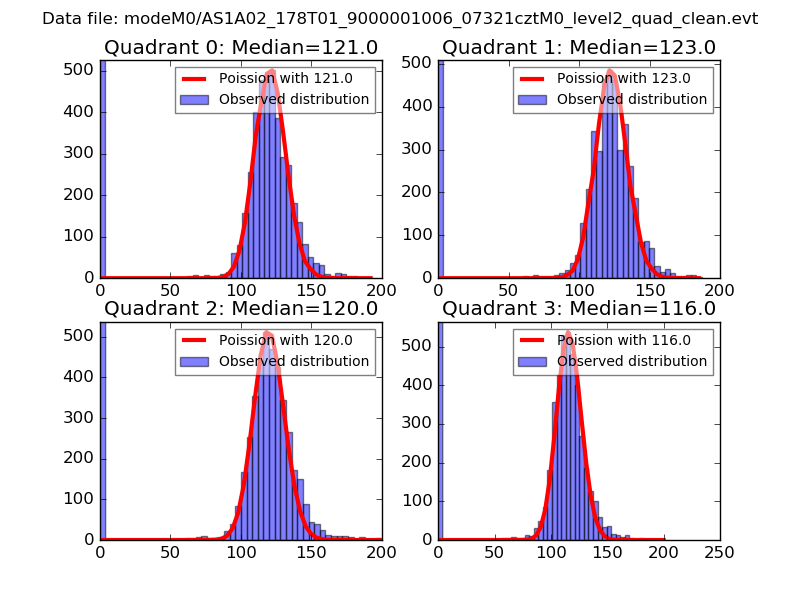
| Comparison with Poisson distribution Blue bars denote a histogram of data divided into 1 sec bins. Red curve is a Poisson curve with rate = median count rate of data. |
 |
 |
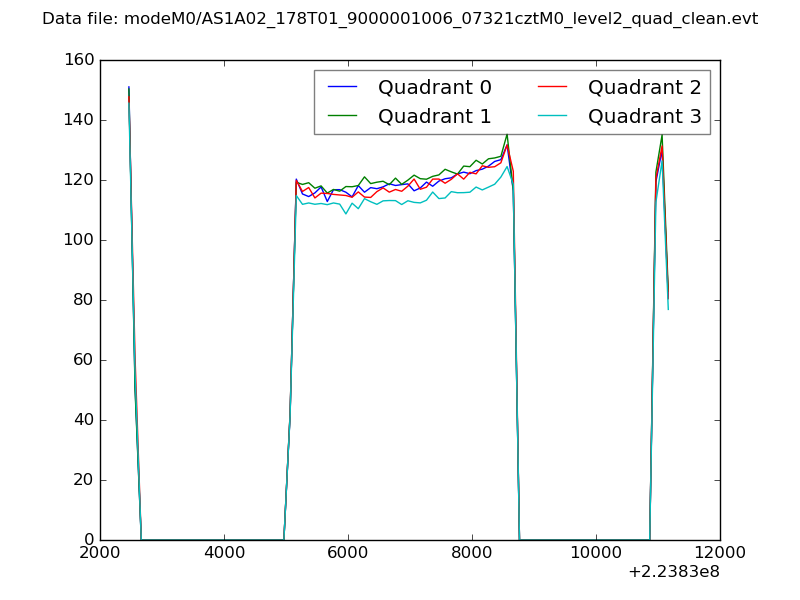
| Quadrant-wise count rates Data is divided into 100 sec bins |
 |
|
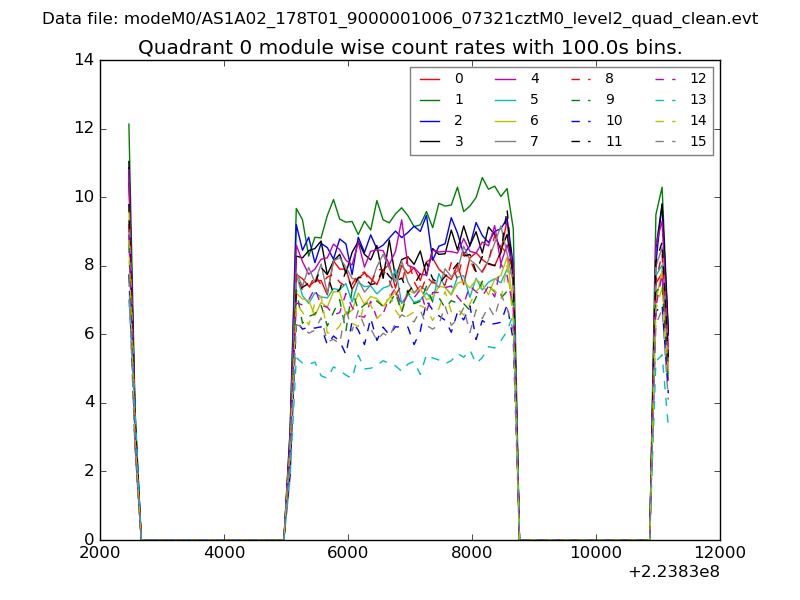
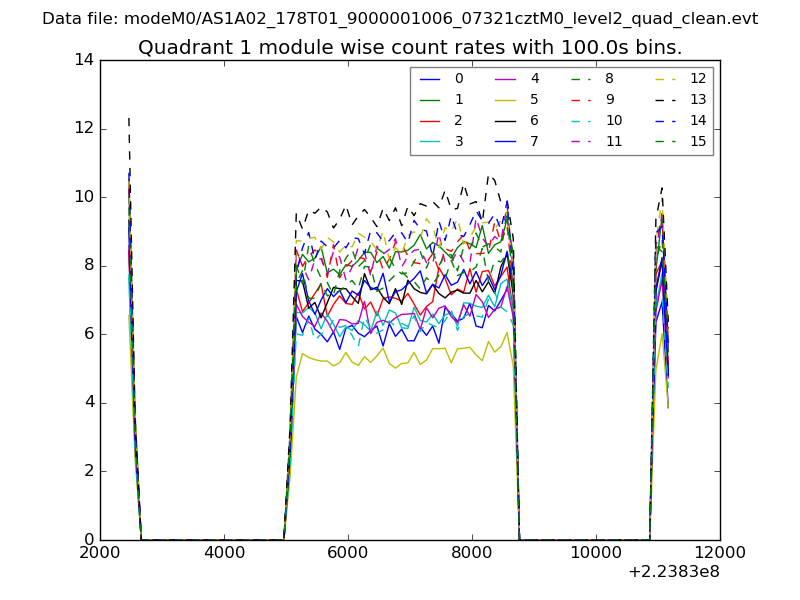
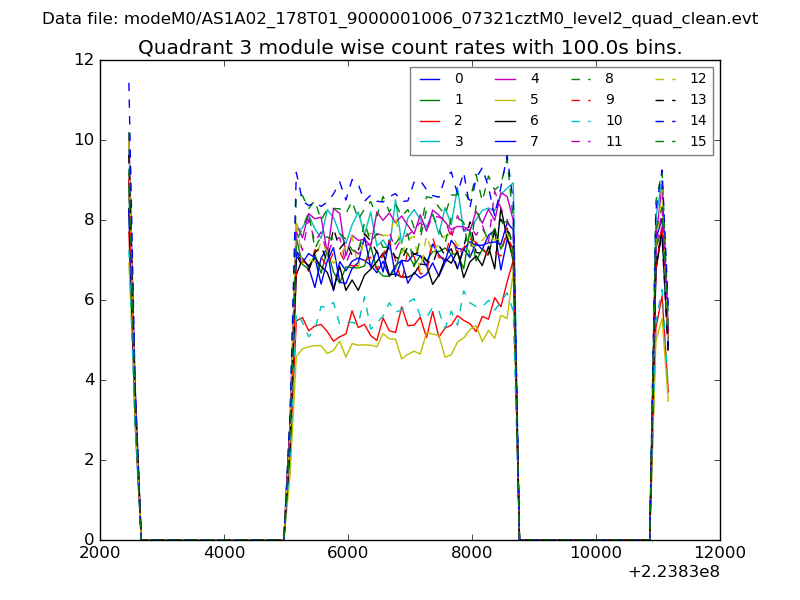
| Module-wise count rates for Quadrant A Data is divided into 100 sec bins |
 |
 |
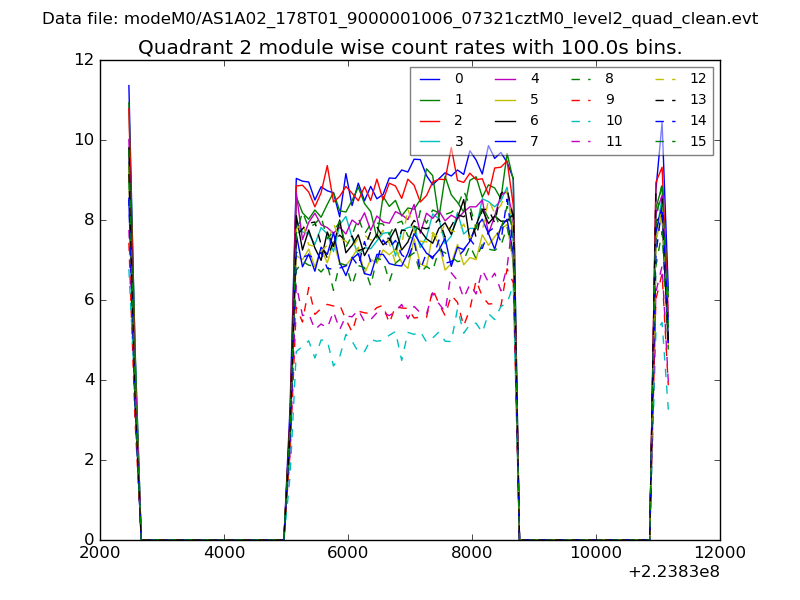
| Module-wise count rates for Quadrant B Data is divided into 100 sec bins |
 |
 |
| Module-wise count rates for Quadrant C Data is divided into 100 sec bins |
 |
 |
| Module-wise count rates for Quadrant D Data is divided into 100 sec bins |
 |
 |
| Parameter | Plot |
|---|---|
| CZT HV Monitor | 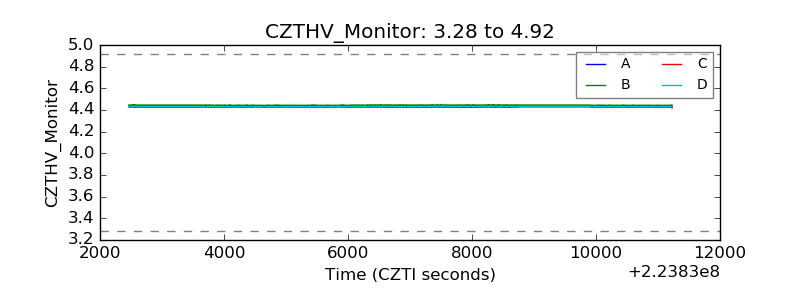 |
| D_VDD | 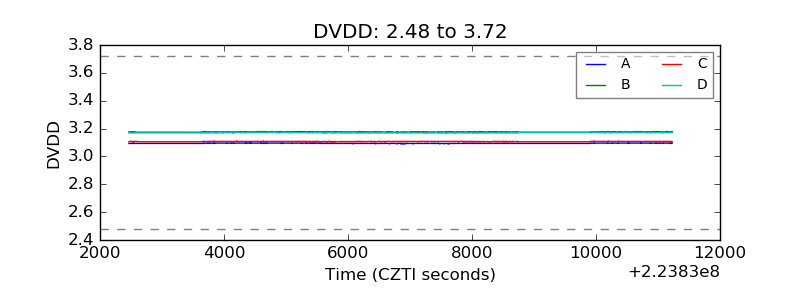 |
| Temperature 1 | 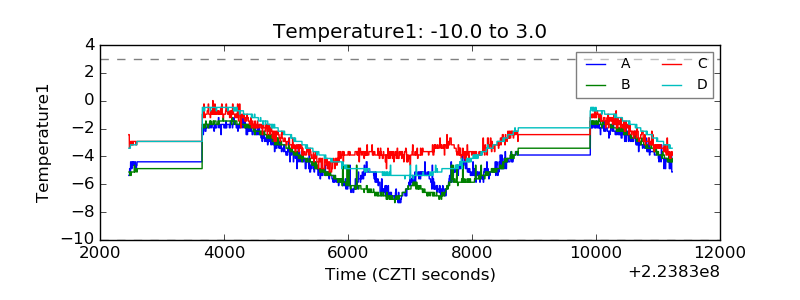 |
| Veto HV Monitor | 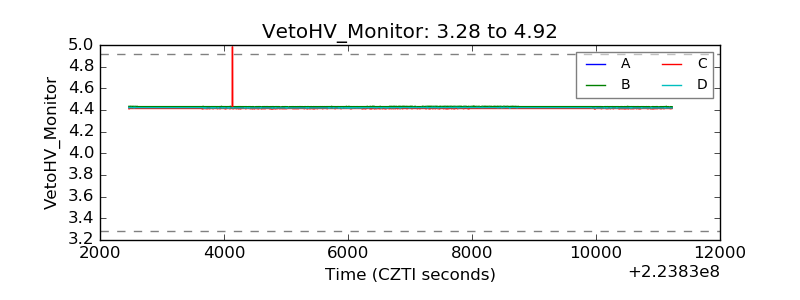 |
| Veto LLD | 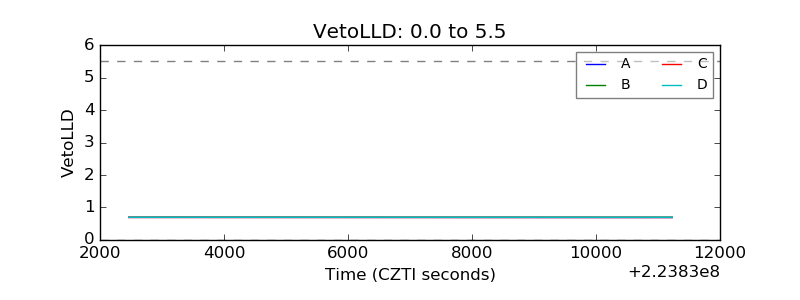 |
| Alpha Counter | 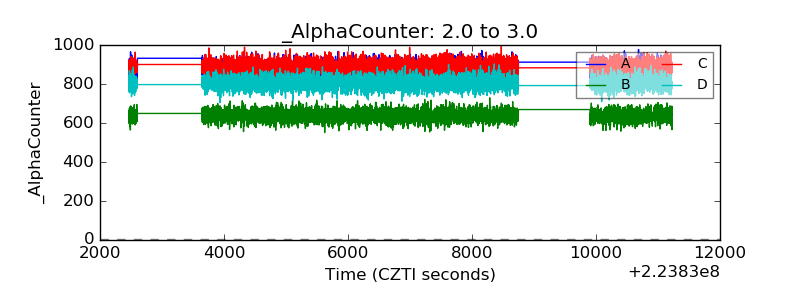 |
| _CPM_Rate | 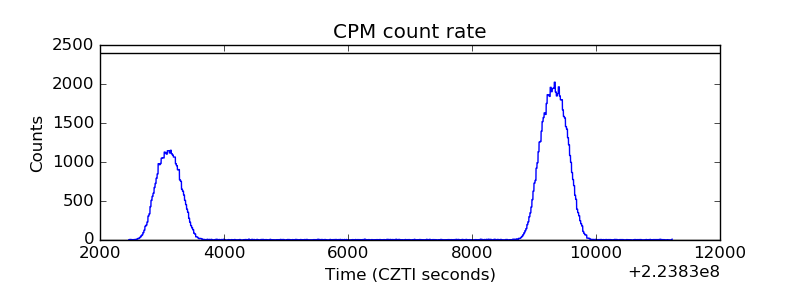 |
| CZT Counter | 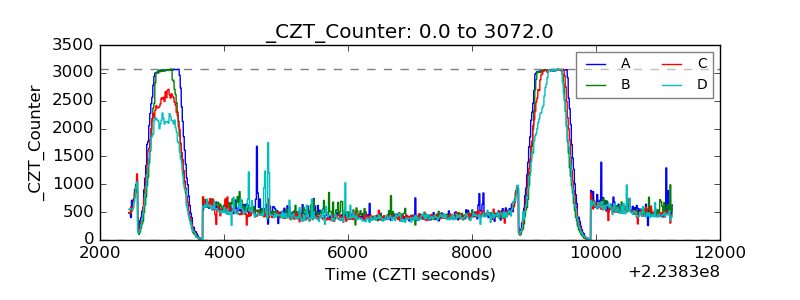 |
| +2.5 Volts monitor | 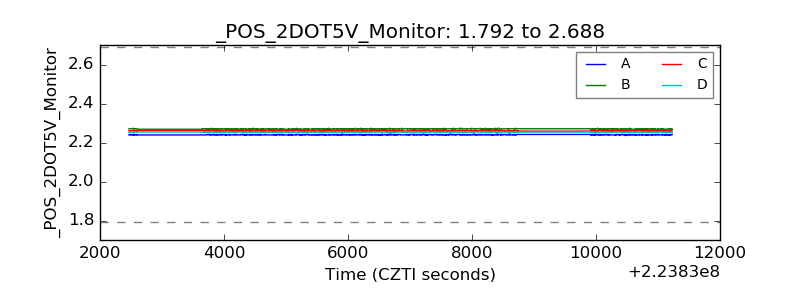 |
| +5 Volts monitor |  |
| _ROLL_ROT | 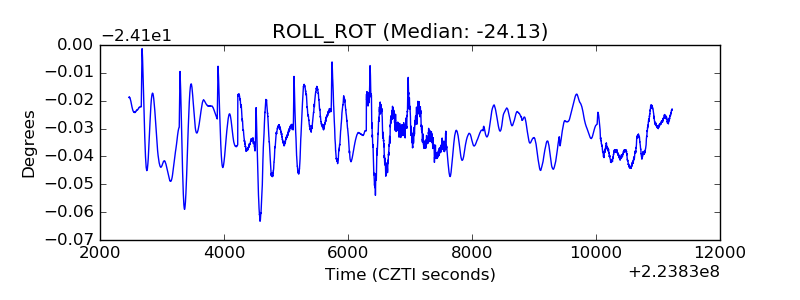 |
| _Roll_DEC | 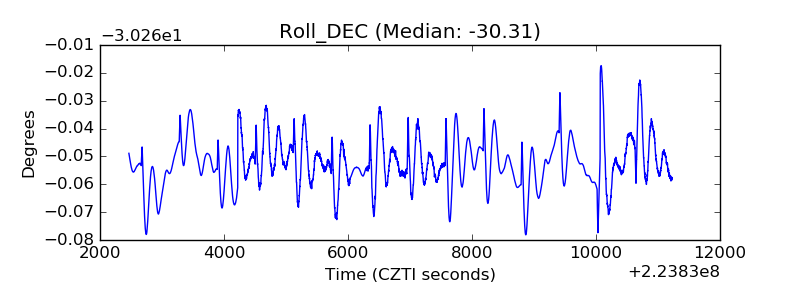 |
| _Roll_RA | 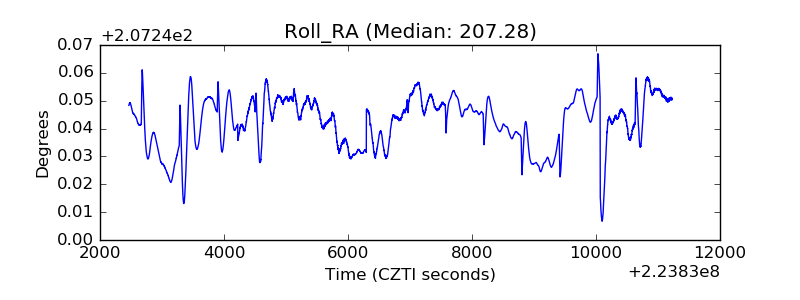 |
| Veto Counter | 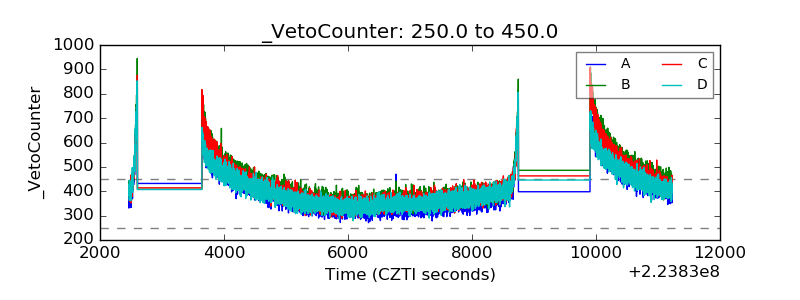 |