| Param | Original file | Final file |
|---|---|---|
| Filename | modeM0/AS1A02_178T01_9000001006_07322cztM0_level2.evt | modeM0/AS1A02_178T01_9000001006_07322cztM0_level2_quad_clean.evt |
| Size (bytes) | 436,060,800 | 86,330,880 |
| Size | 415.9 MB | 82.3 MB |
| Events in quadrant A | 3,488,065 | 544,452 |
| Events in quadrant B | 3,233,067 | 563,530 |
| Events in quadrant C | 3,041,270 | 546,488 |
| Events in quadrant D | 3,016,117 | 520,927 |
| Mode M0 | |||
|---|---|---|---|
| Quadrant | BADHDUFLAG | Total packets | Discarded packets |
| A | 0 | 14572 | 3 |
| B | 0 | 13774 | 2 |
| C | 0 | 13234 | 2 |
| D | 0 | 13357 | 2 |
| Mode SS | |||
|---|---|---|---|
| Quadrant | BADHDUFLAG | Total packets | Discarded packets |
| A | 0 | 130 | 0 |
| B | 0 | 130 | 0 |
| C | 0 | 130 | 0 |
| D | 0 | 130 | 0 |
| Mode M9 | |||
|---|---|---|---|
| Quadrant | BADHDUFLAG | Total packets | Discarded packets |
| A | 0 | 24 | 0 |
| B | 0 | 24 | 0 |
| C | 0 | 24 | 0 |
| D | 0 | 24 | 0 |
| Quadrant | Total seconds | Saturated seconds | Saturation percentage |
|---|---|---|---|
| A | 6287 | 248 | 3.944648% |
| B | 6287 | 92 | 1.463337% |
| C | 6287 | 64 | 1.017974% |
| D | 6287 | 62 | 0.986162% |
Noise dominated data is calculated using 1-second bins in cleaned event files. If a bin has >2000 counts, and if more than 50% of those come from <1% of pixels, then it is considered to be noise-dominated and hence unusable.
| Quadrant | # 1 sec bins | Bins with >0 counts | Bins with >2000 counts | High rate bins dominated by noise | Noise dominated (total time) | Noise dominated (detector-on time) | Marked lightcurve |
|---|---|---|---|---|---|---|---|
| A | 8702 | 6288 | 71 | 71 | 0.82% | 1.13% | 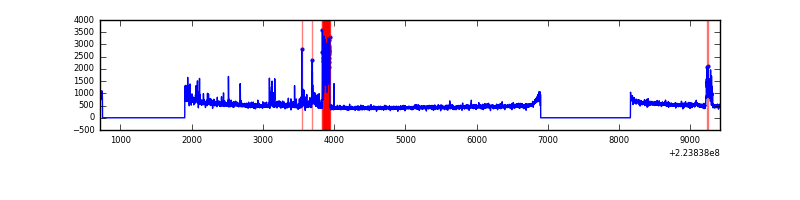 |
| B | 8702 | 6287 | 4 | 4 | 0.05% | 0.06% | 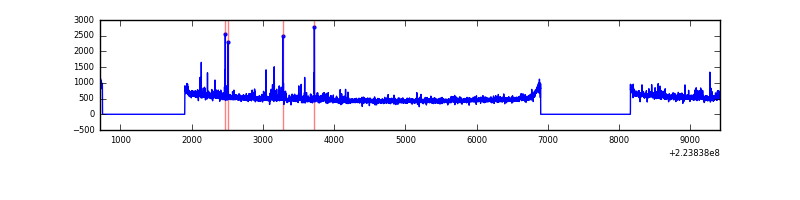 |
| C | 8702 | 6289 | 4 | 4 | 0.05% | 0.06% | 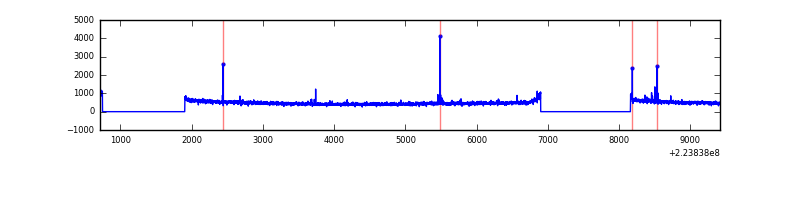 |
| D | 8702 | 6288 | 11 | 11 | 0.13% | 0.17% | 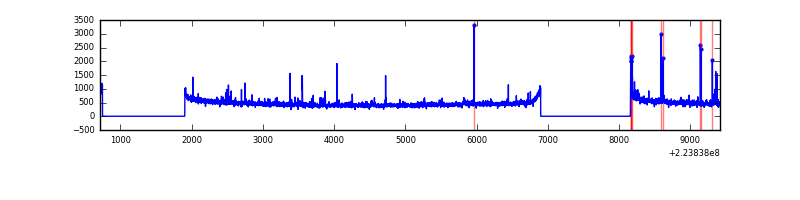 |
Top three noisy pixels from each quadrant. If the there are fewer than three noisy pixels in the level2.evt file, extra rows are filled as -1
| Pixel properties | Quadrant properties | ||||||
|---|---|---|---|---|---|---|---|
| Quadrant | DetID | PixID | Counts | Sigma | Mean | Median | Sigma |
| A | 13 | 240 | 207920 | 1296.31 | 783 | 767 | 159.8 |
| A | 8 | 15 | 179988 | 1121.52 | 783 | 767 | 159.8 |
| A | 14 | 111 | 82461 | 511.22 | 783 | 767 | 159.8 |
| B | 11 | 51 | 66351 | 437.22 | 796 | 780 | 150.0 |
| B | 0 | 214 | 38103 | 248.87 | 796 | 780 | 150.0 |
| B | 4 | 81 | 21112 | 135.57 | 796 | 780 | 150.0 |
| C | 9 | 68 | 39498 | 221.83 | 761 | 767 | 174.6 |
| C | 1 | 16 | 23490 | 130.14 | 761 | 767 | 174.6 |
| C | 14 | 234 | 6106 | 30.58 | 761 | 767 | 174.6 |
| D | 2 | 14 | 41556 | 221.72 | 757 | 737 | 184.1 |
| D | 12 | 233 | 38009 | 202.45 | 757 | 737 | 184.1 |
| D | 2 | 216 | 21289 | 111.63 | 757 | 737 | 184.1 |
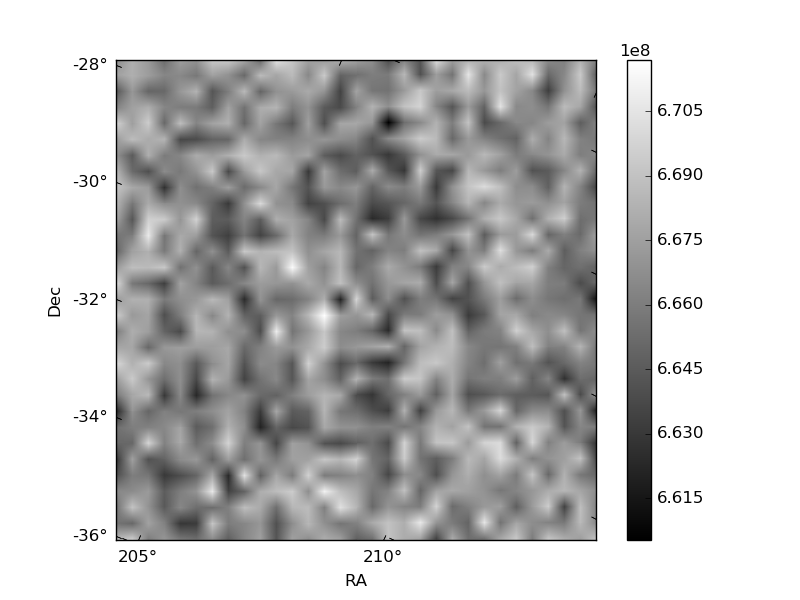
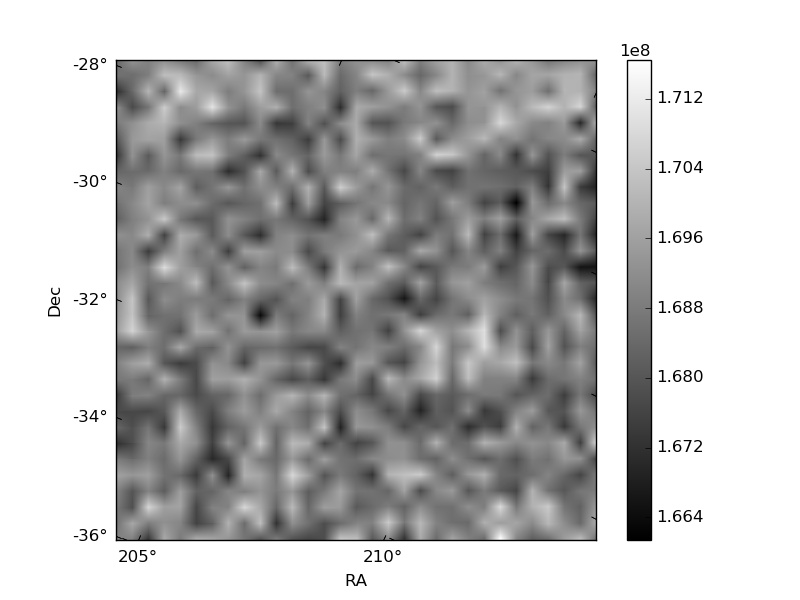
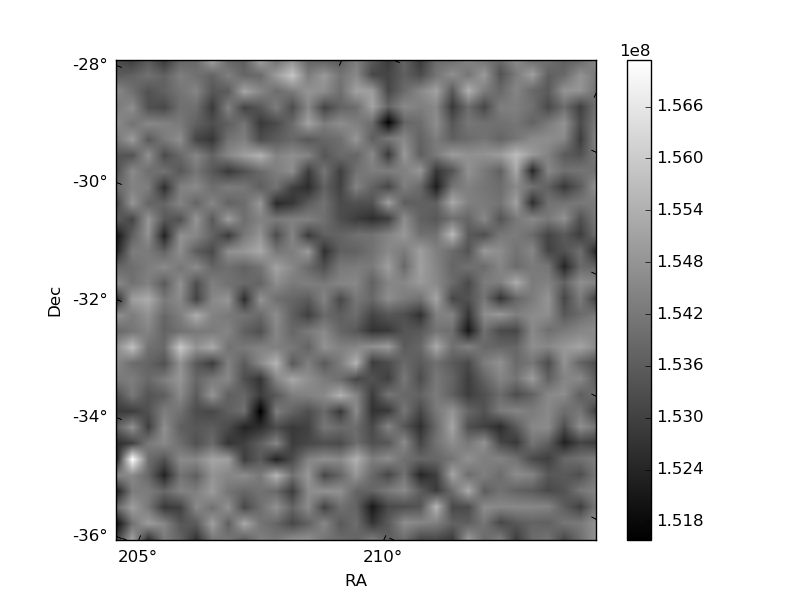
Histogram calculated using DETX and DETY for each event in the final _common_clean file
| Quadrant A | 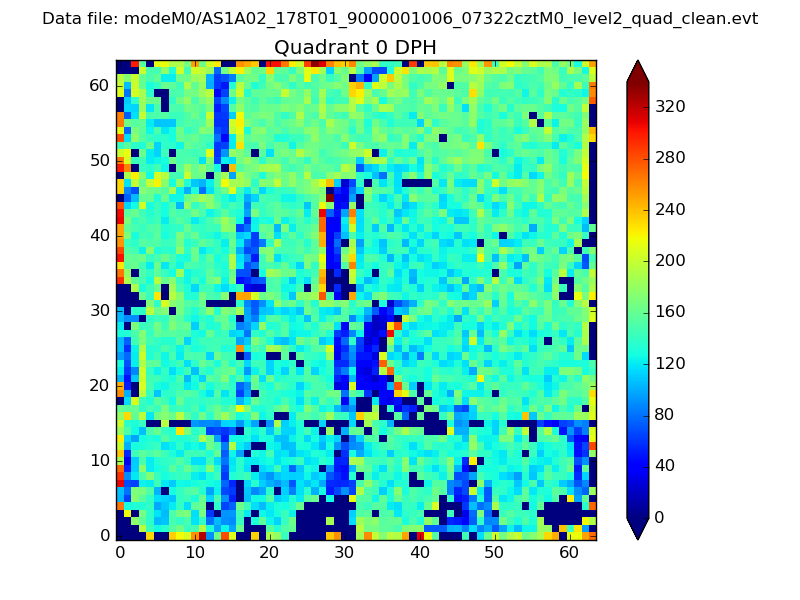 |
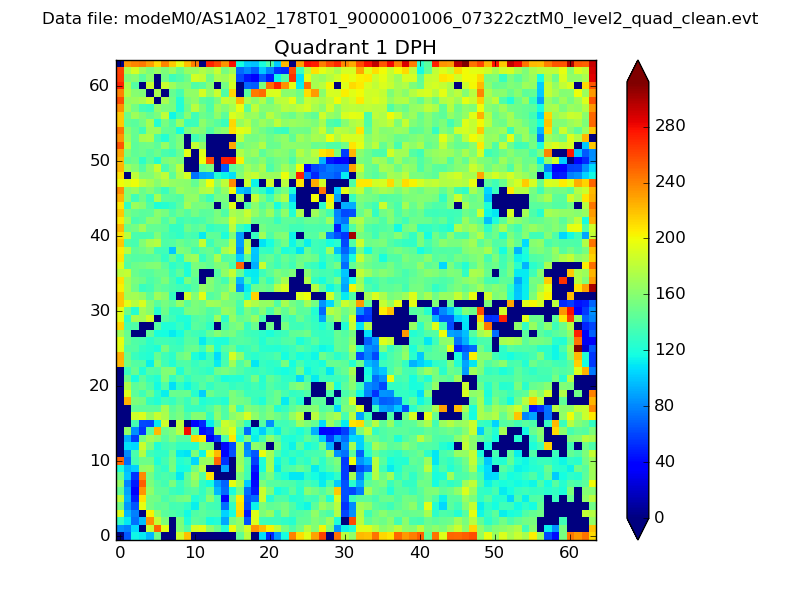 |
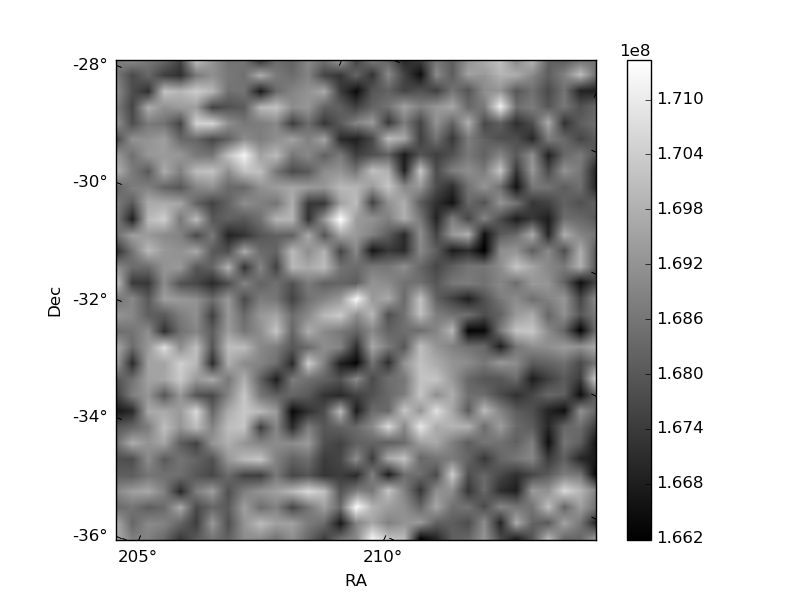
Quadrant B |
|---|---|---|---|
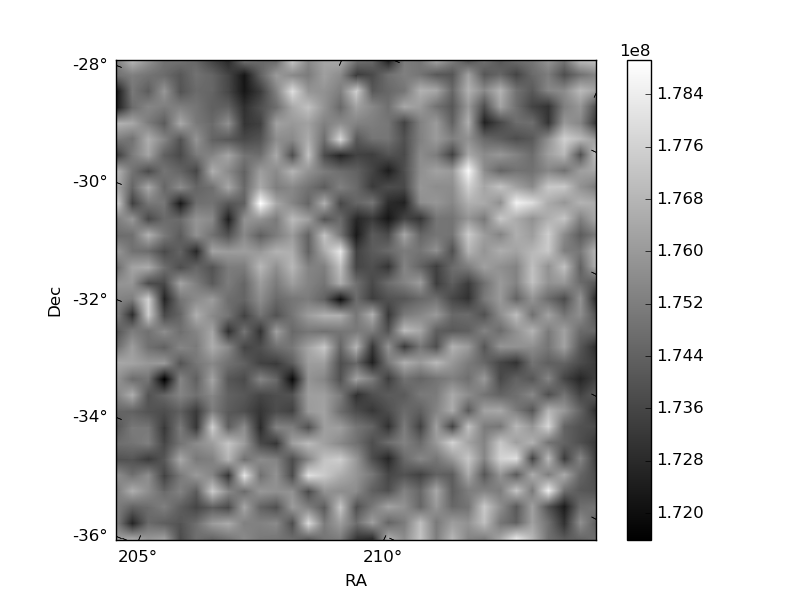
| Quadrant D | 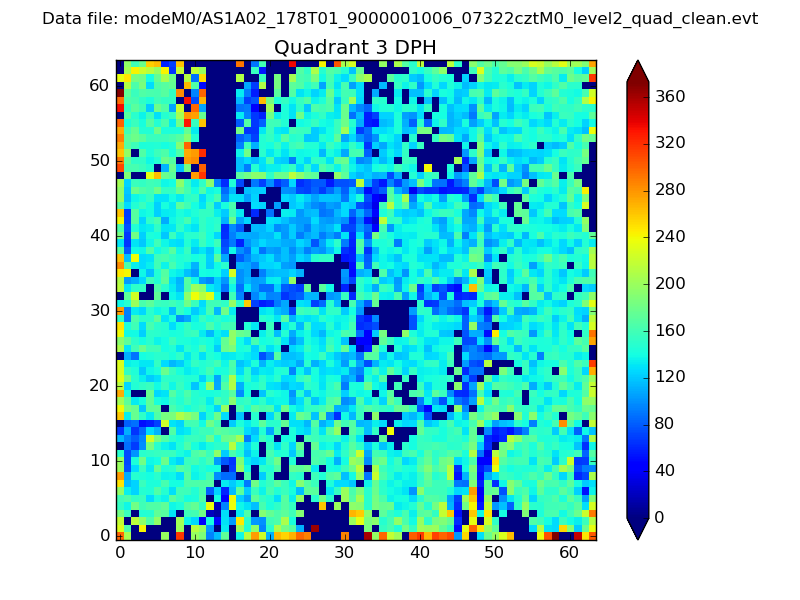 |
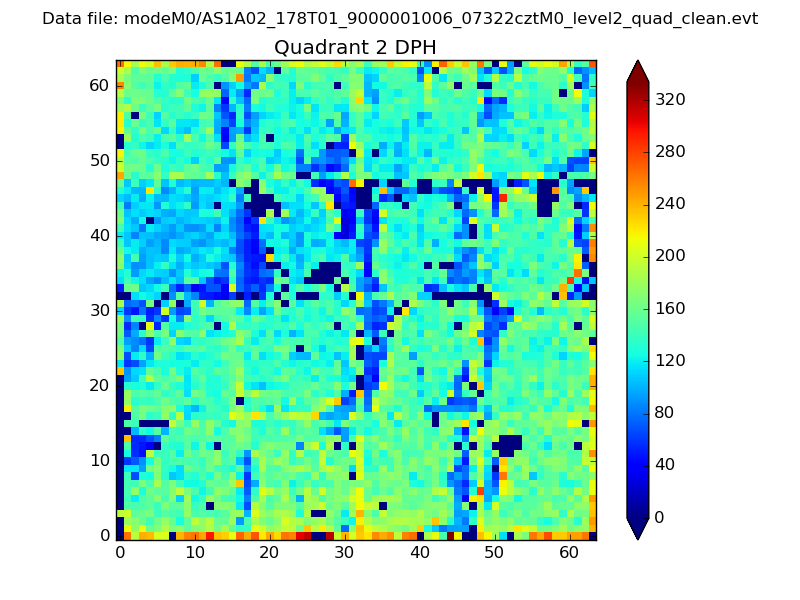 |
Quadrant C |
| Plot type | Count rate plots | Images |
|---|---|---|
| Comparison with Poisson distribution Blue bars denote a histogram of data divided into 1 sec bins. Red curve is a Poisson curve with rate = median count rate of data. |
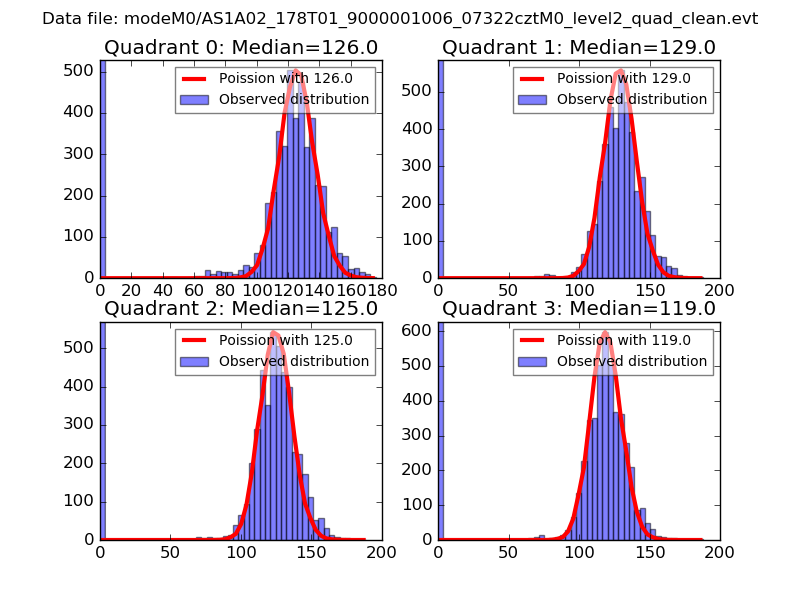 |
 |
| Quadrant-wise count rates Data is divided into 100 sec bins |
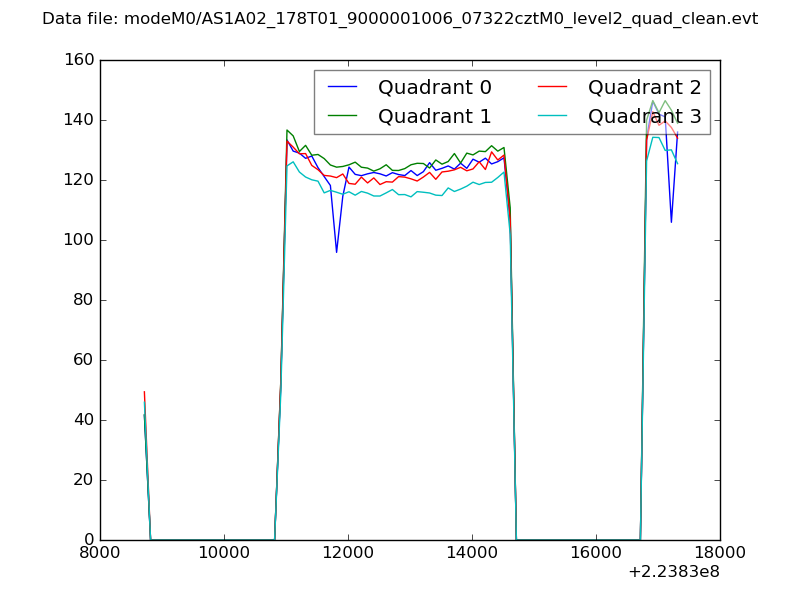 |
|
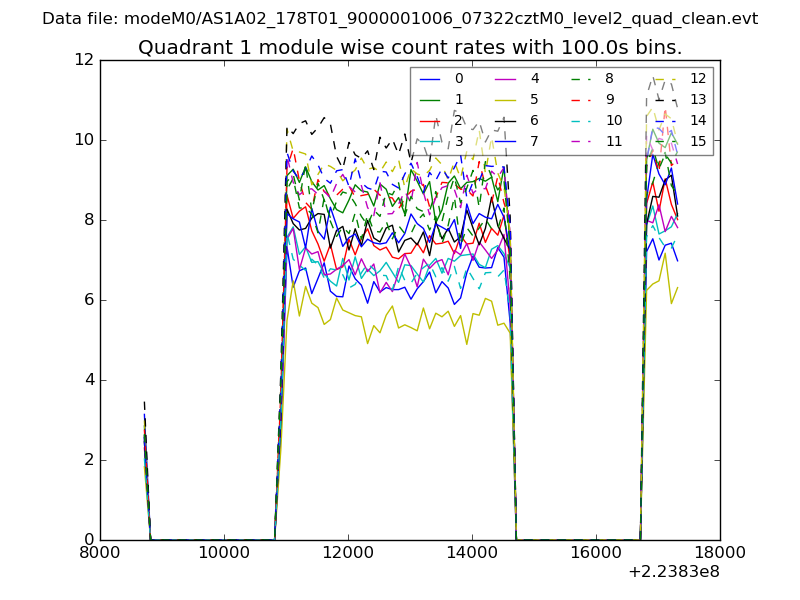
| Module-wise count rates for Quadrant A Data is divided into 100 sec bins |
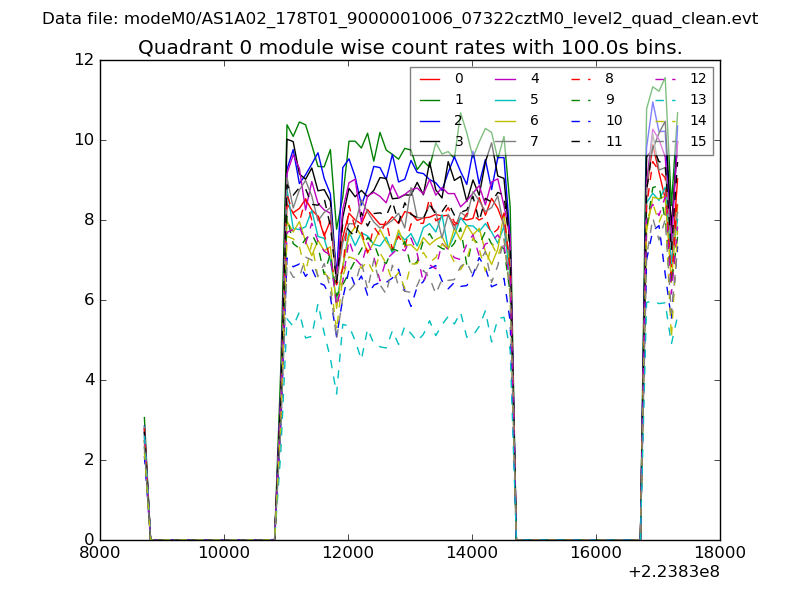 |
 |
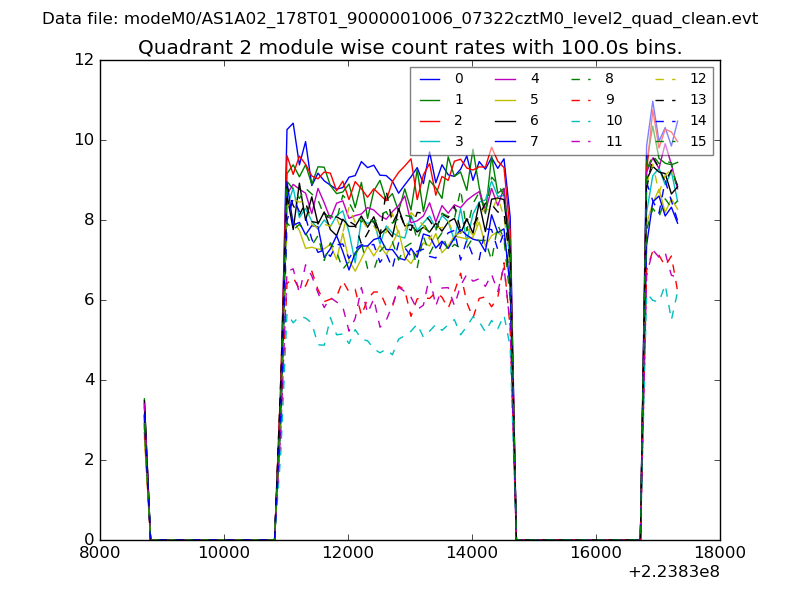
| Module-wise count rates for Quadrant B Data is divided into 100 sec bins |
 |
 |
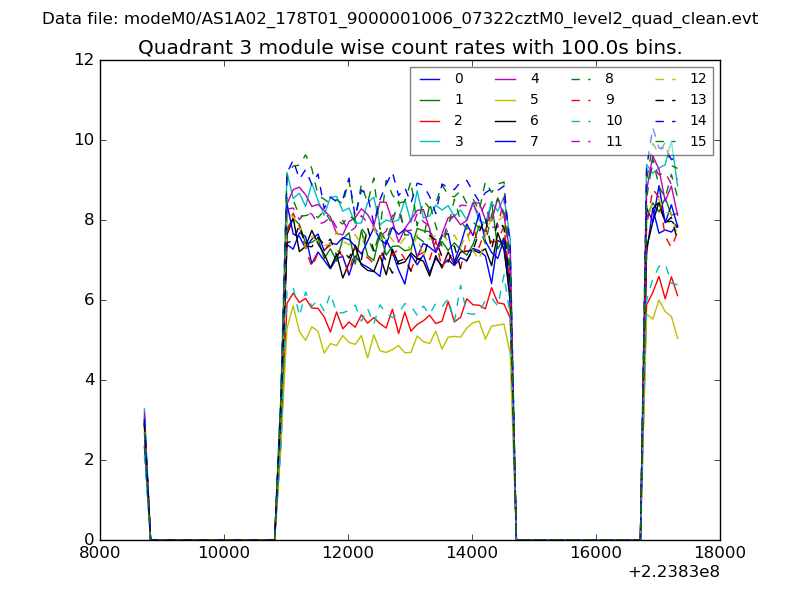
| Module-wise count rates for Quadrant C Data is divided into 100 sec bins |
 |
 |
| Module-wise count rates for Quadrant D Data is divided into 100 sec bins |
 |
 |
| Parameter | Plot |
|---|---|
| CZT HV Monitor | 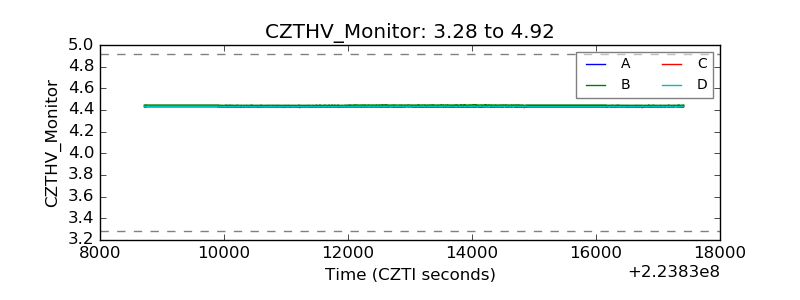 |
| D_VDD | 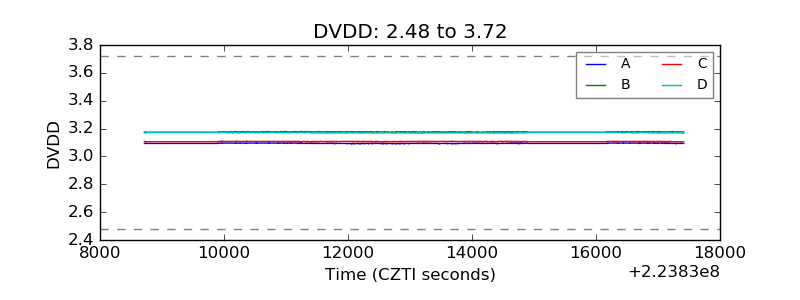 |
| Temperature 1 | 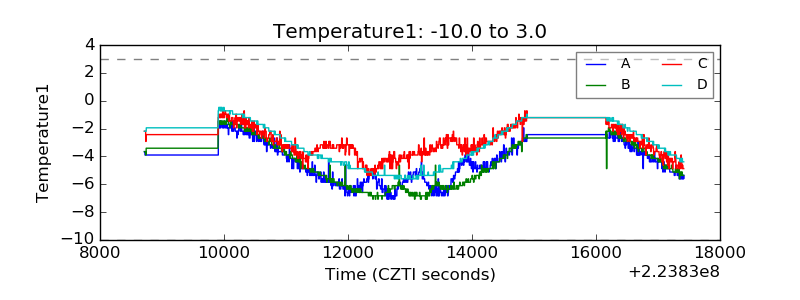 |
| Veto HV Monitor | 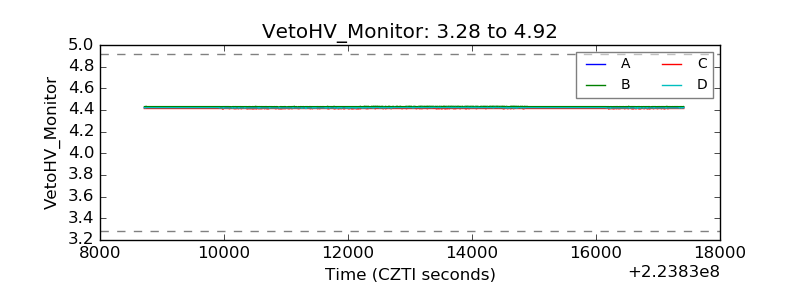 |
| Veto LLD | 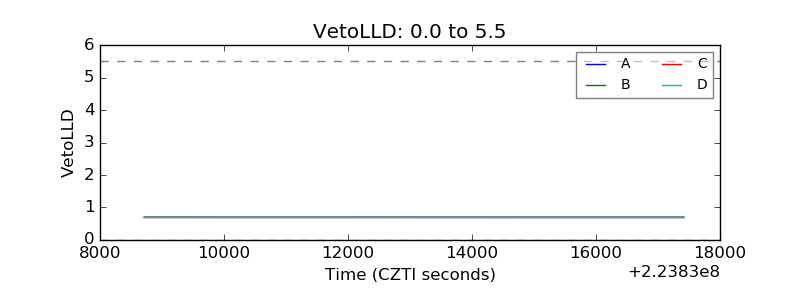 |
| Alpha Counter | 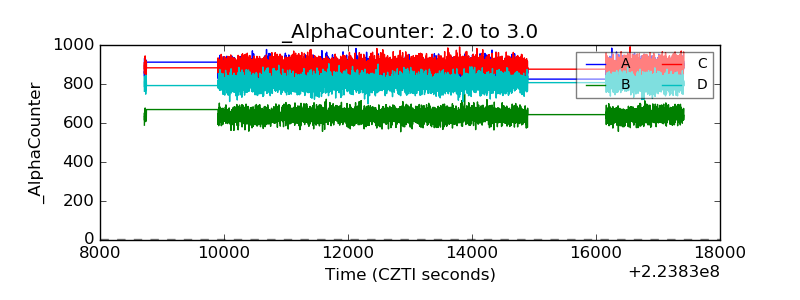 |
| _CPM_Rate | 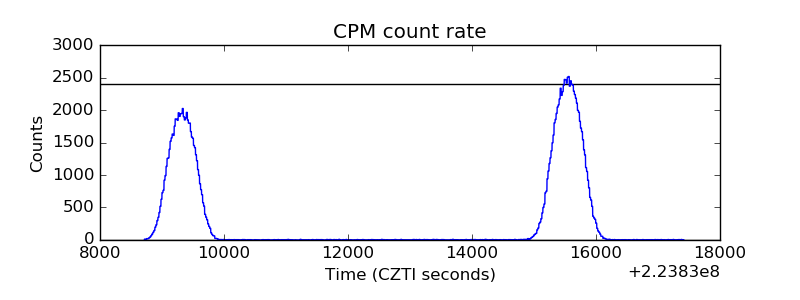 |
| CZT Counter | 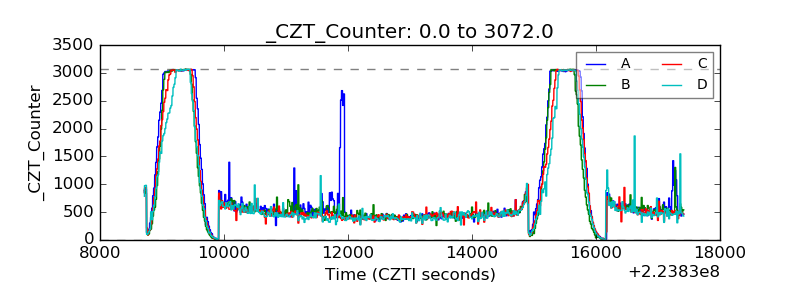 |
| +2.5 Volts monitor |  |
| +5 Volts monitor |  |
| _ROLL_ROT | 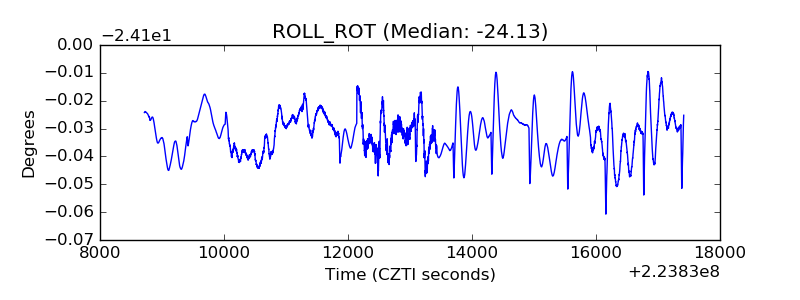 |
| _Roll_DEC | 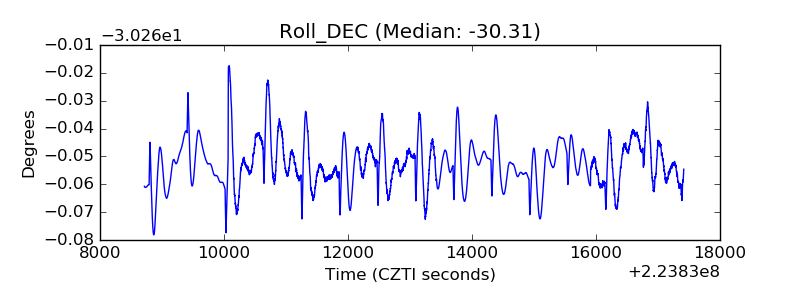 |
| _Roll_RA | 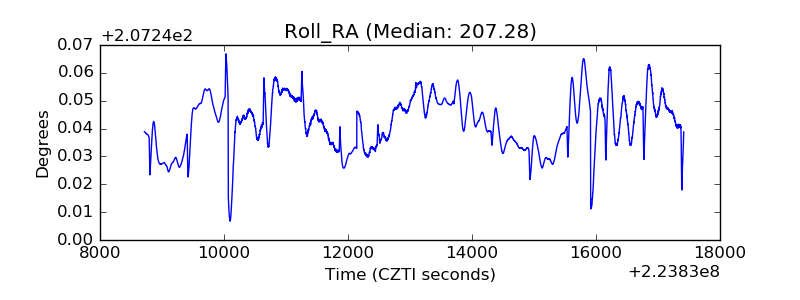 |
| Veto Counter | 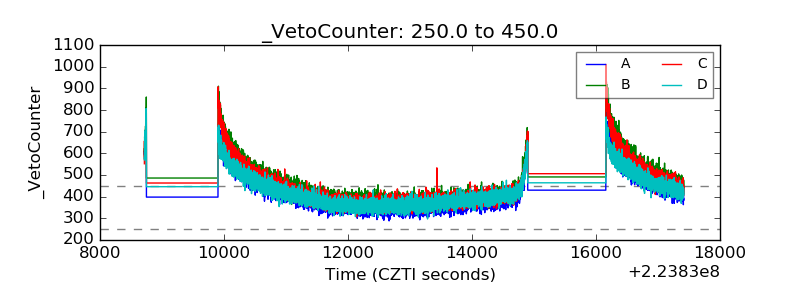 |