| Param | Original file | Final file |
|---|---|---|
| Filename | modeM0/AS1A02_178T01_9000001006_07323cztM0_level2.evt | modeM0/AS1A02_178T01_9000001006_07323cztM0_level2_quad_clean.evt |
| Size (bytes) | 1,453,674,240 | 299,805,120 |
| Size | 1.4 GB | 285.9 MB |
| Events in quadrant A | 11,337,191 | 1,907,430 |
| Events in quadrant B | 10,780,262 | 1,958,245 |
| Events in quadrant C | 9,952,408 | 1,909,989 |
| Events in quadrant D | 10,498,222 | 1,821,974 |
| Mode M0 | |||
|---|---|---|---|
| Quadrant | BADHDUFLAG | Total packets | Discarded packets |
| A | 0 | 48167 | 6 |
| B | 0 | 46467 | 5 |
| C | 0 | 44474 | 5 |
| D | 0 | 46710 | 5 |
| Mode SS | |||
|---|---|---|---|
| Quadrant | BADHDUFLAG | Total packets | Discarded packets |
| A | 0 | 438 | 0 |
| B | 0 | 438 | 0 |
| C | 0 | 438 | 0 |
| D | 0 | 438 | 0 |
| Mode M9 | |||
|---|---|---|---|
| Quadrant | BADHDUFLAG | Total packets | Discarded packets |
| A | 0 | 47 | 0 |
| B | 0 | 47 | 0 |
| C | 0 | 47 | 0 |
| D | 0 | 48 | 0 |
| Quadrant | Total seconds | Saturated seconds | Saturation percentage |
|---|---|---|---|
| A | 21541 | 446 | 2.070470% |
| B | 21541 | 219 | 1.016666% |
| C | 21541 | 116 | 0.538508% |
| D | 21541 | 245 | 1.137366% |
Noise dominated data is calculated using 1-second bins in cleaned event files. If a bin has >2000 counts, and if more than 50% of those come from <1% of pixels, then it is considered to be noise-dominated and hence unusable.
| Quadrant | # 1 sec bins | Bins with >0 counts | Bins with >2000 counts | High rate bins dominated by noise | Noise dominated (total time) | Noise dominated (detector-on time) | Marked lightcurve |
|---|---|---|---|---|---|---|---|
| A | 26410 | 21542 | 152 | 152 | 0.58% | 0.71% |  |
| B | 26410 | 21542 | 10 | 10 | 0.04% | 0.05% |  |
| C | 26410 | 21543 | 4 | 4 | 0.02% | 0.02% | 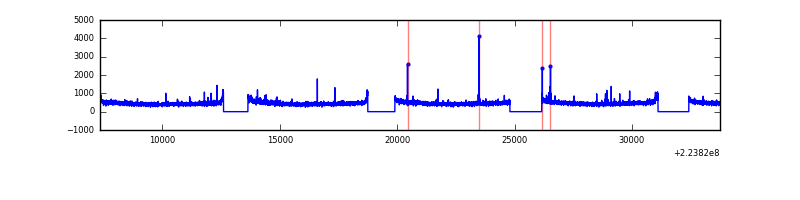 |
| D | 26410 | 21543 | 125 | 125 | 0.47% | 0.58% |  |
Top three noisy pixels from each quadrant. If the there are fewer than three noisy pixels in the level2.evt file, extra rows are filled as -1
| Pixel properties | Quadrant properties | ||||||
|---|---|---|---|---|---|---|---|
| Quadrant | DetID | PixID | Counts | Sigma | Mean | Median | Sigma |
| A | 8 | 15 | 760281 | 1467.95 | 2569 | 2520 | 516.2 |
| A | 14 | 111 | 298243 | 572.88 | 2569 | 2520 | 516.2 |
| A | 13 | 240 | 231590 | 443.76 | 2569 | 2520 | 516.2 |
| B | 11 | 51 | 260729 | 531.87 | 2611 | 2552 | 485.4 |
| B | 0 | 214 | 163748 | 332.08 | 2611 | 2552 | 485.4 |
| B | 4 | 81 | 103512 | 207.99 | 2611 | 2552 | 485.4 |
| C | 9 | 68 | 110590 | 188.09 | 2510 | 2525 | 574.5 |
| C | 1 | 16 | 38568 | 62.73 | 2510 | 2525 | 574.5 |
| C | 13 | 61 | 19424 | 29.41 | 2510 | 2525 | 574.5 |
| D | 14 | 34 | 374358 | 616.82 | 2489 | 2415 | 603.0 |
| D | 12 | 233 | 211867 | 347.35 | 2489 | 2415 | 603.0 |
| D | 2 | 14 | 197181 | 323.0 | 2489 | 2415 | 603.0 |
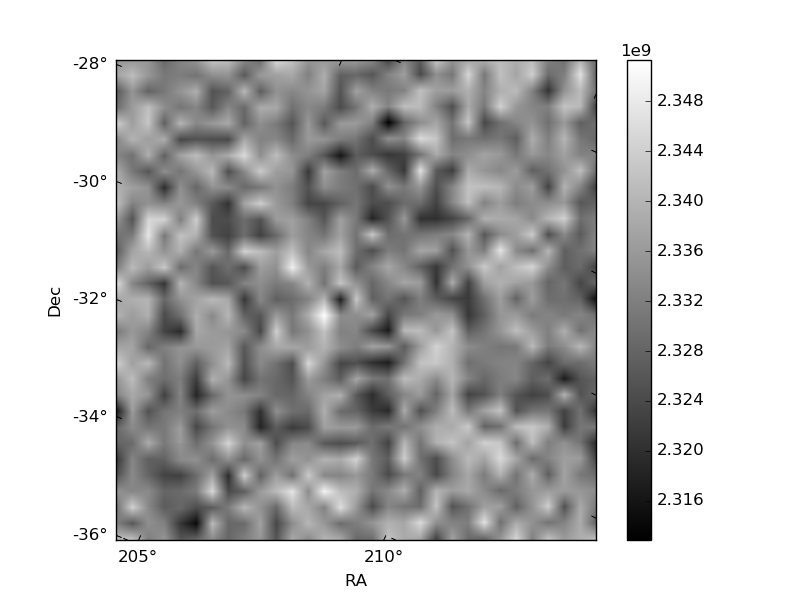
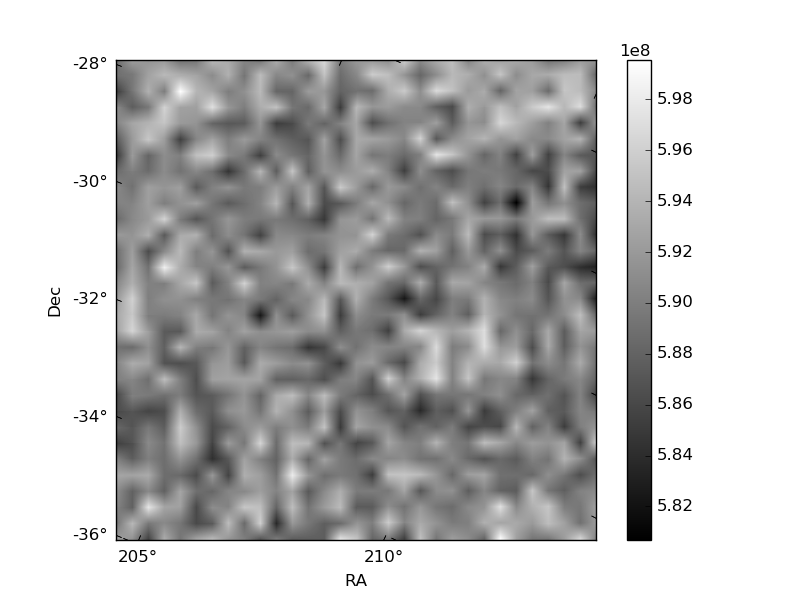
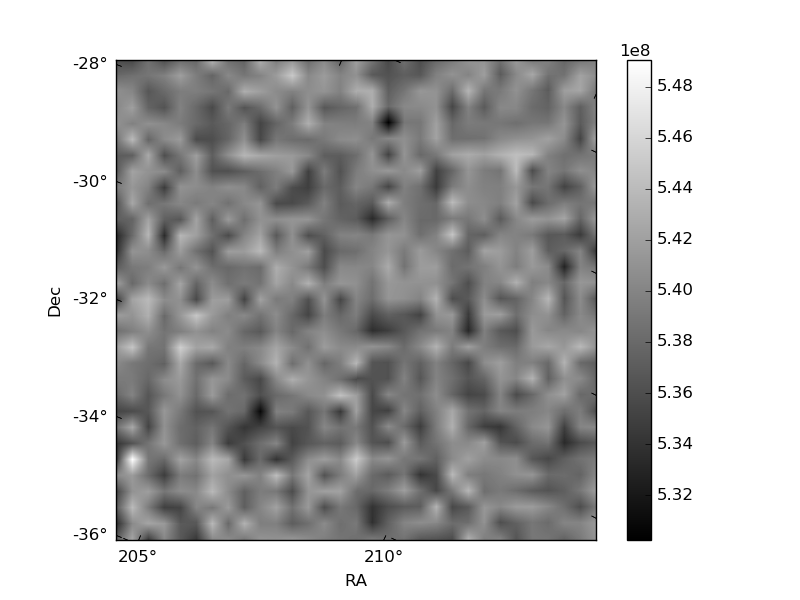
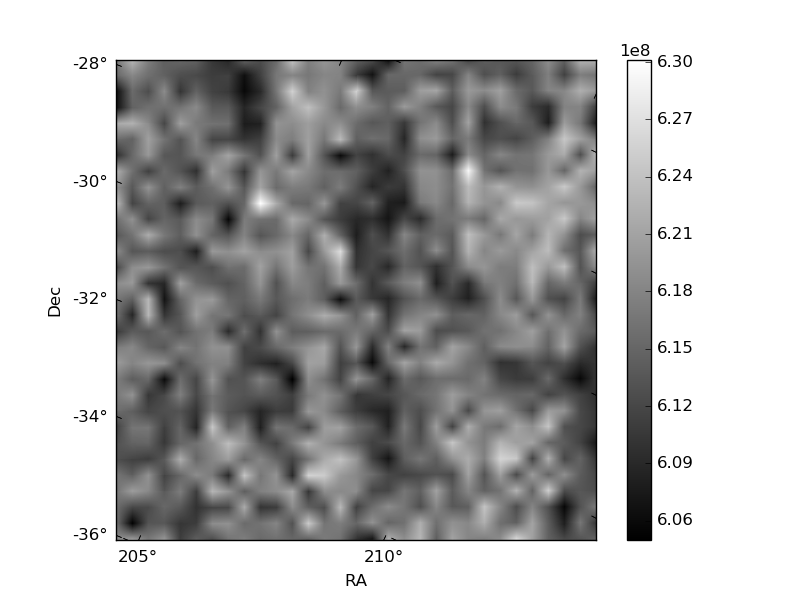
Histogram calculated using DETX and DETY for each event in the final _common_clean file
| Quadrant A | 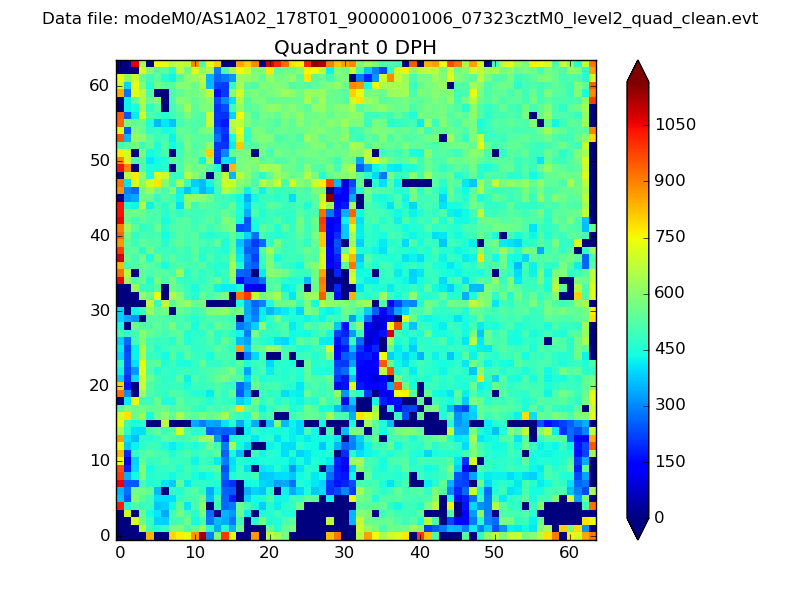 |
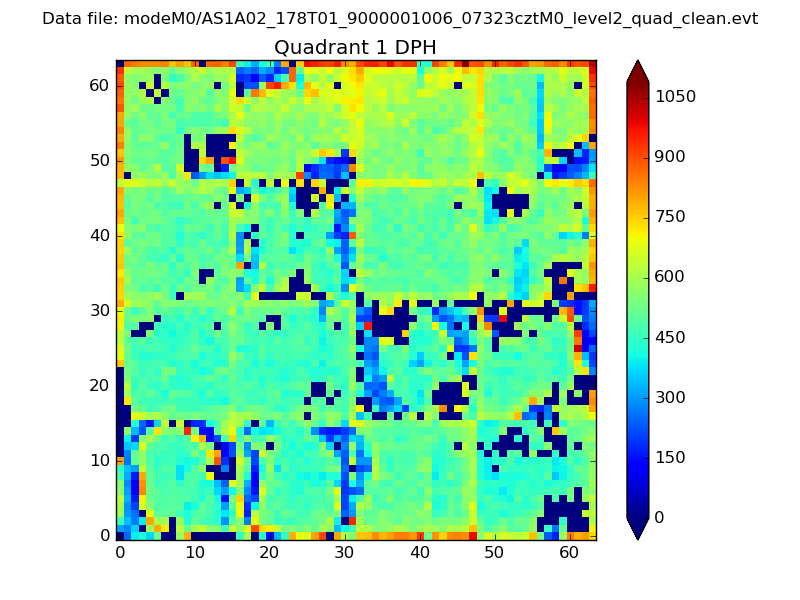 |
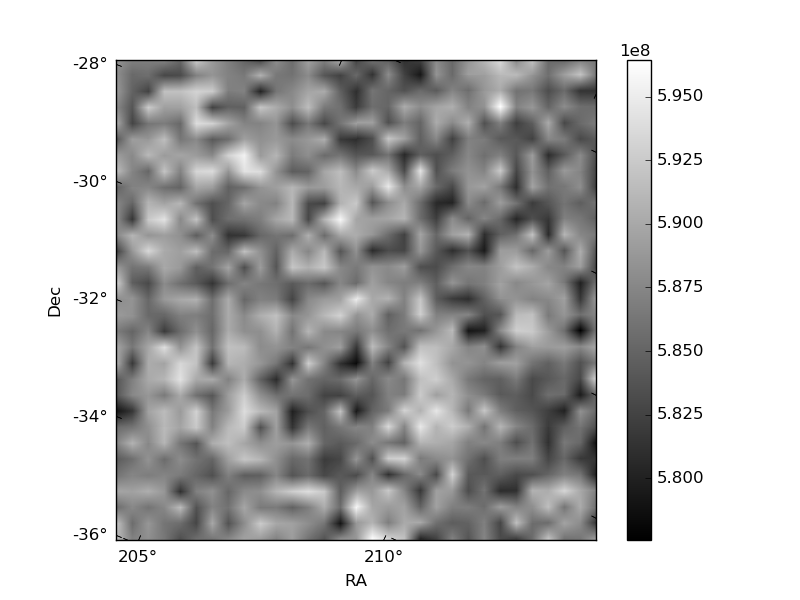
Quadrant B |
|---|---|---|---|
| Quadrant D |  |
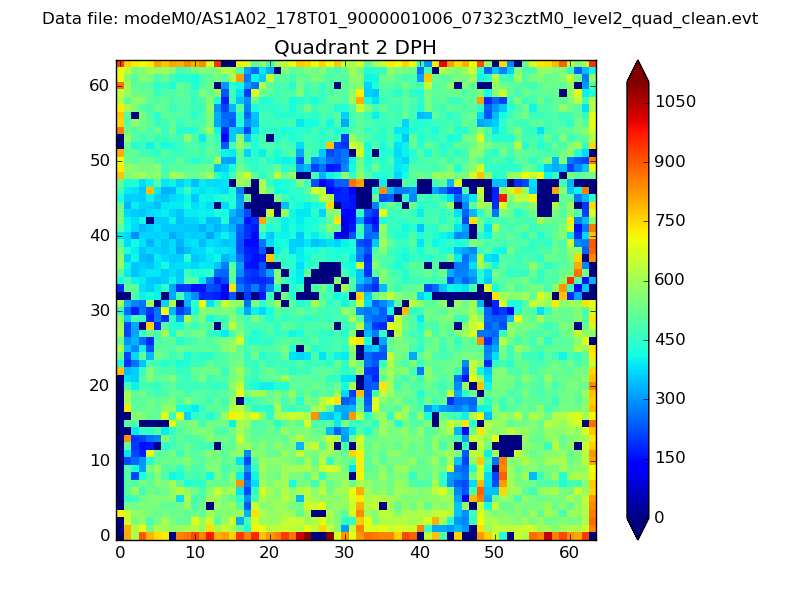 |
Quadrant C |
| Plot type | Count rate plots | Images |
|---|---|---|
| Comparison with Poisson distribution Blue bars denote a histogram of data divided into 1 sec bins. Red curve is a Poisson curve with rate = median count rate of data. |
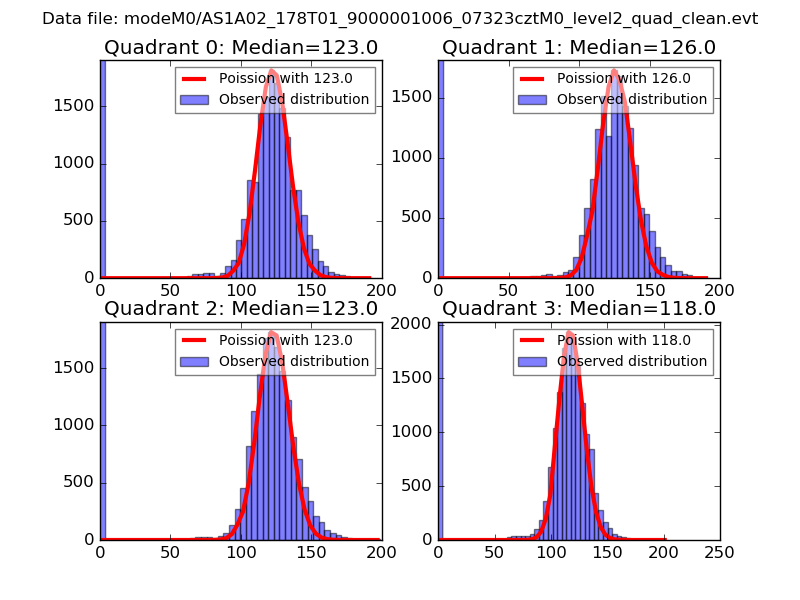 |
 |
| Quadrant-wise count rates Data is divided into 100 sec bins |
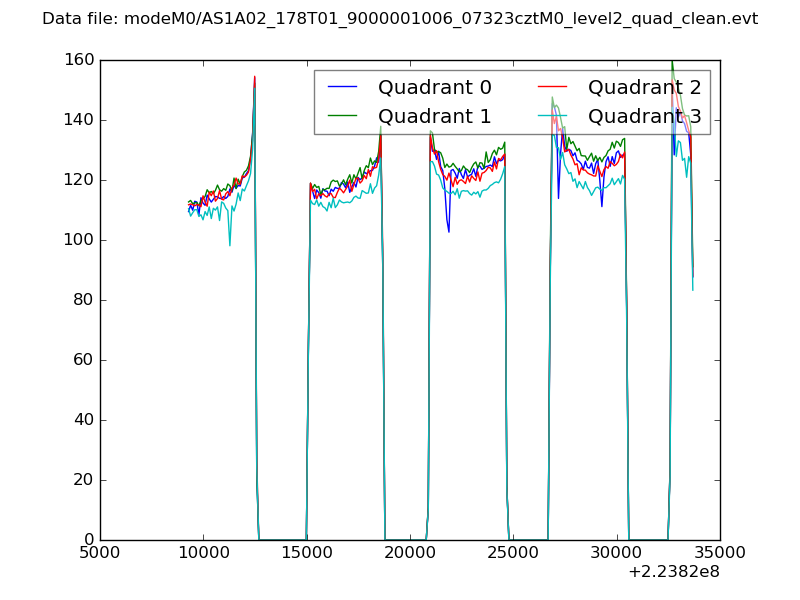 |
|
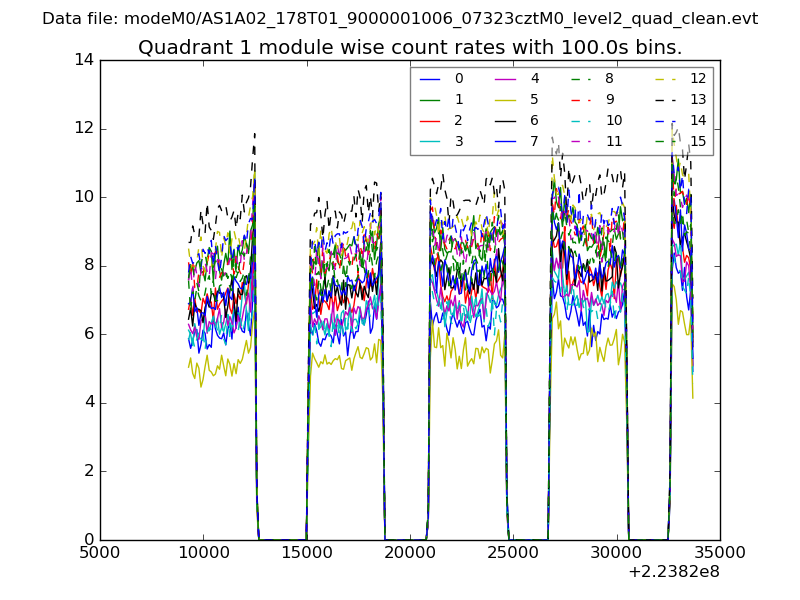
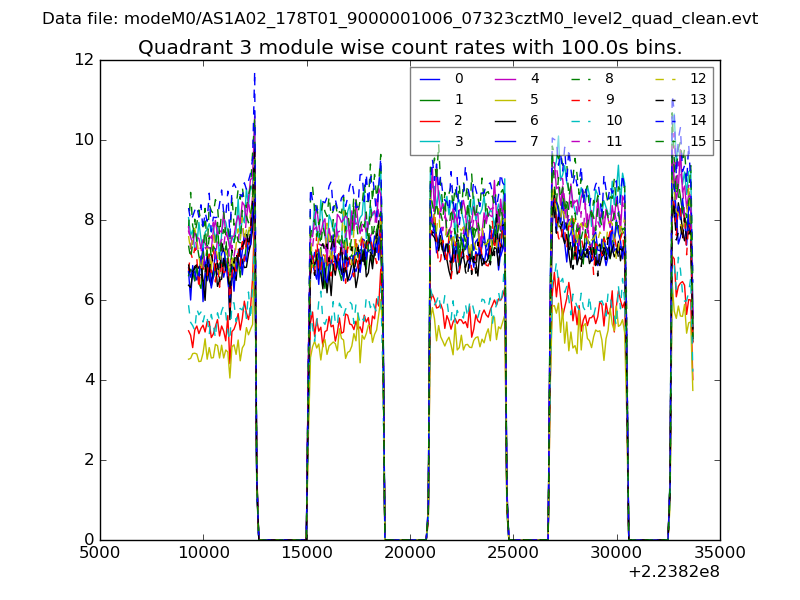
| Module-wise count rates for Quadrant A Data is divided into 100 sec bins |
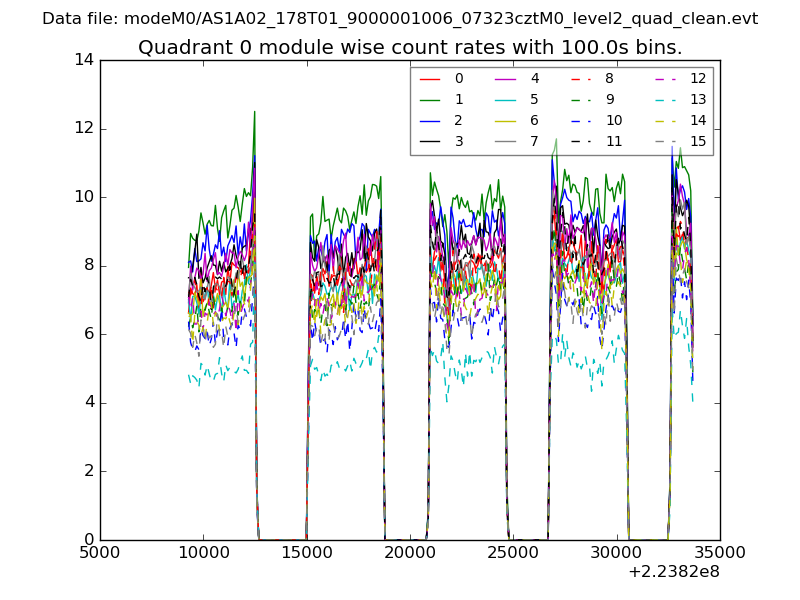 |
 |
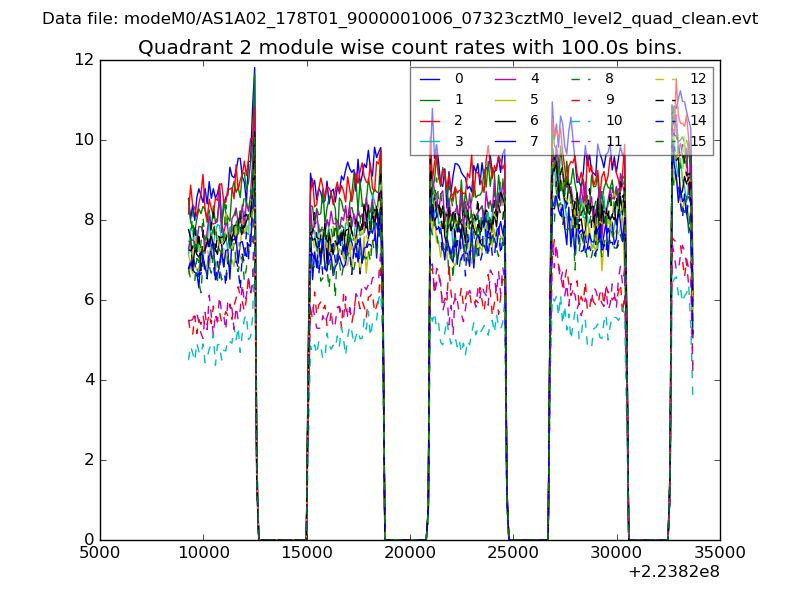
| Module-wise count rates for Quadrant B Data is divided into 100 sec bins |
 |
 |
| Module-wise count rates for Quadrant C Data is divided into 100 sec bins |
 |
 |
| Module-wise count rates for Quadrant D Data is divided into 100 sec bins |
 |
 |
| Parameter | Plot |
|---|---|
| CZT HV Monitor | 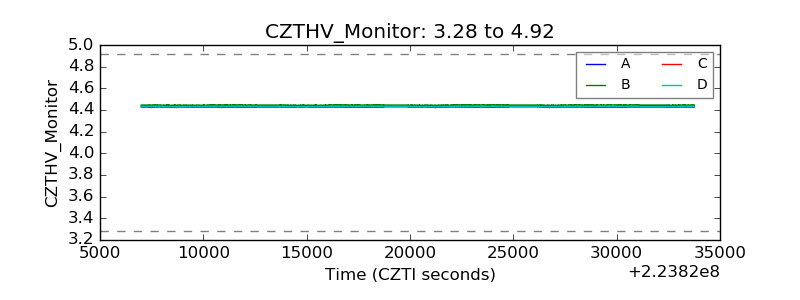 |
| D_VDD | 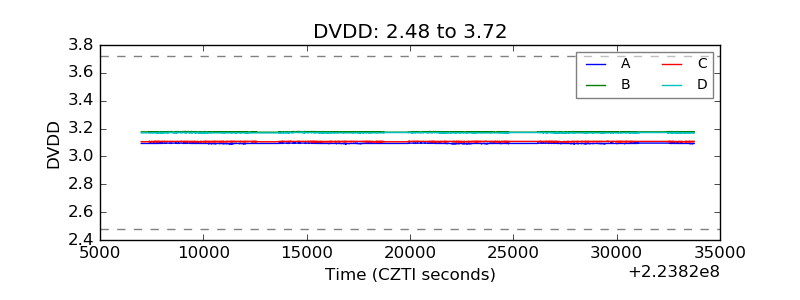 |
| Temperature 1 | 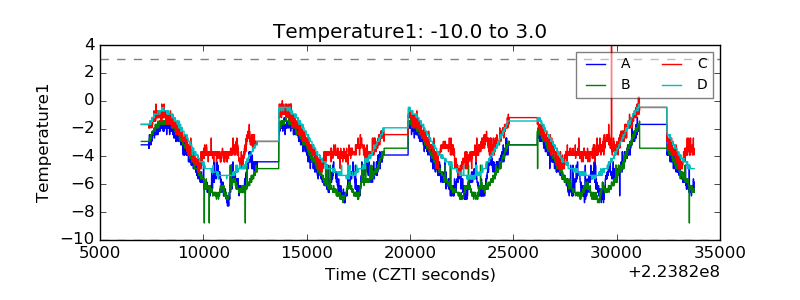 |
| Veto HV Monitor | 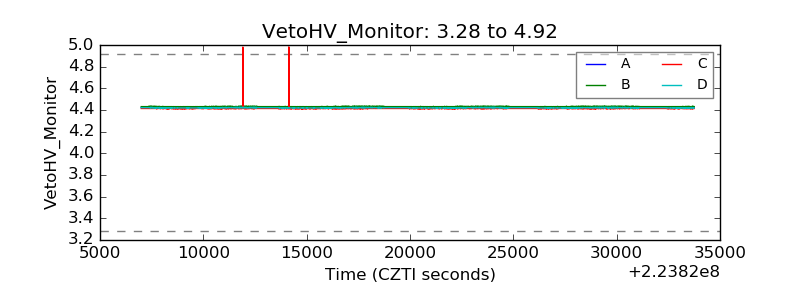 |
| Veto LLD | 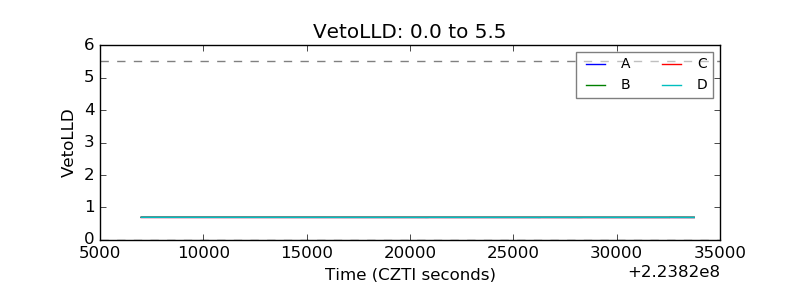 |
| Alpha Counter | 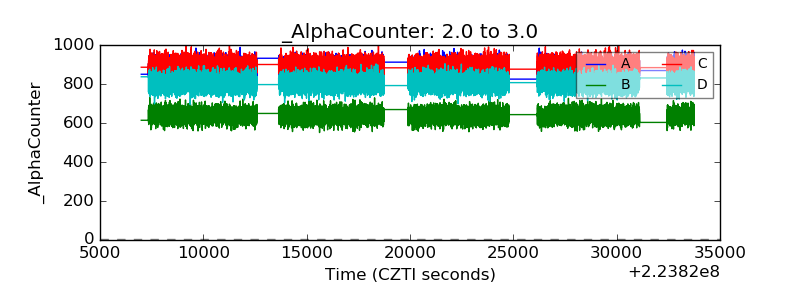 |
| _CPM_Rate | 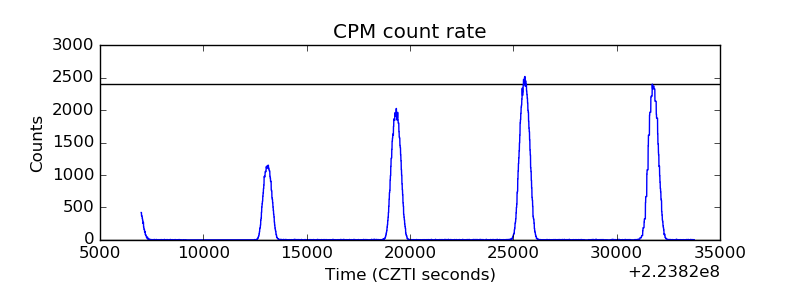 |
| CZT Counter | 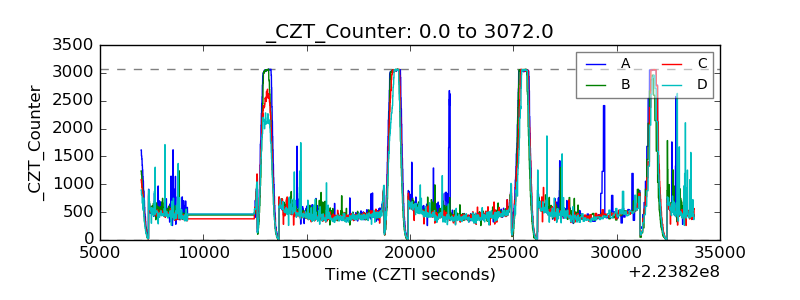 |
| +2.5 Volts monitor | 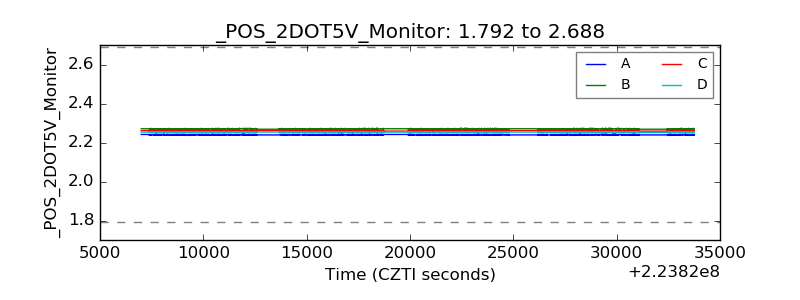 |
| +5 Volts monitor |  |
| _ROLL_ROT | 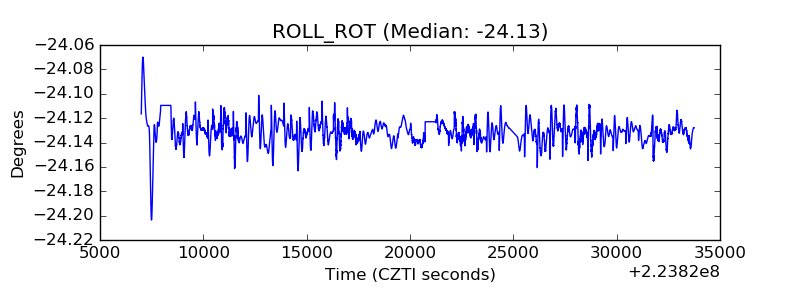 |
| _Roll_DEC | 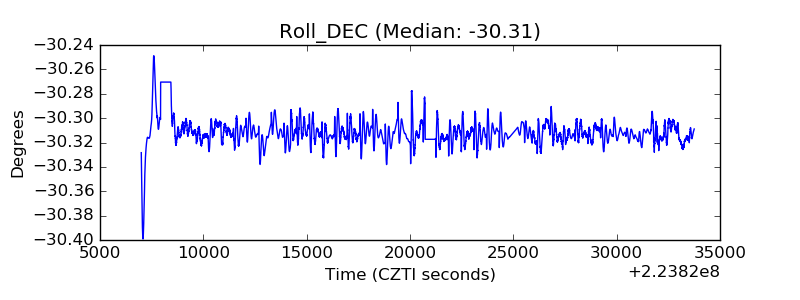 |
| _Roll_RA | 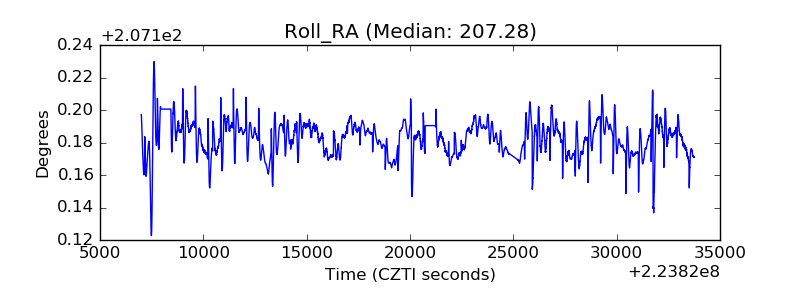 |
| Veto Counter | 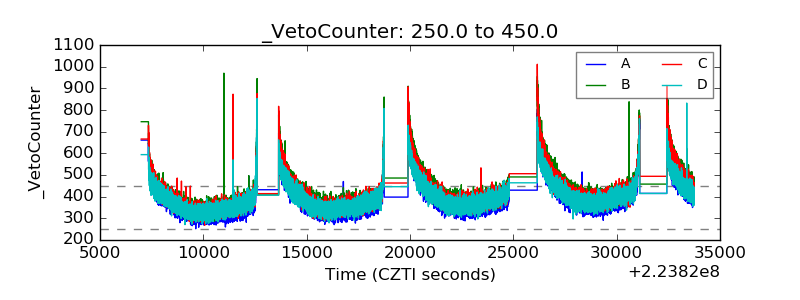 |