| Param | Original file | Final file |
|---|---|---|
| Filename | modeM0/AS1A02_178T01_9000001006_07324cztM0_level2.evt | modeM0/AS1A02_178T01_9000001006_07324cztM0_level2_quad_clean.evt |
| Size (bytes) | 601,473,600 | 103,458,240 |
| Size | 573.6 MB | 98.7 MB |
| Events in quadrant A | 5,331,761 | 626,853 |
| Events in quadrant B | 4,198,815 | 677,936 |
| Events in quadrant C | 3,788,633 | 657,723 |
| Events in quadrant D | 4,353,571 | 613,952 |
| Mode M0 | |||
|---|---|---|---|
| Quadrant | BADHDUFLAG | Total packets | Discarded packets |
| A | 0 | 21189 | 4 |
| B | 0 | 17617 | 3 |
| C | 0 | 16515 | 3 |
| D | 0 | 18505 | 3 |
| Mode SS | |||
|---|---|---|---|
| Quadrant | BADHDUFLAG | Total packets | Discarded packets |
| A | 0 | 164 | 0 |
| B | 0 | 164 | 0 |
| C | 0 | 164 | 0 |
| D | 0 | 164 | 0 |
| Mode M9 | |||
|---|---|---|---|
| Quadrant | BADHDUFLAG | Total packets | Discarded packets |
| A | 0 | 20 | 0 |
| B | 0 | 20 | 0 |
| C | 0 | 20 | 0 |
| D | 0 | 21 | 0 |
| Quadrant | Total seconds | Saturated seconds | Saturation percentage |
|---|---|---|---|
| A | 7999 | 485 | 6.063258% |
| B | 7999 | 81 | 1.012627% |
| C | 7999 | 13 | 0.162520% |
| D | 7999 | 134 | 1.675209% |
Noise dominated data is calculated using 1-second bins in cleaned event files. If a bin has >2000 counts, and if more than 50% of those come from <1% of pixels, then it is considered to be noise-dominated and hence unusable.
| Quadrant | # 1 sec bins | Bins with >0 counts | Bins with >2000 counts | High rate bins dominated by noise | Noise dominated (total time) | Noise dominated (detector-on time) | Marked lightcurve |
|---|---|---|---|---|---|---|---|
| A | 32571 | 8001 | 343 | 343 | 1.05% | 4.29% | 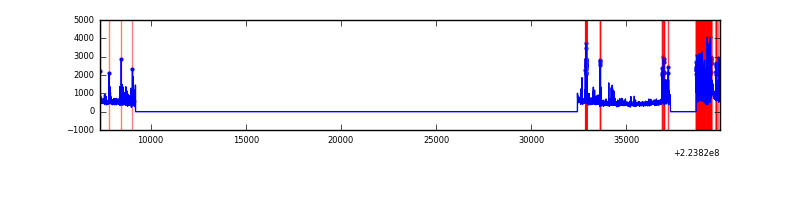 |
| B | 32571 | 8001 | 8 | 8 | 0.02% | 0.10% |  |
| C | 32571 | 8001 | 2 | 2 | 0.01% | 0.02% | 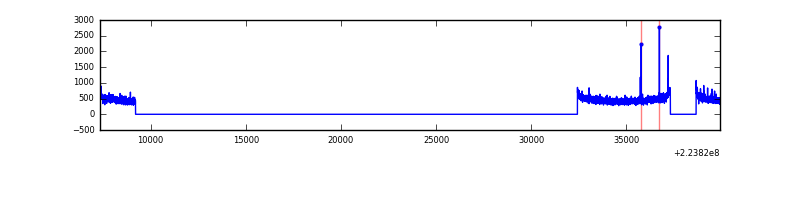 |
| D | 32571 | 8001 | 71 | 71 | 0.22% | 0.89% | 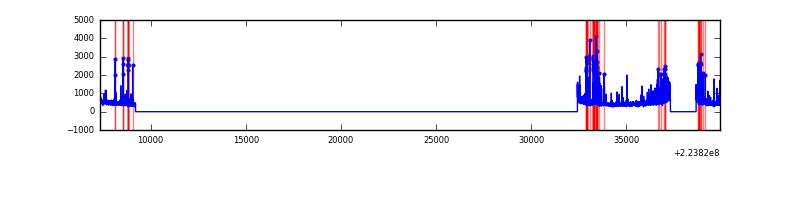 |
Top three noisy pixels from each quadrant. If the there are fewer than three noisy pixels in the level2.evt file, extra rows are filled as -1
| Pixel properties | Quadrant properties | ||||||
|---|---|---|---|---|---|---|---|
| Quadrant | DetID | PixID | Counts | Sigma | Mean | Median | Sigma |
| A | 15 | 234 | 1292785 | 6702.5 | 958 | 937 | 192.7 |
| A | 8 | 15 | 242268 | 1252.1 | 958 | 937 | 192.7 |
| A | 13 | 248 | 101431 | 521.39 | 958 | 937 | 192.7 |
| B | 5 | 143 | 129396 | 684.78 | 998 | 973 | 187.5 |
| B | 0 | 214 | 99551 | 525.64 | 998 | 973 | 187.5 |
| B | 4 | 81 | 67561 | 355.06 | 998 | 973 | 187.5 |
| C | 9 | 68 | 29773 | 130.1 | 959 | 965 | 221.4 |
| C | 14 | 234 | 9722 | 39.55 | 959 | 965 | 221.4 |
| C | 13 | 61 | 7466 | 29.36 | 959 | 965 | 221.4 |
| D | 2 | 216 | 354998 | 1555.52 | 943 | 915 | 227.6 |
| D | 14 | 34 | 174407 | 762.17 | 943 | 915 | 227.6 |
| D | 12 | 233 | 115048 | 501.4 | 943 | 915 | 227.6 |
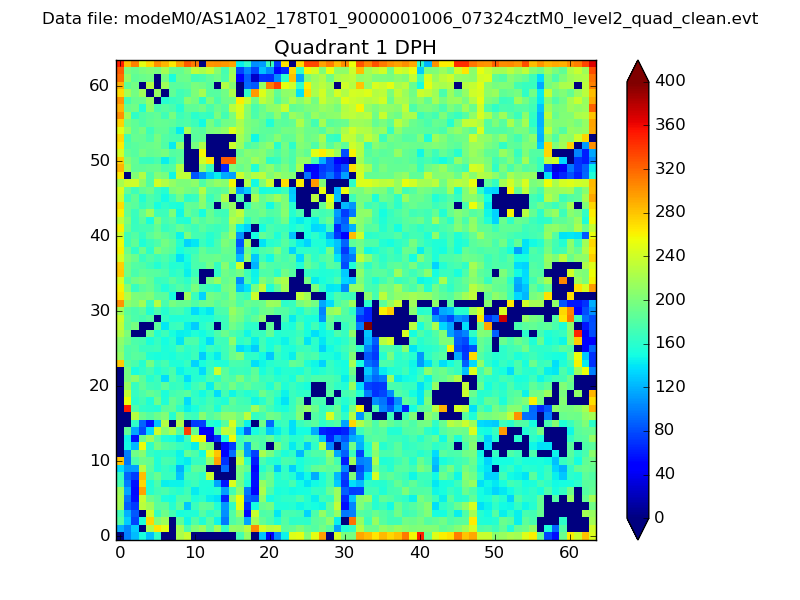
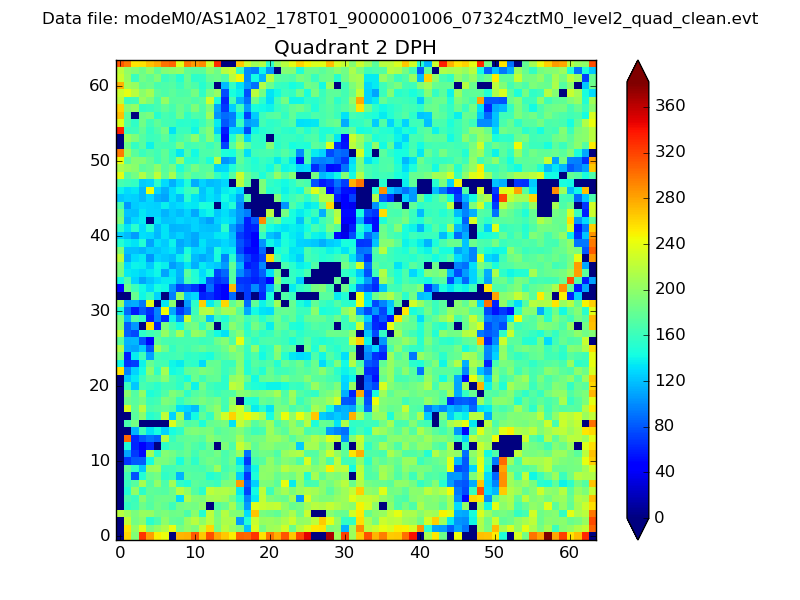
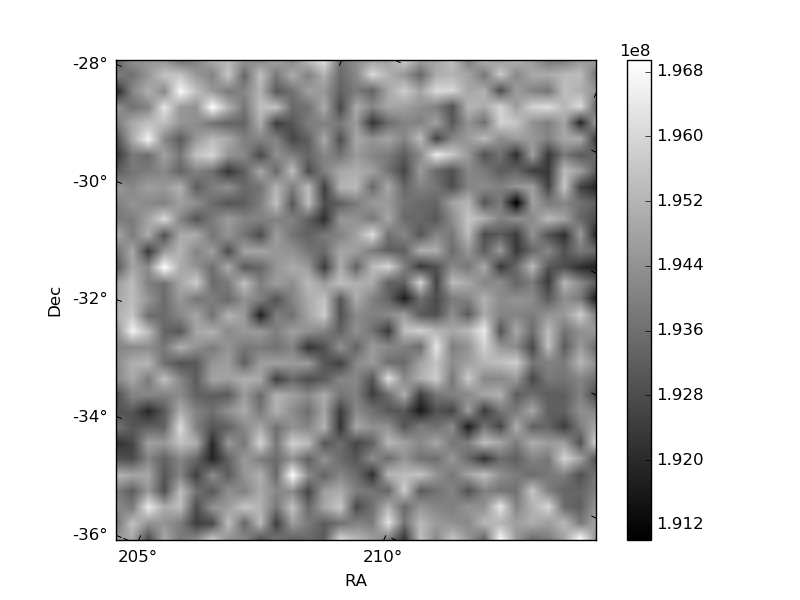
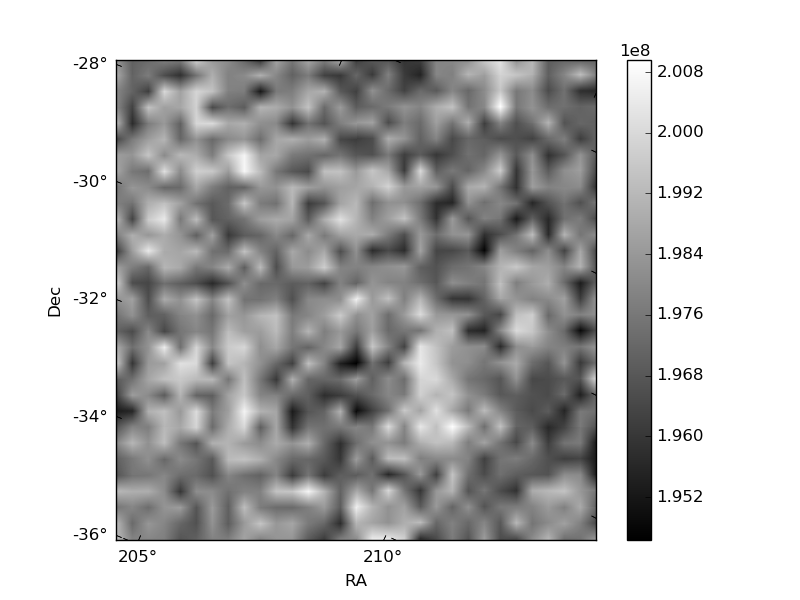
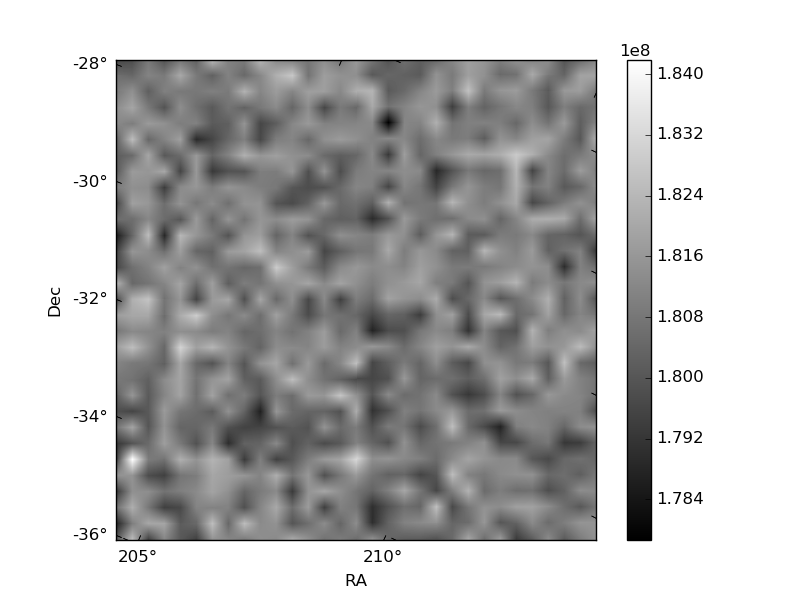
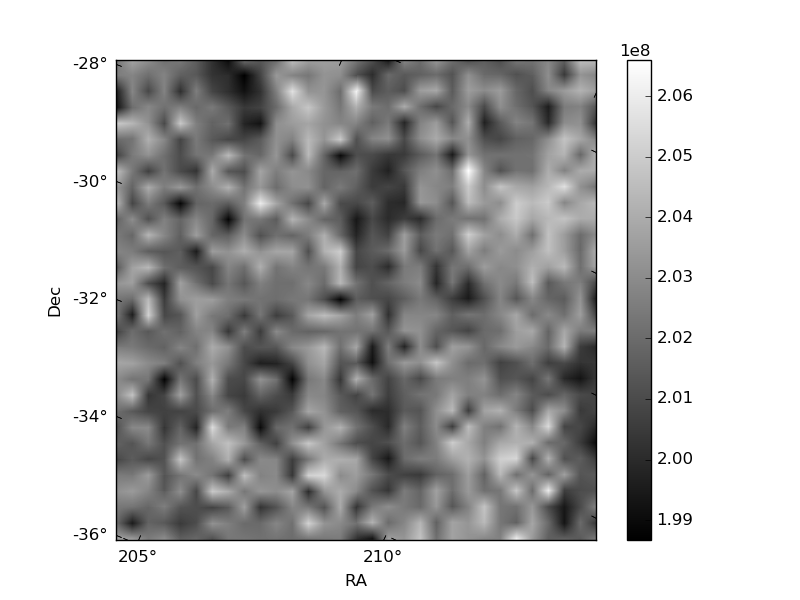
Histogram calculated using DETX and DETY for each event in the final _common_clean file
| Quadrant A | 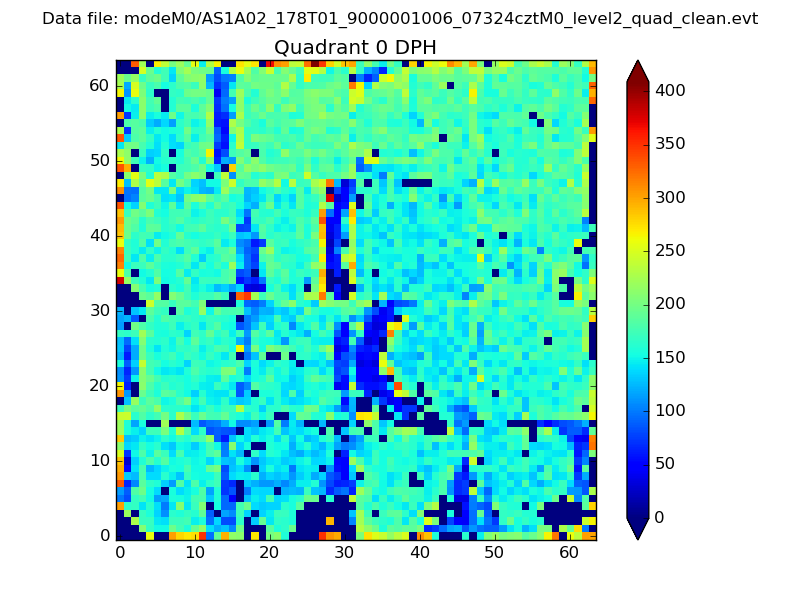 |
 |
Quadrant B |
|---|---|---|---|
| Quadrant D |  |
 |
Quadrant C |
| Plot type | Count rate plots | Images |
|---|---|---|
| Comparison with Poisson distribution Blue bars denote a histogram of data divided into 1 sec bins. Red curve is a Poisson curve with rate = median count rate of data. |
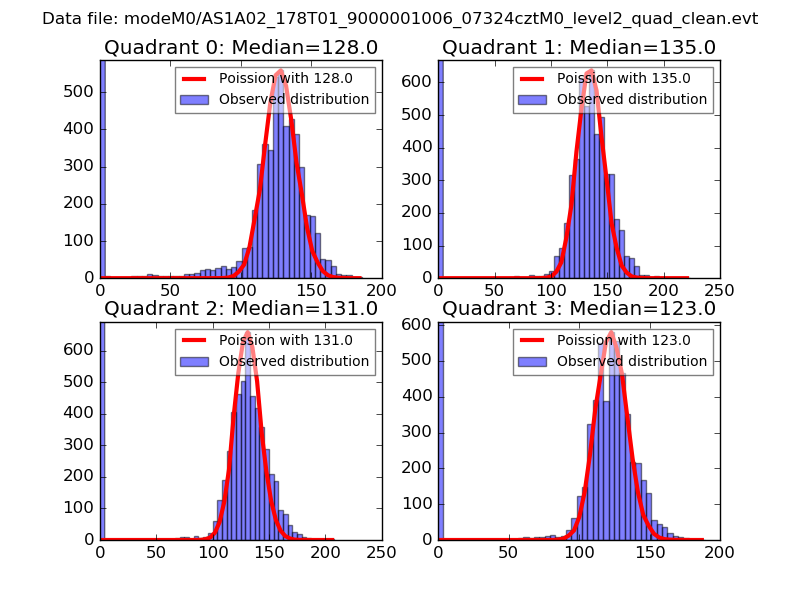 |
 |
| Quadrant-wise count rates Data is divided into 100 sec bins |
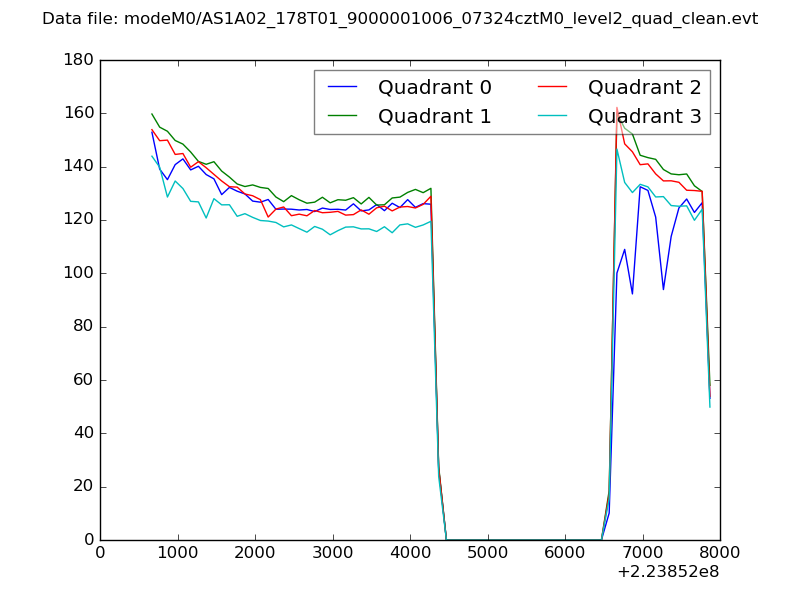 |
|
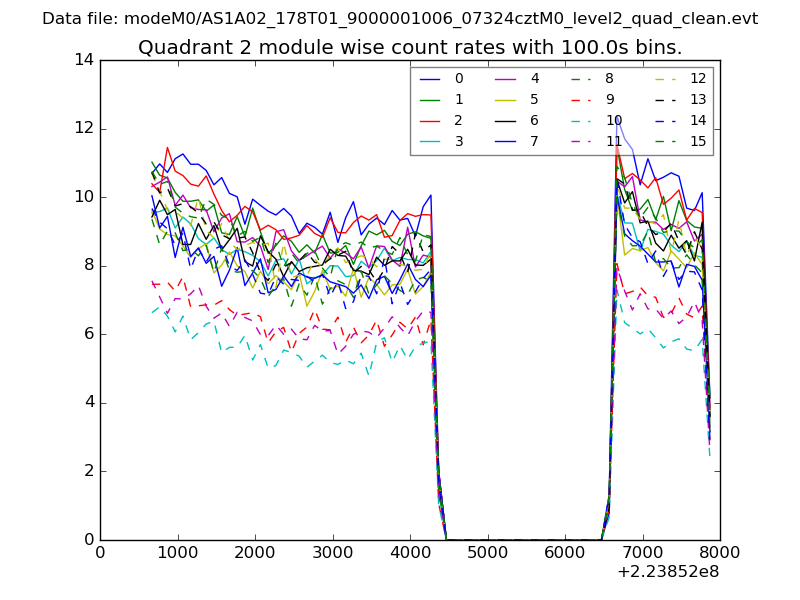
| Module-wise count rates for Quadrant A Data is divided into 100 sec bins |
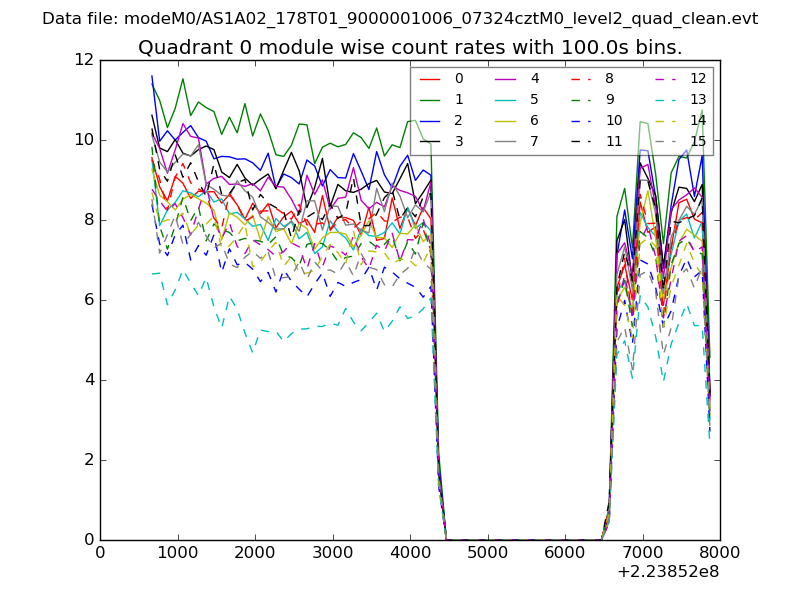 |
 |
| Module-wise count rates for Quadrant B Data is divided into 100 sec bins |
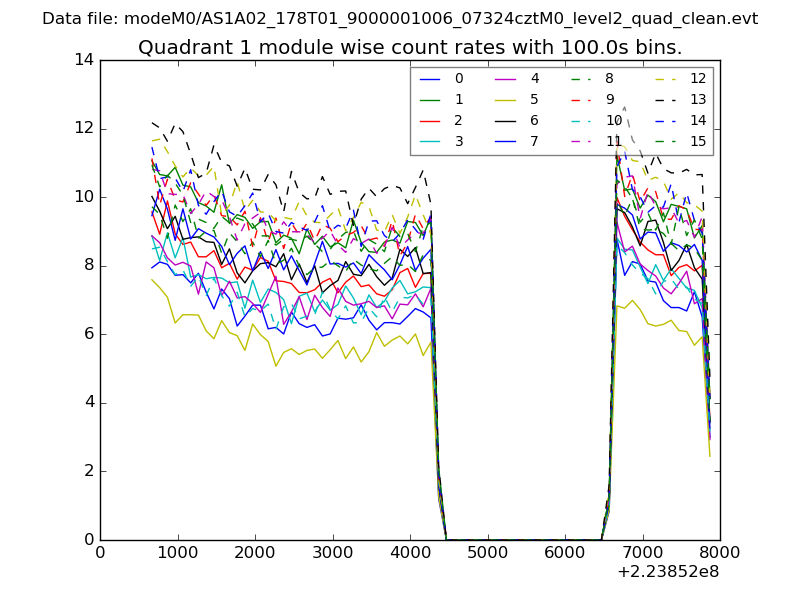 |
 |
| Module-wise count rates for Quadrant C Data is divided into 100 sec bins |
 |
 |
| Module-wise count rates for Quadrant D Data is divided into 100 sec bins |
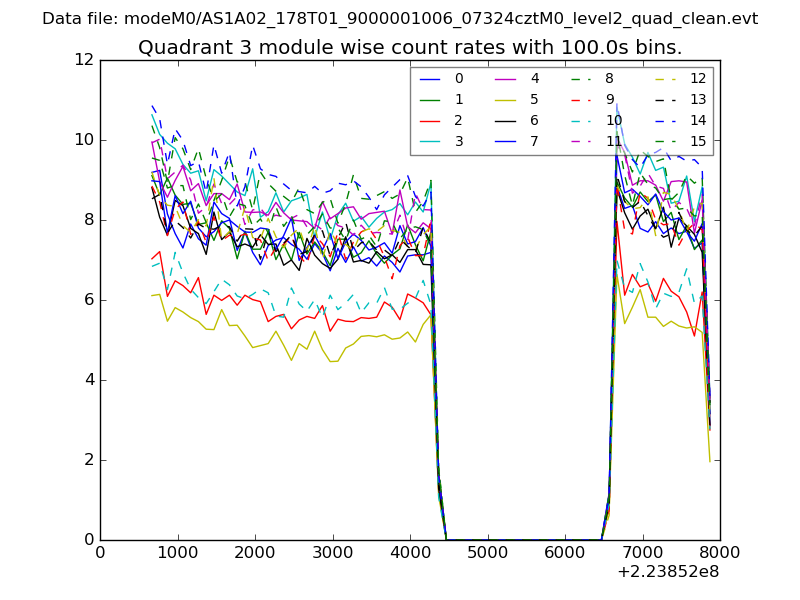 |
 |
| Parameter | Plot |
|---|---|
| CZT HV Monitor | 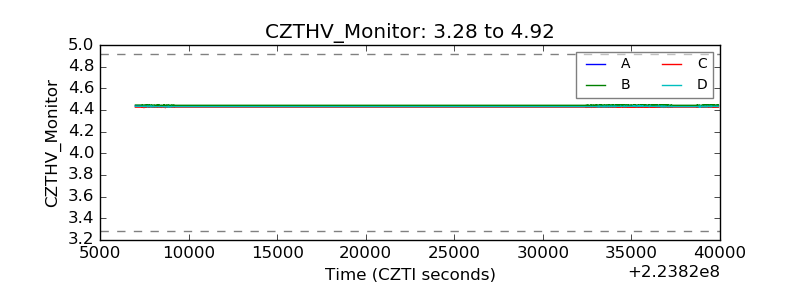 |
| D_VDD | 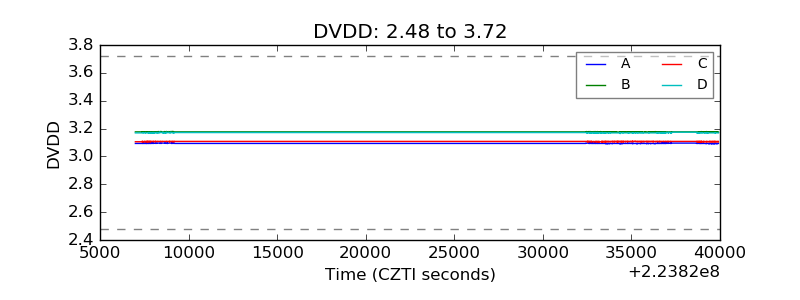 |
| Temperature 1 | 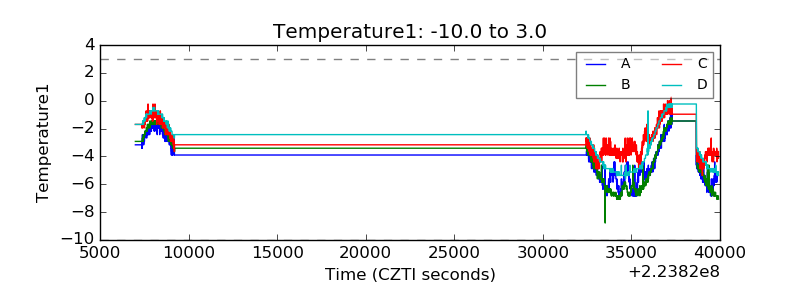 |
| Veto HV Monitor | 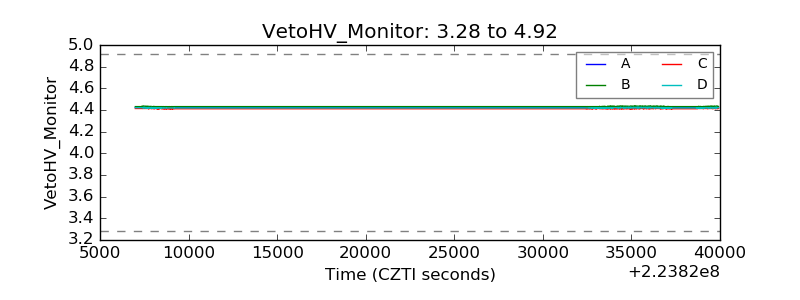 |
| Veto LLD | 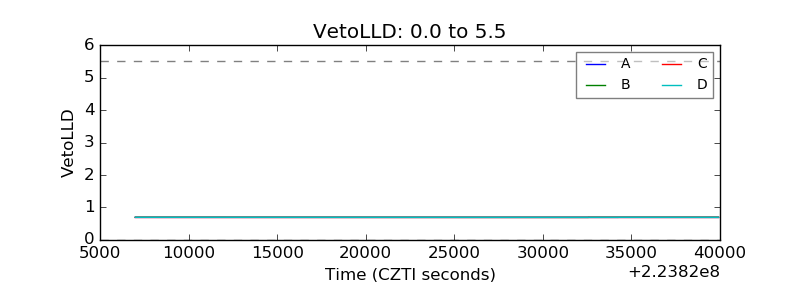 |
| Alpha Counter | 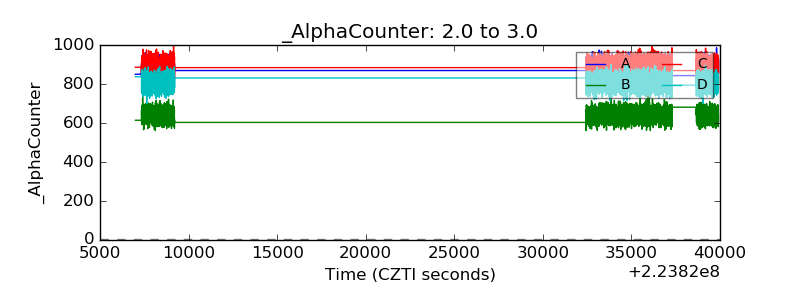 |
| _CPM_Rate | 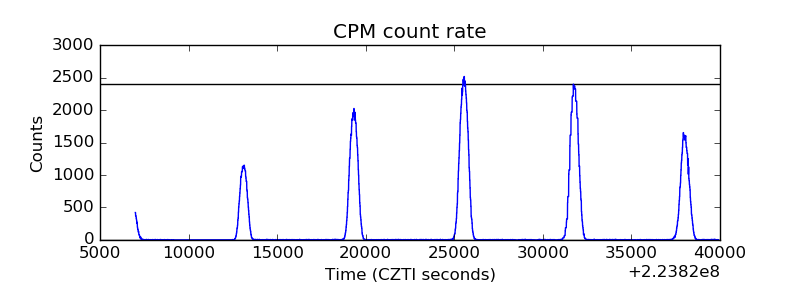 |
| CZT Counter | 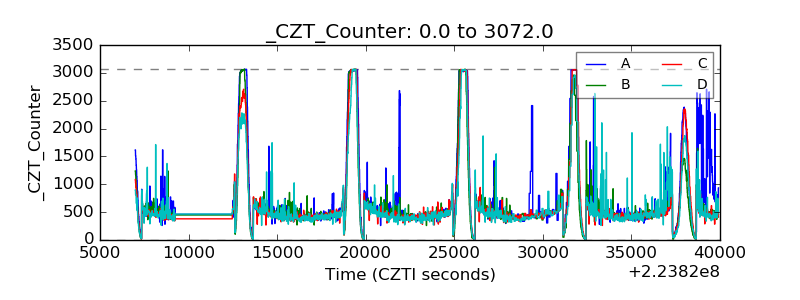 |
| +2.5 Volts monitor |  |
| +5 Volts monitor | 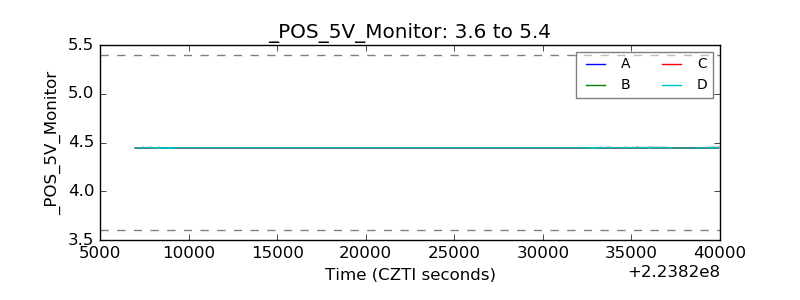 |
| _ROLL_ROT | 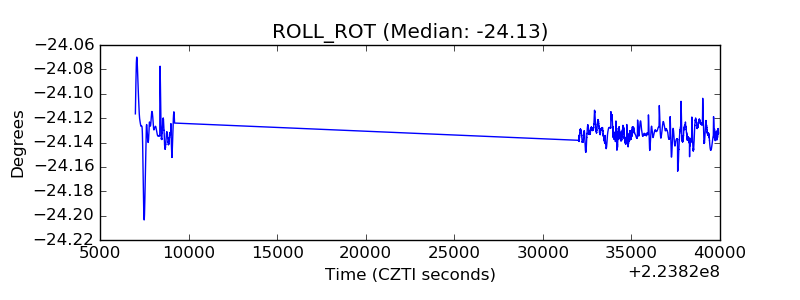 |
| _Roll_DEC | 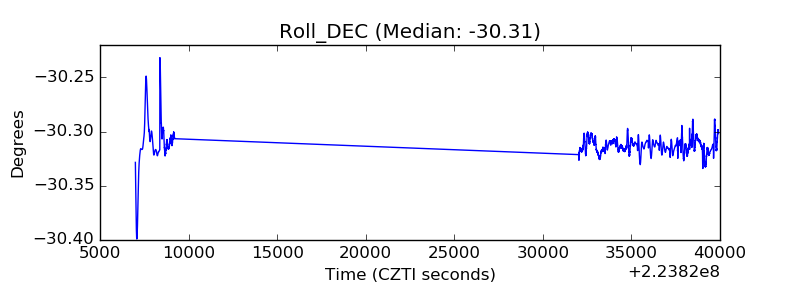 |
| _Roll_RA | 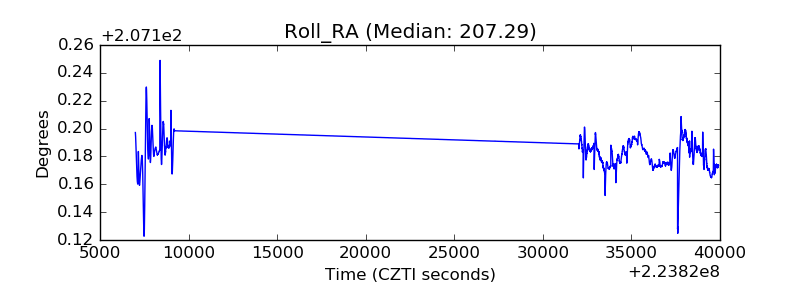 |
| Veto Counter | 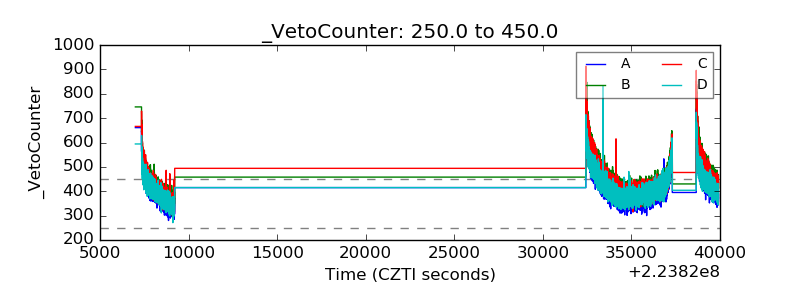 |