| Param | Original file | Final file |
|---|---|---|
| Filename | modeM0/AS1A02_178T01_9000001006_07325cztM0_level2.evt | modeM0/AS1A02_178T01_9000001006_07325cztM0_level2_quad_clean.evt |
| Size (bytes) | 2,240,504,640 | 445,006,080 |
| Size | 2.1 GB | 424.4 MB |
| Events in quadrant A | 19,475,394 | 2,785,484 |
| Events in quadrant B | 15,768,342 | 2,942,643 |
| Events in quadrant C | 14,607,150 | 2,867,010 |
| Events in quadrant D | 15,872,594 | 2,715,751 |
| Mode M0 | |||
|---|---|---|---|
| Quadrant | BADHDUFLAG | Total packets | Discarded packets |
| A | 0 | 79295 | 8 |
| B | 0 | 68053 | 7 |
| C | 0 | 65225 | 7 |
| D | 0 | 70138 | 7 |
| Mode SS | |||
|---|---|---|---|
| Quadrant | BADHDUFLAG | Total packets | Discarded packets |
| A | 0 | 646 | 0 |
| B | 0 | 646 | 0 |
| C | 0 | 646 | 0 |
| D | 0 | 646 | 0 |
| Mode M9 | |||
|---|---|---|---|
| Quadrant | BADHDUFLAG | Total packets | Discarded packets |
| A | 0 | 76 | 0 |
| B | 0 | 76 | 0 |
| C | 0 | 76 | 0 |
| D | 0 | 76 | 0 |
| Quadrant | Total seconds | Saturated seconds | Saturation percentage |
|---|---|---|---|
| A | 31540 | 1735 | 5.500951% |
| B | 31540 | 361 | 1.144578% |
| C | 31540 | 159 | 0.504122% |
| D | 31540 | 424 | 1.344325% |
Noise dominated data is calculated using 1-second bins in cleaned event files. If a bin has >2000 counts, and if more than 50% of those come from <1% of pixels, then it is considered to be noise-dominated and hence unusable.
| Quadrant | # 1 sec bins | Bins with >0 counts | Bins with >2000 counts | High rate bins dominated by noise | Noise dominated (total time) | Noise dominated (detector-on time) | Marked lightcurve |
|---|---|---|---|---|---|---|---|
| A | 38886 | 31543 | 1091 | 1091 | 2.81% | 3.46% | 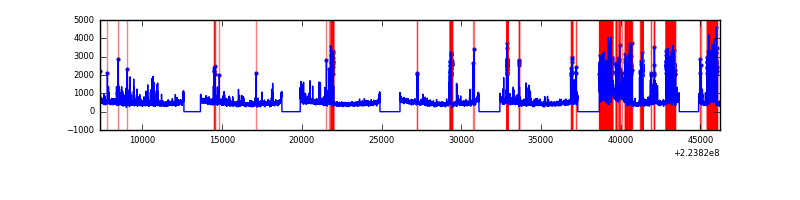 |
| B | 38886 | 31542 | 19 | 19 | 0.05% | 0.06% | 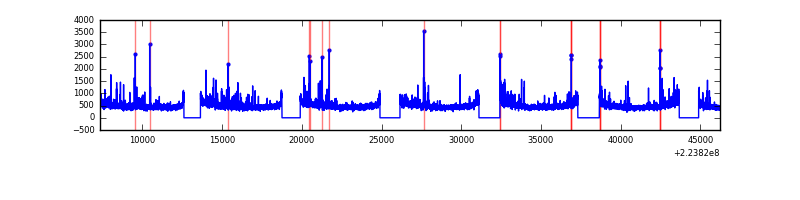 |
| C | 38886 | 31544 | 6 | 6 | 0.02% | 0.02% | 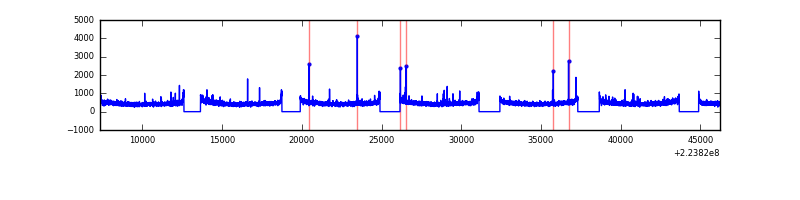 |
| D | 38886 | 31544 | 172 | 172 | 0.44% | 0.55% | 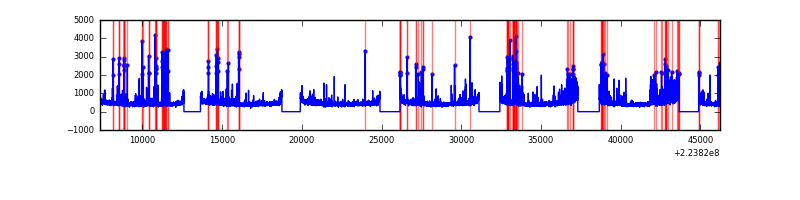 |
Top three noisy pixels from each quadrant. If the there are fewer than three noisy pixels in the level2.evt file, extra rows are filled as -1
| Pixel properties | Quadrant properties | ||||||
|---|---|---|---|---|---|---|---|
| Quadrant | DetID | PixID | Counts | Sigma | Mean | Median | Sigma |
| A | 15 | 234 | 3786672 | 5127.53 | 3679 | 3609 | 737.8 |
| A | 8 | 15 | 808671 | 1091.17 | 3679 | 3609 | 737.8 |
| A | 14 | 111 | 359239 | 482.02 | 3679 | 3609 | 737.8 |
| B | 0 | 214 | 270496 | 375.57 | 3820 | 3730 | 710.3 |
| B | 11 | 51 | 261966 | 363.56 | 3820 | 3730 | 710.3 |
| B | 4 | 81 | 189201 | 261.12 | 3820 | 3730 | 710.3 |
| C | 9 | 68 | 178191 | 207.22 | 3683 | 3705 | 842.0 |
| C | 1 | 16 | 40470 | 43.66 | 3683 | 3705 | 842.0 |
| C | 13 | 61 | 28532 | 29.49 | 3683 | 3705 | 842.0 |
| D | 2 | 216 | 771166 | 870.03 | 3642 | 3534 | 882.3 |
| D | 14 | 34 | 424344 | 476.94 | 3642 | 3534 | 882.3 |
| D | 12 | 233 | 355267 | 398.65 | 3642 | 3534 | 882.3 |
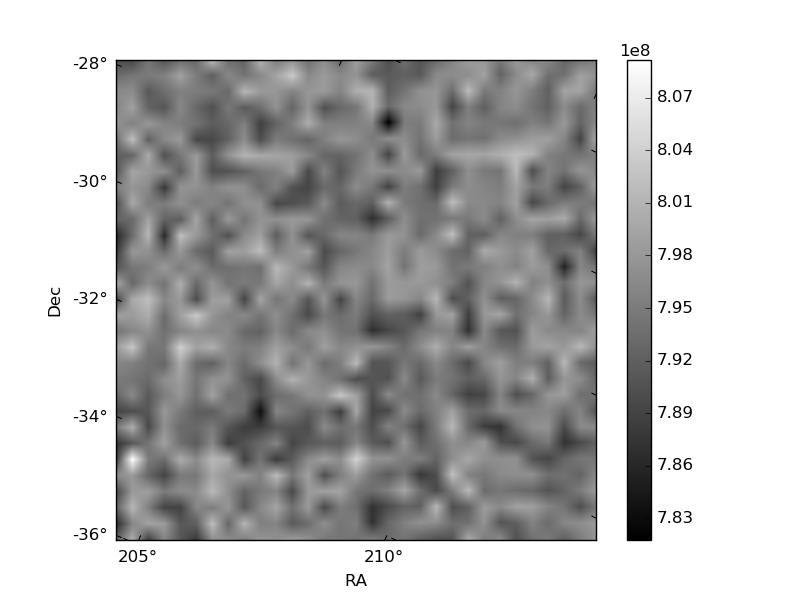
Histogram calculated using DETX and DETY for each event in the final _common_clean file
| Quadrant A |  |
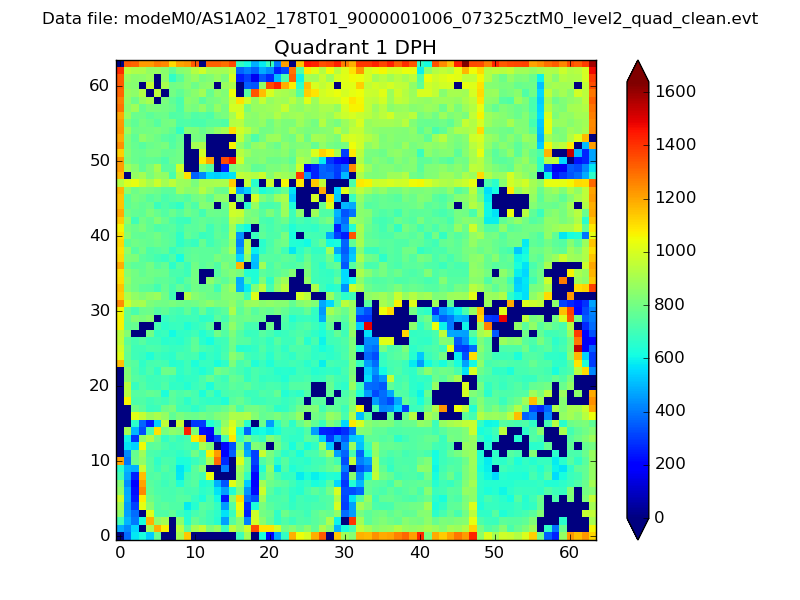 |
Quadrant B |
|---|---|---|---|
| Quadrant D |  |
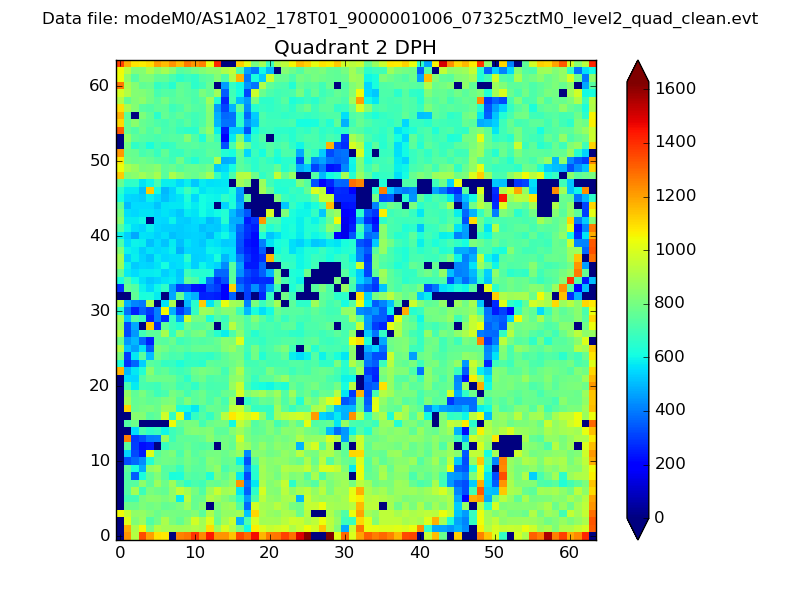 |
Quadrant C |
| Plot type | Count rate plots | Images |
|---|---|---|
| Comparison with Poisson distribution Blue bars denote a histogram of data divided into 1 sec bins. Red curve is a Poisson curve with rate = median count rate of data. |
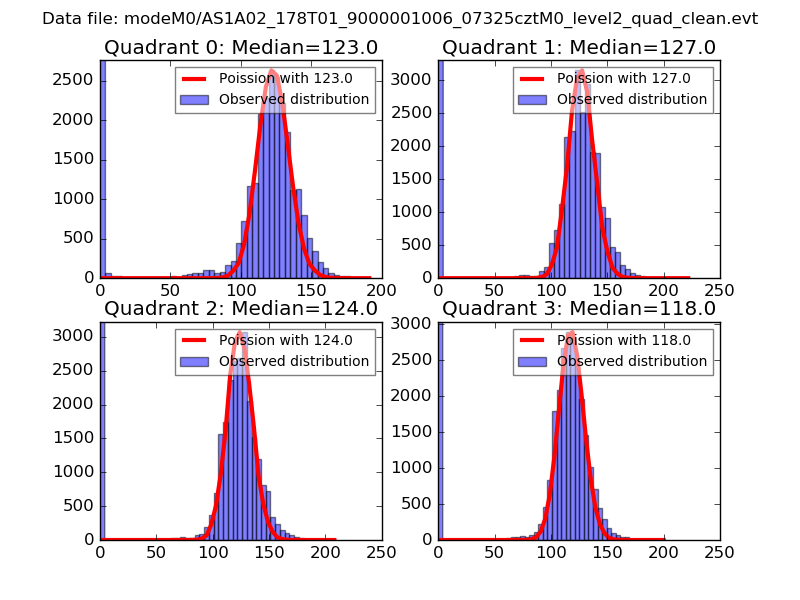 |
 |
| Quadrant-wise count rates Data is divided into 100 sec bins |
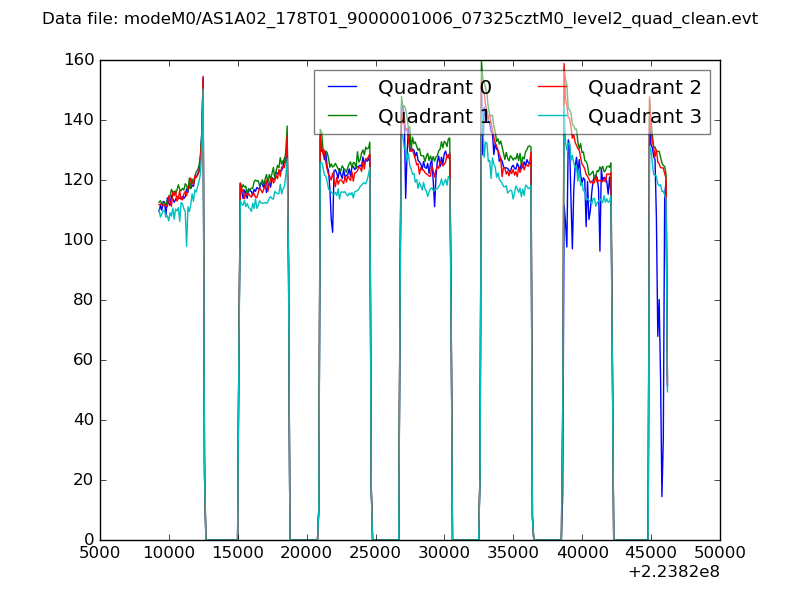 |
|
| Module-wise count rates for Quadrant A Data is divided into 100 sec bins |
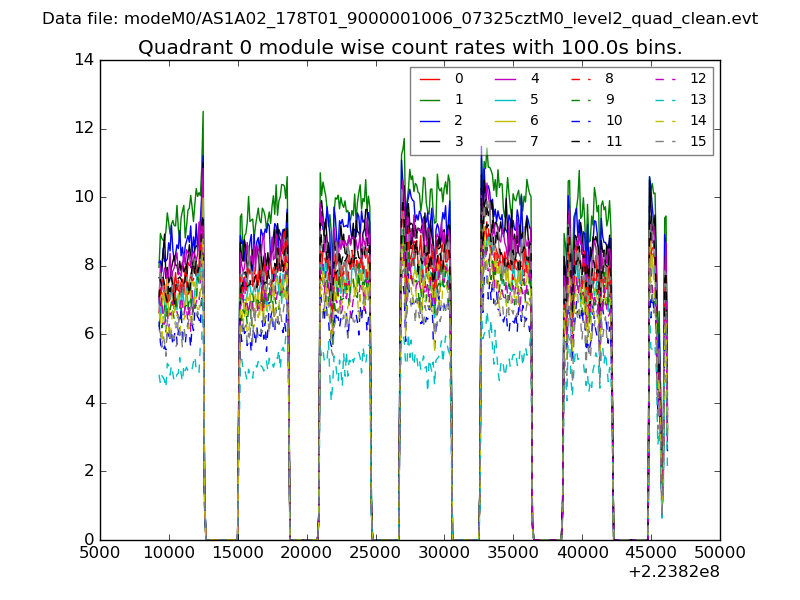 |
 |
| Module-wise count rates for Quadrant B Data is divided into 100 sec bins |
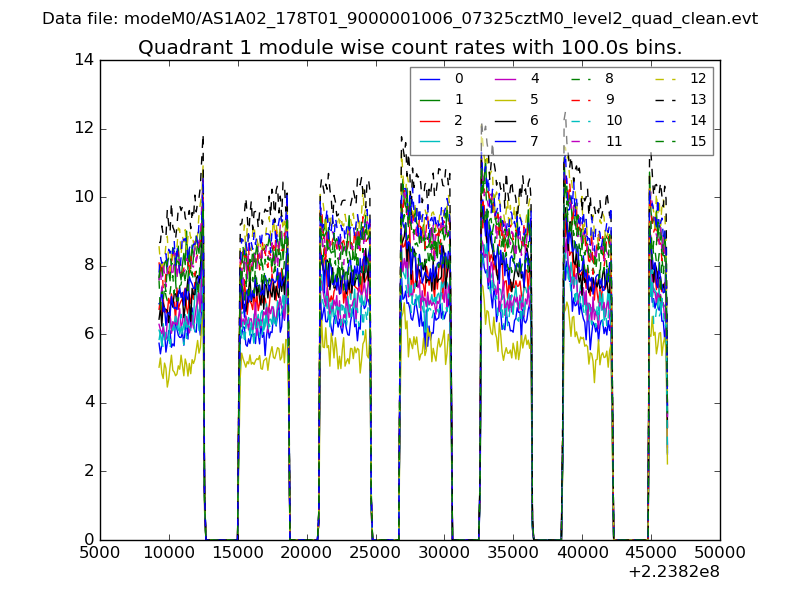 |
 |
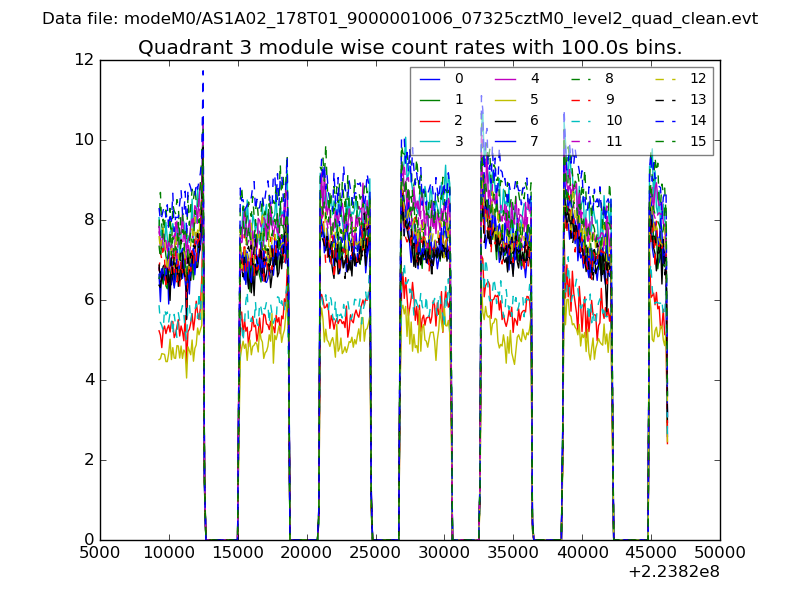
| Module-wise count rates for Quadrant C Data is divided into 100 sec bins |
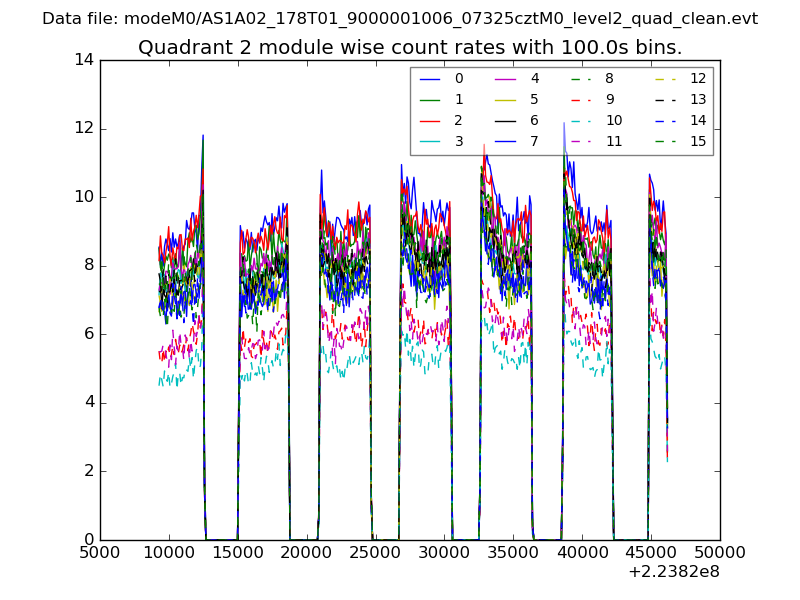 |
 |
| Module-wise count rates for Quadrant D Data is divided into 100 sec bins |
 |
 |
| Parameter | Plot |
|---|---|
| CZT HV Monitor | 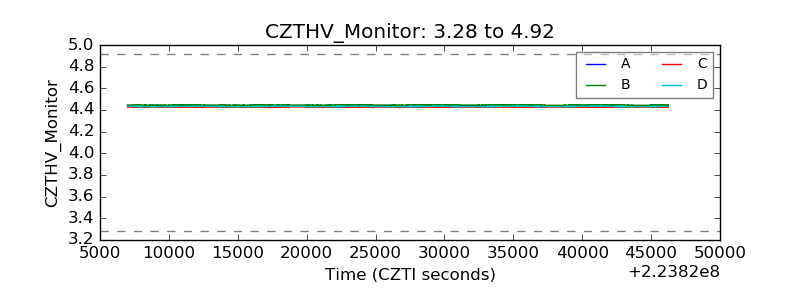 |
| D_VDD | 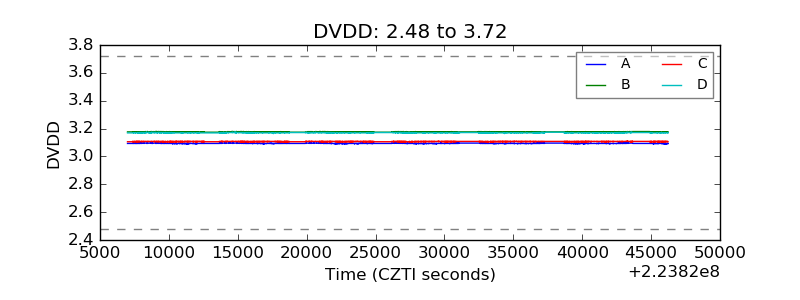 |
| Temperature 1 | 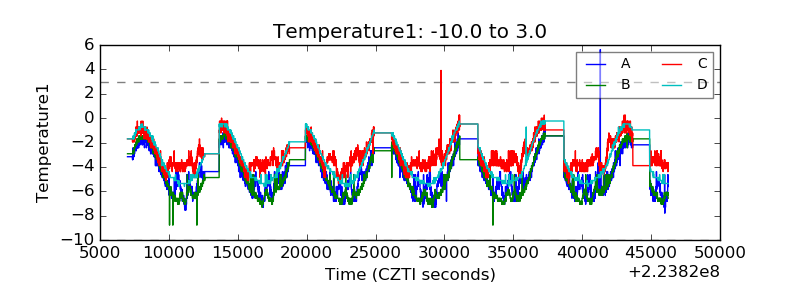 |
| Veto HV Monitor | 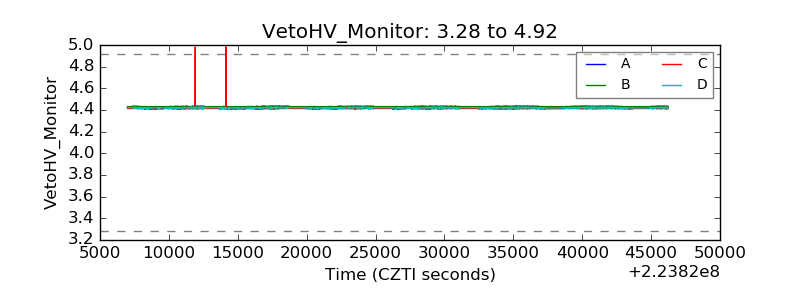 |
| Veto LLD | 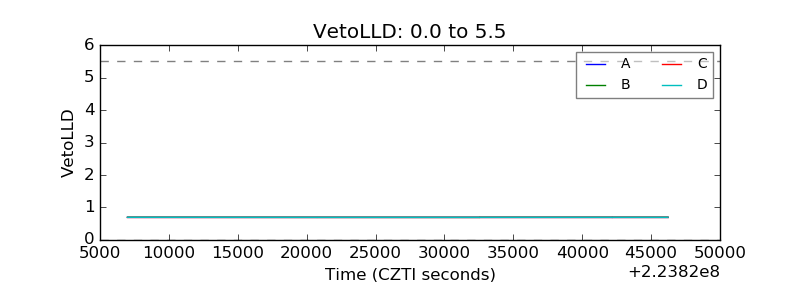 |
| Alpha Counter | 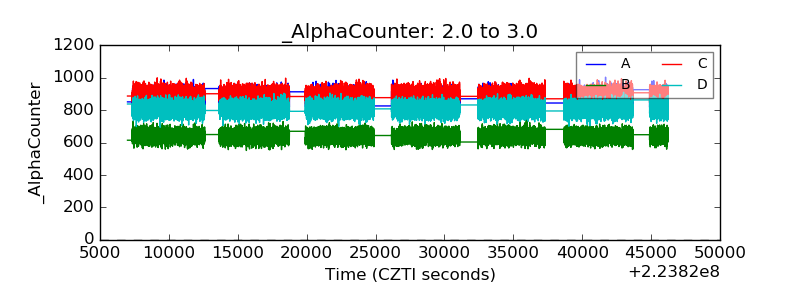 |
| _CPM_Rate | 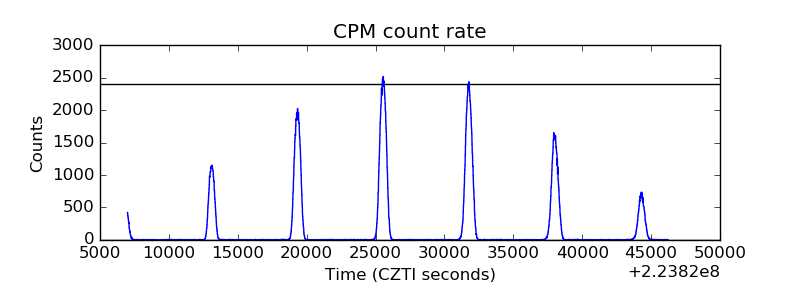 |
| CZT Counter | 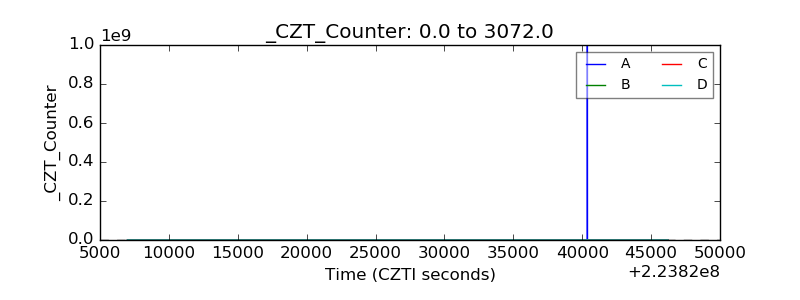 |
| +2.5 Volts monitor | 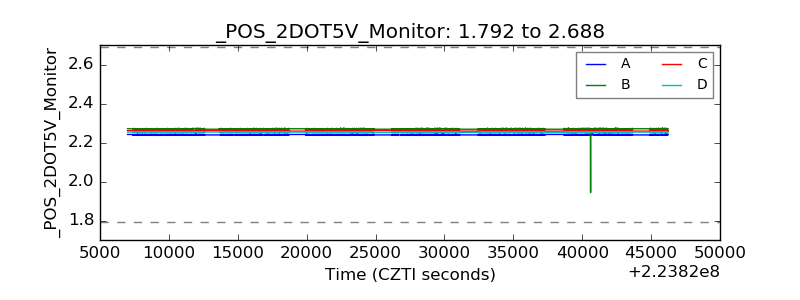 |
| +5 Volts monitor |  |
| _ROLL_ROT | 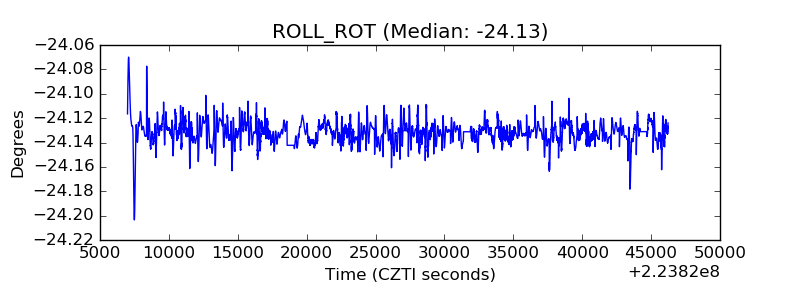 |
| _Roll_DEC | 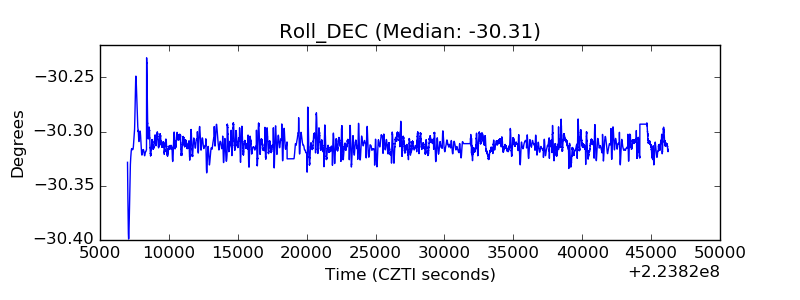 |
| _Roll_RA | 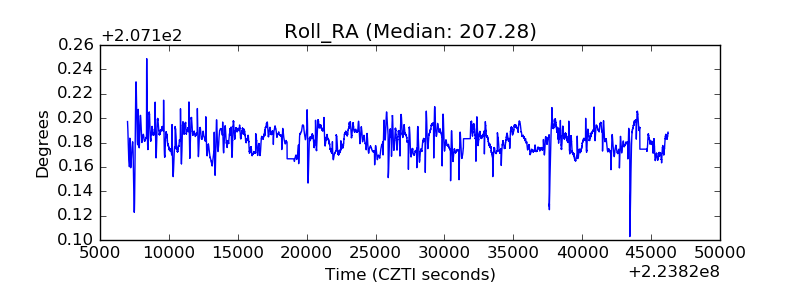 |
| Veto Counter | 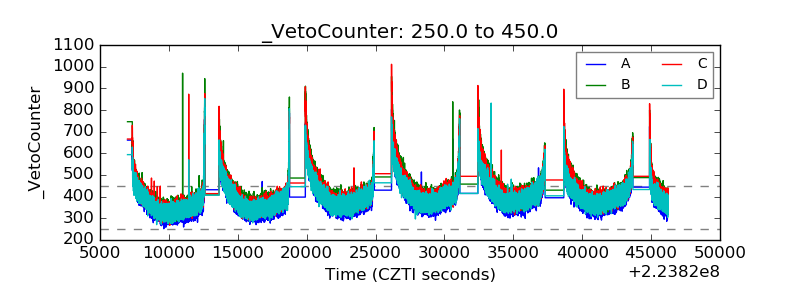 |