| Param | Original file | Final file |
|---|---|---|
| Filename | modeM0/AS1A02_178T01_9000001006_07326cztM0_level2.evt | modeM0/AS1A02_178T01_9000001006_07326cztM0_level2_quad_clean.evt |
| Size (bytes) | 750,441,600 | 87,364,800 |
| Size | 715.7 MB | 83.3 MB |
| Events in quadrant A | 11,920,102 | 344,131 |
| Events in quadrant B | 3,398,818 | 620,482 |
| Events in quadrant C | 3,268,784 | 608,105 |
| Events in quadrant D | 3,655,204 | 574,413 |
| Mode M0 | |||
|---|---|---|---|
| Quadrant | BADHDUFLAG | Total packets | Discarded packets |
| A | 0 | 40318 | 3 |
| B | 0 | 15075 | 2 |
| C | 0 | 14692 | 2 |
| D | 0 | 16261 | 2 |
| Mode SS | |||
|---|---|---|---|
| Quadrant | BADHDUFLAG | Total packets | Discarded packets |
| A | 0 | 146 | 0 |
| B | 0 | 146 | 0 |
| C | 0 | 146 | 0 |
| D | 0 | 146 | 0 |
| Mode M9 | |||
|---|---|---|---|
| Quadrant | BADHDUFLAG | Total packets | Discarded packets |
| A | 0 | 14 | 0 |
| B | 0 | 14 | 0 |
| C | 0 | 14 | 0 |
| D | 0 | 15 | 0 |
| Quadrant | Total seconds | Saturated seconds | Saturation percentage |
|---|---|---|---|
| A | 7136 | 4399 | 61.645179% |
| B | 7136 | 64 | 0.896861% |
| C | 7136 | 34 | 0.476457% |
| D | 7136 | 92 | 1.289238% |
Noise dominated data is calculated using 1-second bins in cleaned event files. If a bin has >2000 counts, and if more than 50% of those come from <1% of pixels, then it is considered to be noise-dominated and hence unusable.
| Quadrant | # 1 sec bins | Bins with >0 counts | Bins with >2000 counts | High rate bins dominated by noise | Noise dominated (total time) | Noise dominated (detector-on time) | Marked lightcurve |
|---|---|---|---|---|---|---|---|
| A | 8026 | 7136 | 3278 | 3278 | 40.84% | 45.94% | 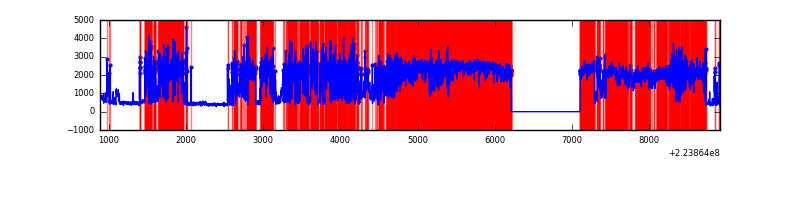 |
| B | 8026 | 7137 | 2 | 2 | 0.02% | 0.03% | 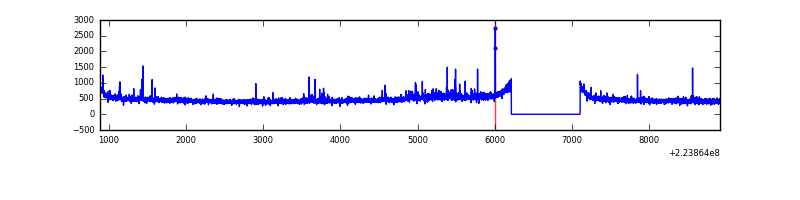 |
| C | 8026 | 7137 | 0 | 0 | 0.00% | 0.00% | 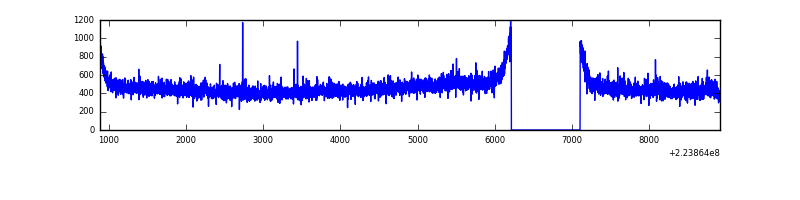 |
| D | 8026 | 7137 | 32 | 32 | 0.40% | 0.45% | 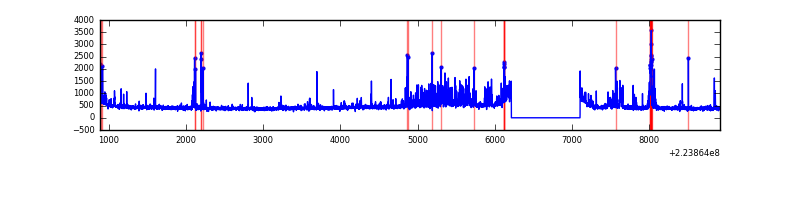 |
Top three noisy pixels from each quadrant. If the there are fewer than three noisy pixels in the level2.evt file, extra rows are filled as -1
| Pixel properties | Quadrant properties | ||||||
|---|---|---|---|---|---|---|---|
| Quadrant | DetID | PixID | Counts | Sigma | Mean | Median | Sigma |
| A | 15 | 234 | 10060501 | 104875.42 | 464 | 454 | 95.9 |
| A | 14 | 111 | 62058 | 642.22 | 464 | 454 | 95.9 |
| A | 15 | 250 | 6416 | 62.15 | 464 | 454 | 95.9 |
| B | 0 | 214 | 58688 | 358.75 | 844 | 824 | 161.3 |
| B | 4 | 81 | 40277 | 244.61 | 844 | 824 | 161.3 |
| B | 12 | 111 | 16506 | 97.23 | 844 | 824 | 161.3 |
| C | 9 | 68 | 67565 | 347.67 | 820 | 826 | 192.0 |
| C | 13 | 61 | 6285 | 28.44 | 820 | 826 | 192.0 |
| C | 12 | 4 | 3950 | 16.27 | 820 | 826 | 192.0 |
| D | 2 | 216 | 489981 | 2482.26 | 808 | 783 | 197.1 |
| D | 2 | 14 | 39275 | 195.31 | 808 | 783 | 197.1 |
| D | 13 | 105 | 31613 | 156.44 | 808 | 783 | 197.1 |
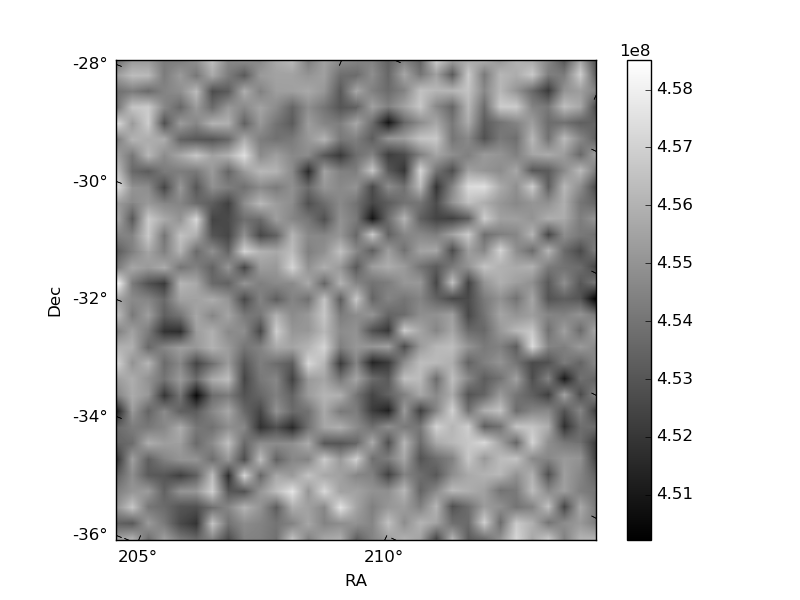
Histogram calculated using DETX and DETY for each event in the final _common_clean file
| Quadrant A | 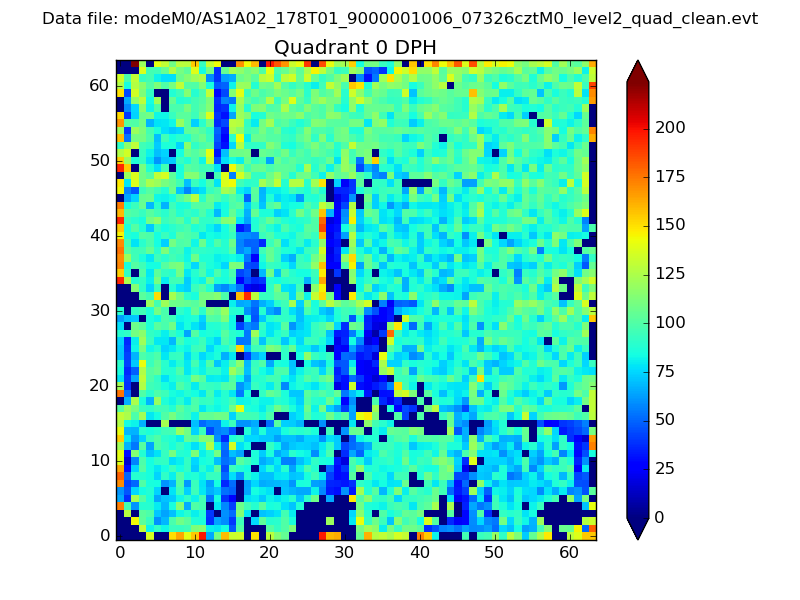 |
 |
Quadrant B |
|---|---|---|---|
| Quadrant D | 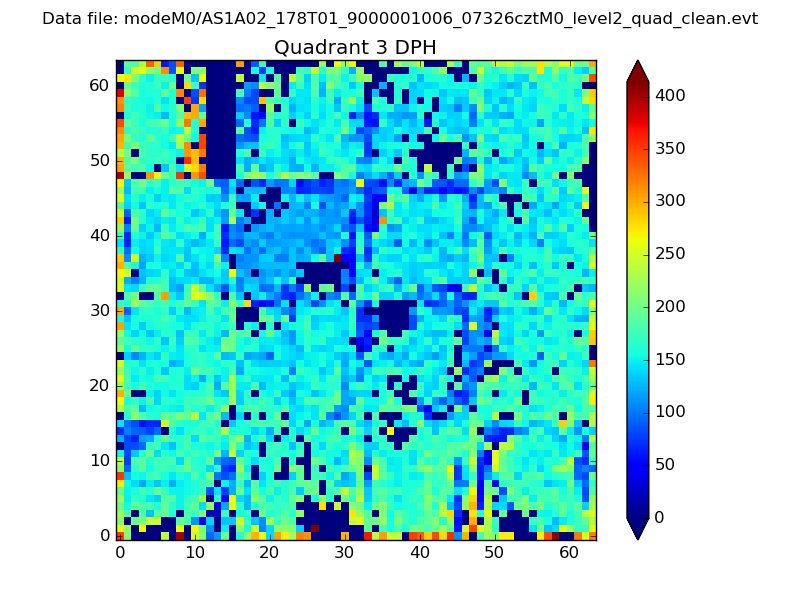 |
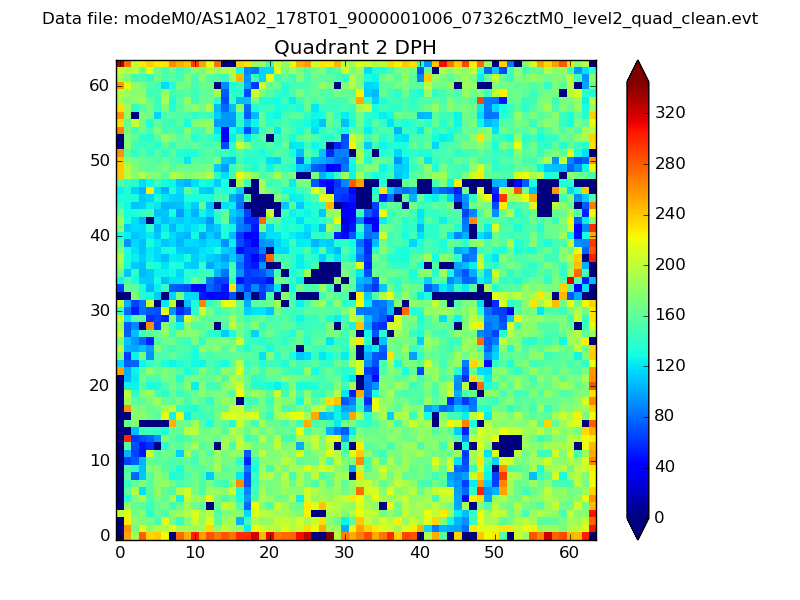 |
Quadrant C |
| Plot type | Count rate plots | Images |
|---|---|---|
| Comparison with Poisson distribution Blue bars denote a histogram of data divided into 1 sec bins. Red curve is a Poisson curve with rate = median count rate of data. |
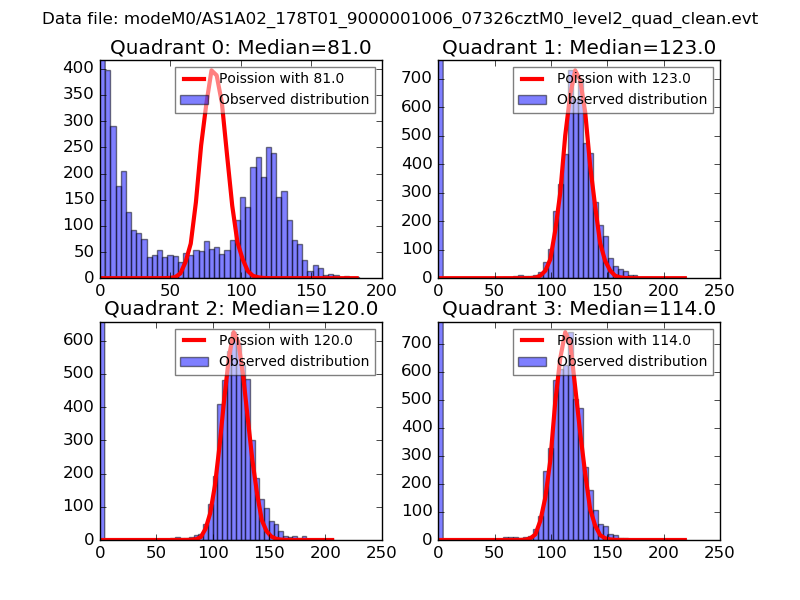 |
 |
| Quadrant-wise count rates Data is divided into 100 sec bins |
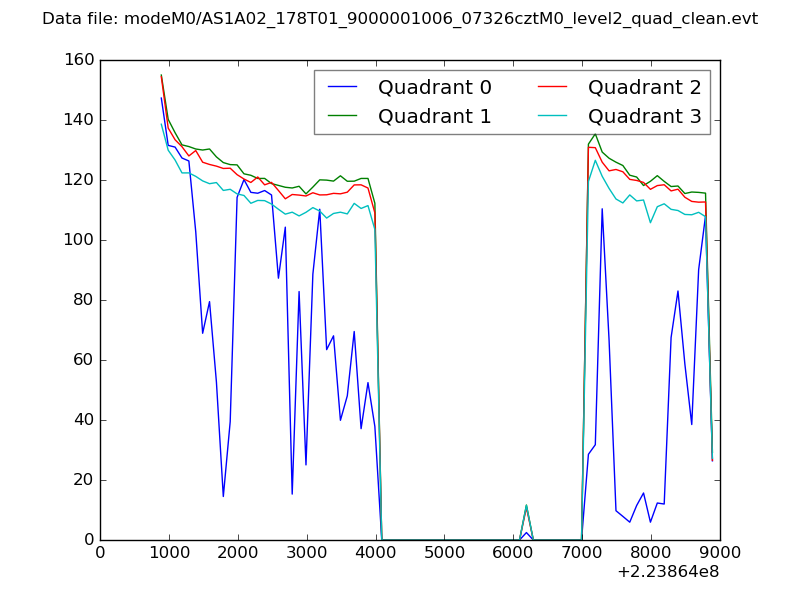 |
|
| Module-wise count rates for Quadrant A Data is divided into 100 sec bins |
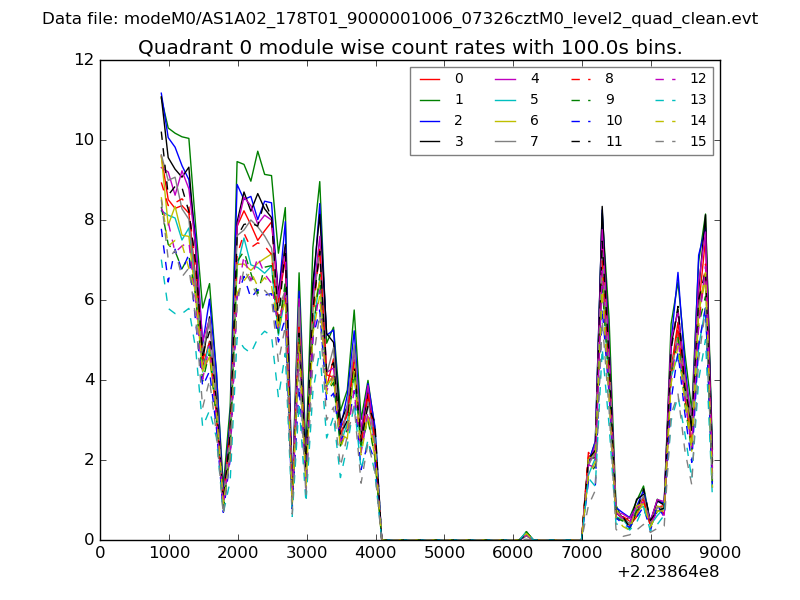 |
 |
| Module-wise count rates for Quadrant B Data is divided into 100 sec bins |
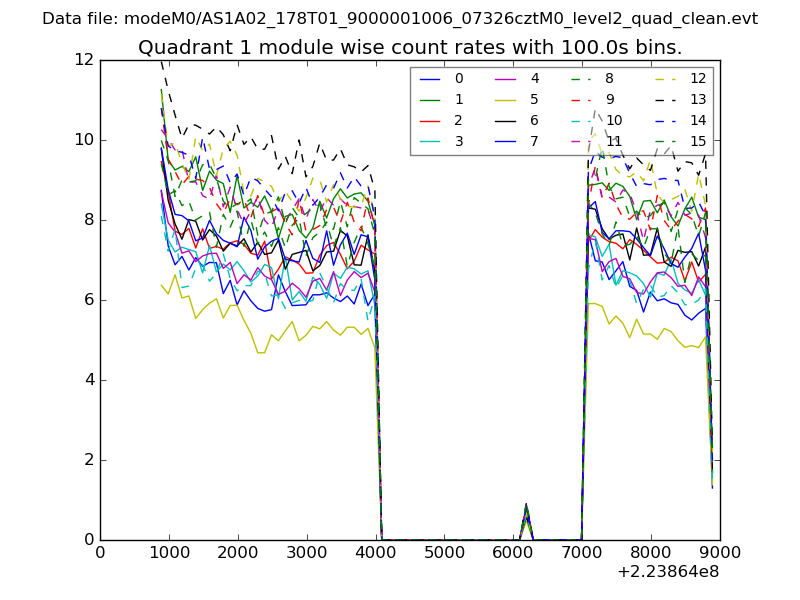 |
 |
| Module-wise count rates for Quadrant C Data is divided into 100 sec bins |
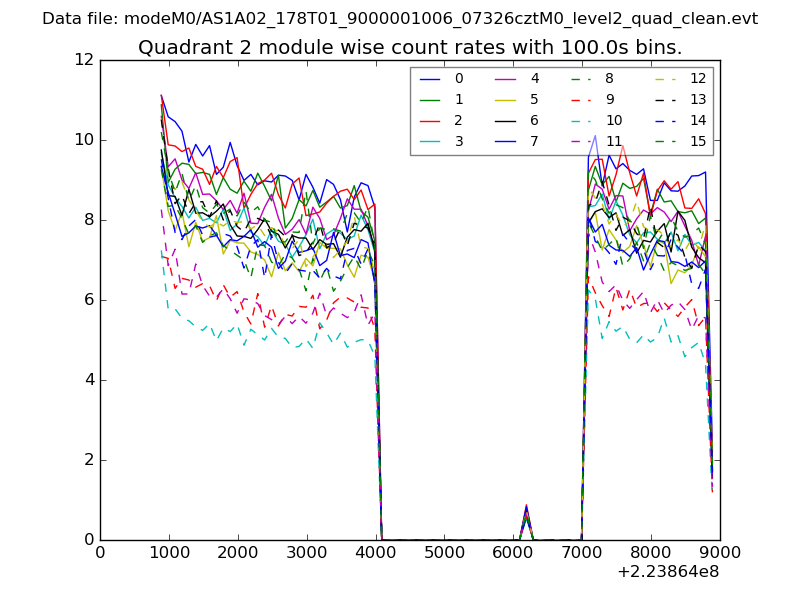 |
 |
| Module-wise count rates for Quadrant D Data is divided into 100 sec bins |
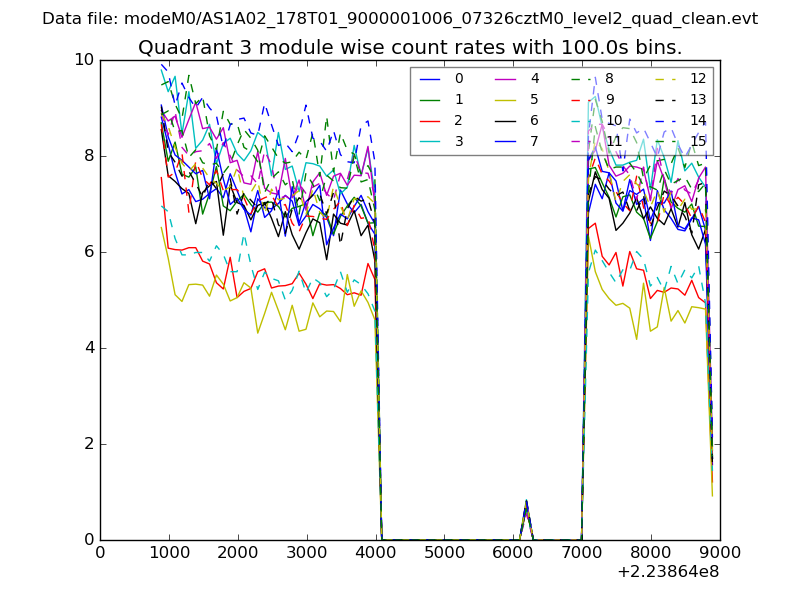 |
 |
| Parameter | Plot |
|---|---|
| CZT HV Monitor | 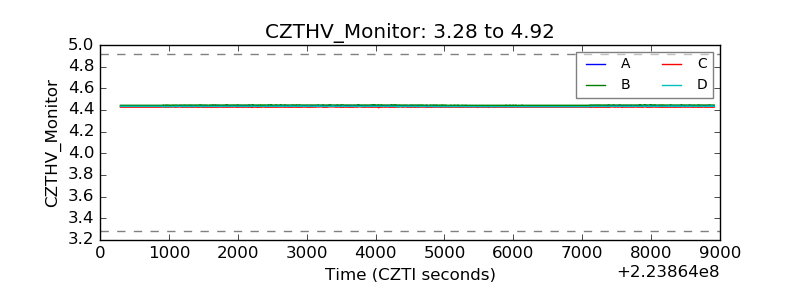 |
| D_VDD | 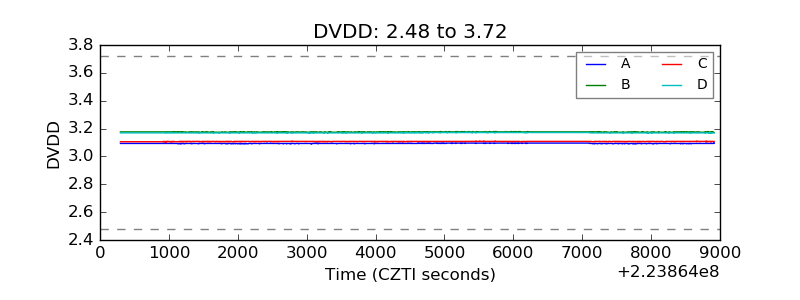 |
| Temperature 1 | 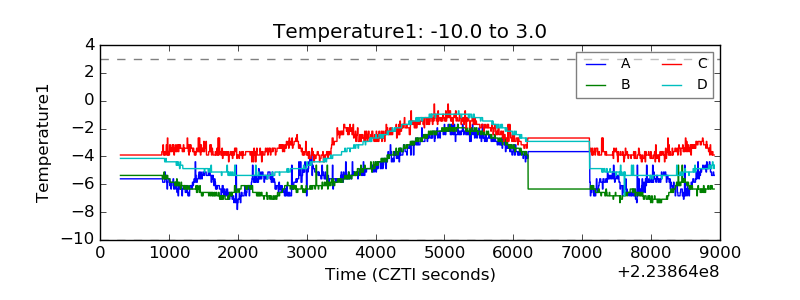 |
| Veto HV Monitor | 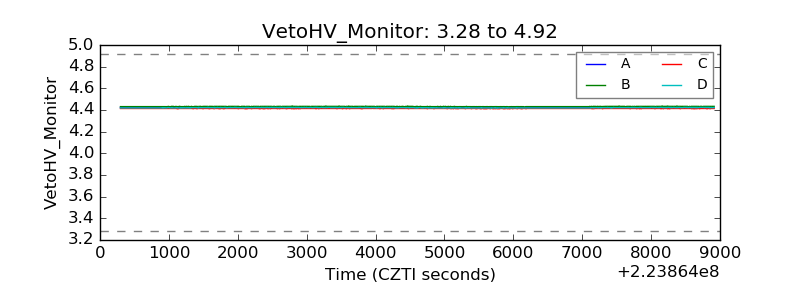 |
| Veto LLD | 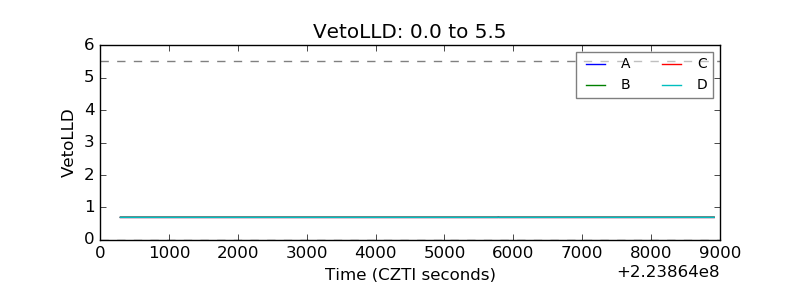 |
| Alpha Counter | 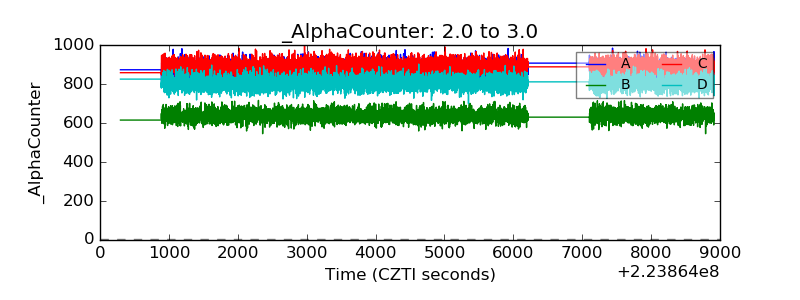 |
| _CPM_Rate | 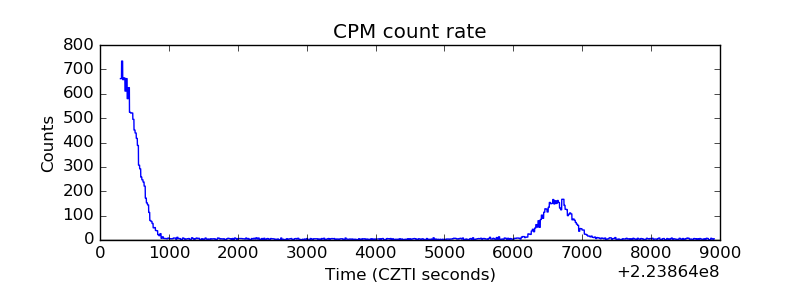 |
| CZT Counter |  |
| +2.5 Volts monitor |  |
| +5 Volts monitor |  |
| _ROLL_ROT | 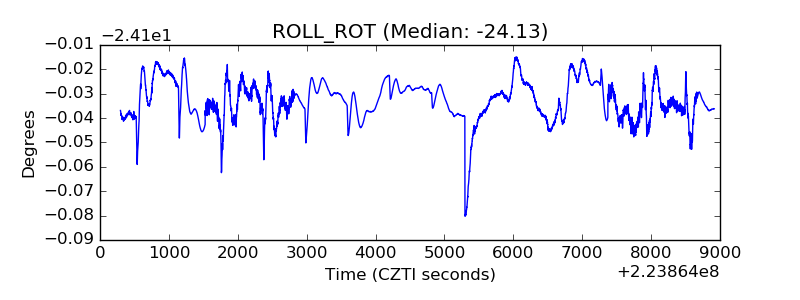 |
| _Roll_DEC | 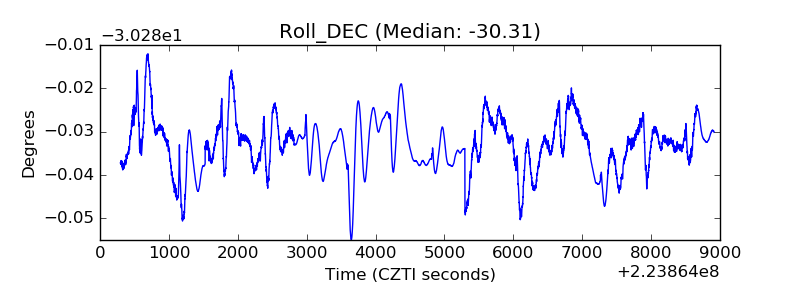 |
| _Roll_RA | 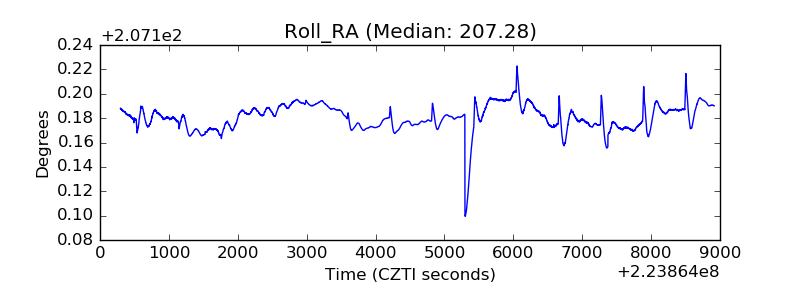 |
| Veto Counter | 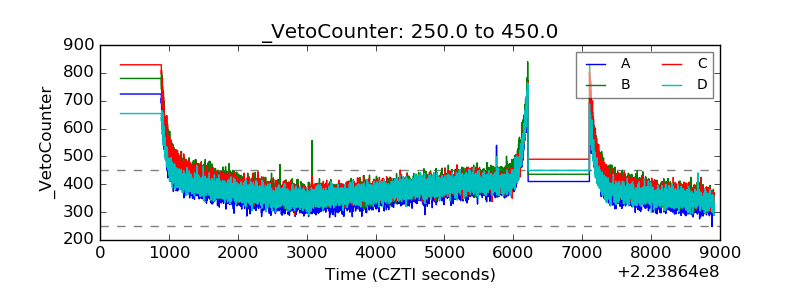 |