| Param | Original file | Final file |
|---|---|---|
| Filename | modeM0/AS1A02_178T01_9000001006_07327cztM0_level2.evt | modeM0/AS1A02_178T01_9000001006_07327cztM0_level2_quad_clean.evt |
| Size (bytes) | 743,823,360 | 85,279,680 |
| Size | 709.4 MB | 81.3 MB |
| Events in quadrant A | 11,534,316 | 303,602 |
| Events in quadrant B | 3,399,287 | 610,698 |
| Events in quadrant C | 3,260,022 | 599,788 |
| Events in quadrant D | 3,846,844 | 567,445 |
| Mode M0 | |||
|---|---|---|---|
| Quadrant | BADHDUFLAG | Total packets | Discarded packets |
| A | 0 | 39271 | 2 |
| B | 0 | 15096 | 1 |
| C | 0 | 14776 | 1 |
| D | 0 | 16760 | 1 |
| Mode SS | |||
|---|---|---|---|
| Quadrant | BADHDUFLAG | Total packets | Discarded packets |
| A | 0 | 146 | 0 |
| B | 0 | 146 | 0 |
| C | 0 | 146 | 0 |
| D | 0 | 146 | 0 |
| Mode M9 | |||
|---|---|---|---|
| Quadrant | BADHDUFLAG | Total packets | Discarded packets |
| A | 0 | 4 | 0 |
| B | 0 | 4 | 0 |
| C | 0 | 4 | 0 |
| D | 0 | 4 | 0 |
| Quadrant | Total seconds | Saturated seconds | Saturation percentage |
|---|---|---|---|
| A | 7167 | 3937 | 54.932329% |
| B | 7167 | 92 | 1.283661% |
| C | 7167 | 83 | 1.158086% |
| D | 7167 | 153 | 2.134784% |
Noise dominated data is calculated using 1-second bins in cleaned event files. If a bin has >2000 counts, and if more than 50% of those come from <1% of pixels, then it is considered to be noise-dominated and hence unusable.
| Quadrant | # 1 sec bins | Bins with >0 counts | Bins with >2000 counts | High rate bins dominated by noise | Noise dominated (total time) | Noise dominated (detector-on time) | Marked lightcurve |
|---|---|---|---|---|---|---|---|
| A | 7581 | 7166 | 2928 | 2928 | 38.62% | 40.86% | 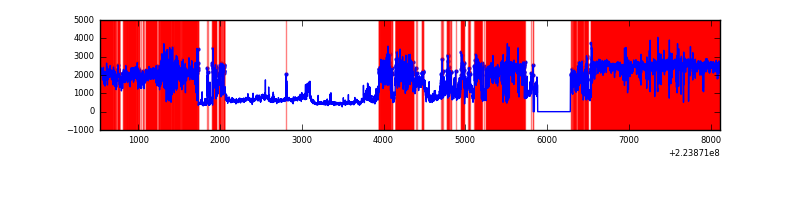 |
| B | 7582 | 7169 | 1 | 1 | 0.01% | 0.01% | 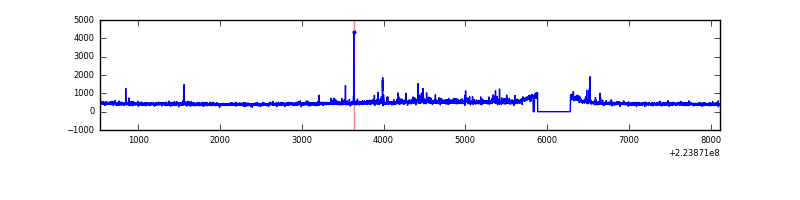 |
| C | 7582 | 7169 | 4 | 4 | 0.05% | 0.06% | 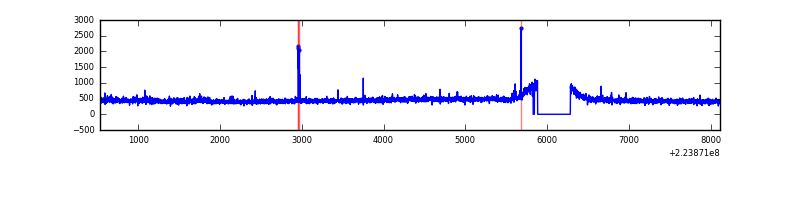 |
| D | 7582 | 7169 | 70 | 70 | 0.92% | 0.98% | 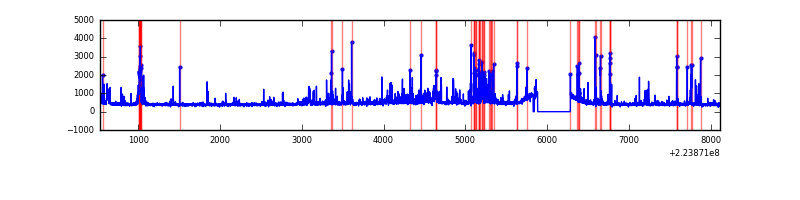 |
Top three noisy pixels from each quadrant. If the there are fewer than three noisy pixels in the level2.evt file, extra rows are filled as -1
| Pixel properties | Quadrant properties | ||||||
|---|---|---|---|---|---|---|---|
| Quadrant | DetID | PixID | Counts | Sigma | Mean | Median | Sigma |
| A | 15 | 234 | 9370712 | 80712.94 | 556 | 543 | 116.1 |
| A | 15 | 250 | 16361 | 136.25 | 556 | 543 | 116.1 |
| A | 0 | 226 | 5097 | 39.23 | 556 | 543 | 116.1 |
| B | 0 | 214 | 64179 | 391.99 | 836 | 814 | 161.7 |
| B | 4 | 81 | 42232 | 256.22 | 836 | 814 | 161.7 |
| B | 11 | 51 | 38032 | 230.24 | 836 | 814 | 161.7 |
| C | 9 | 68 | 75766 | 394.49 | 815 | 818 | 190.0 |
| C | 13 | 61 | 6279 | 28.74 | 815 | 818 | 190.0 |
| C | 12 | 4 | 3691 | 15.12 | 815 | 818 | 190.0 |
| D | 2 | 216 | 429260 | 2170.84 | 806 | 782 | 197.4 |
| D | 14 | 34 | 219705 | 1109.15 | 806 | 782 | 197.4 |
| D | 12 | 233 | 98957 | 497.39 | 806 | 782 | 197.4 |
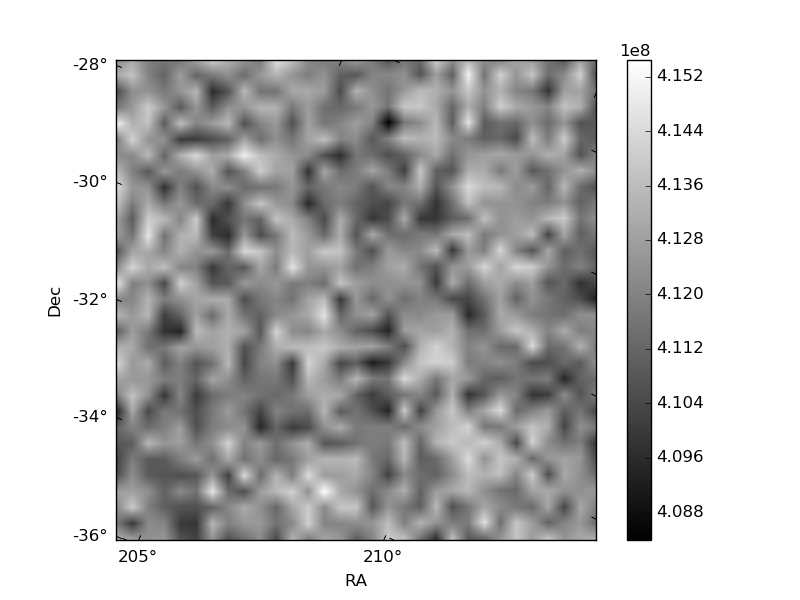
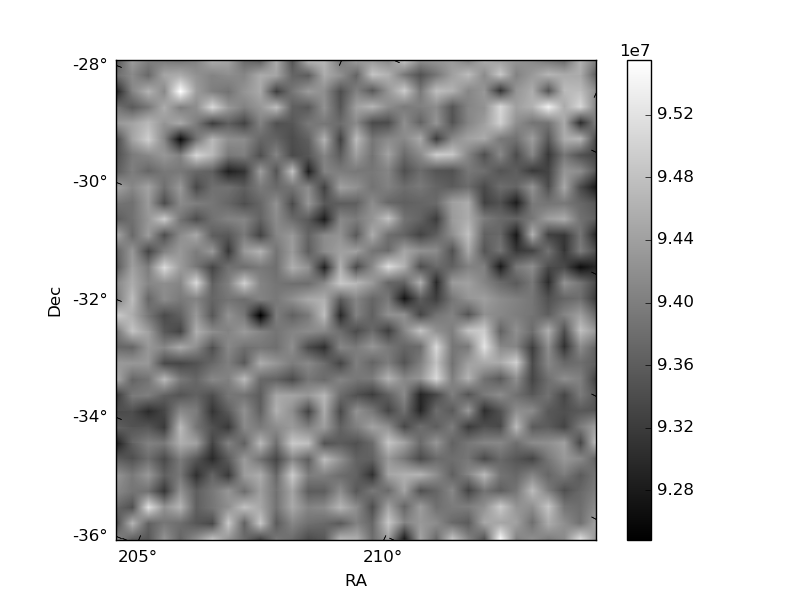
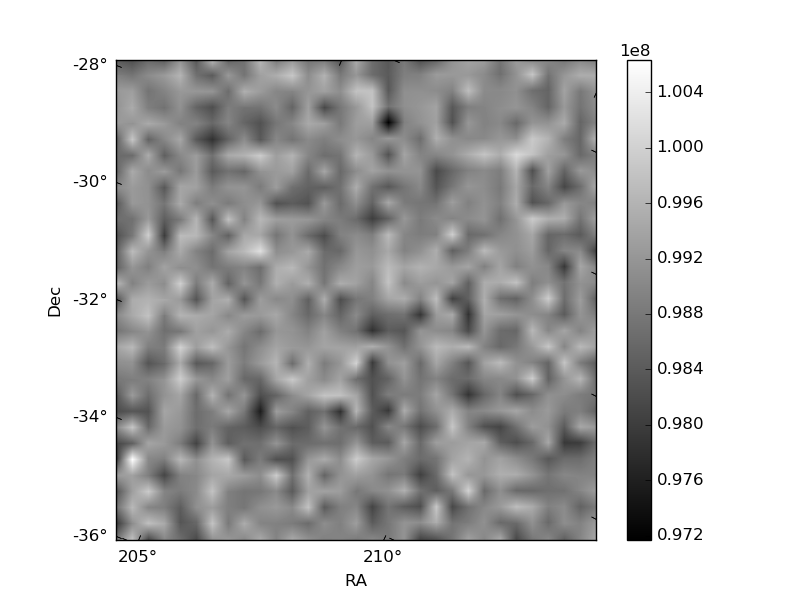
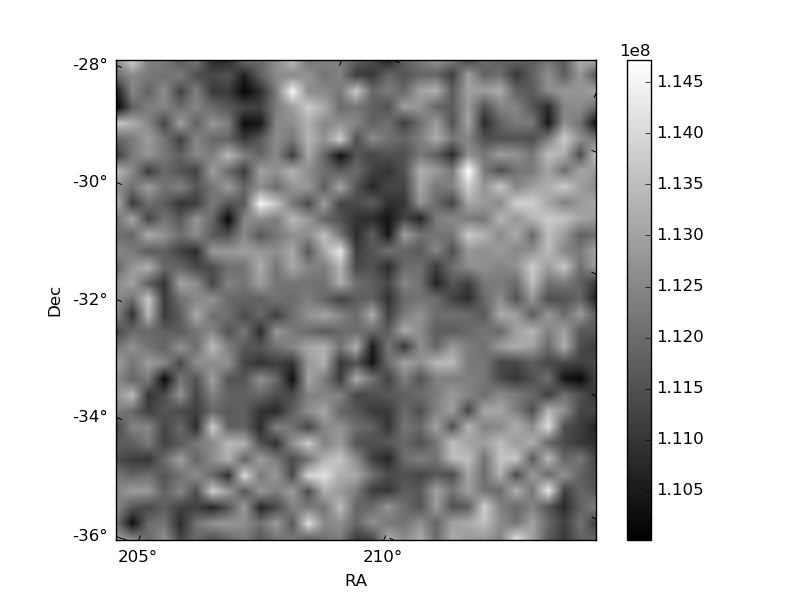
Histogram calculated using DETX and DETY for each event in the final _common_clean file
| Quadrant A | 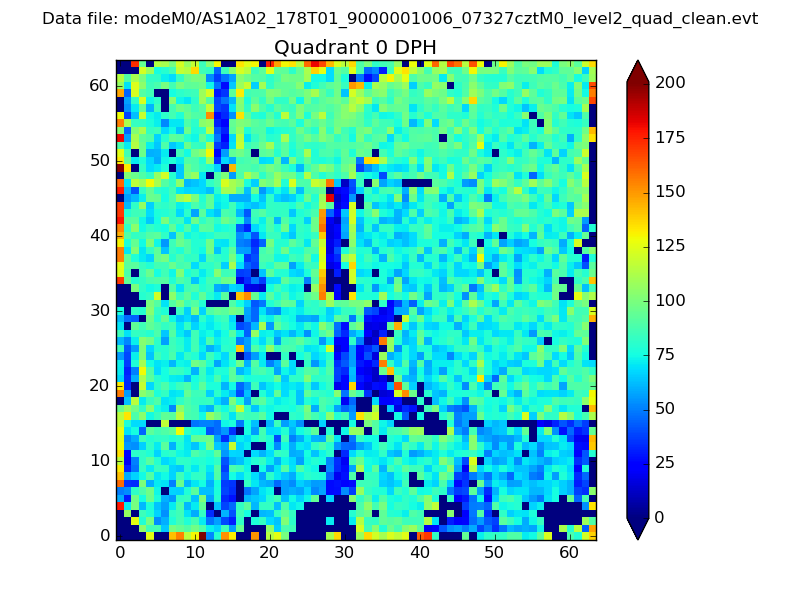 |
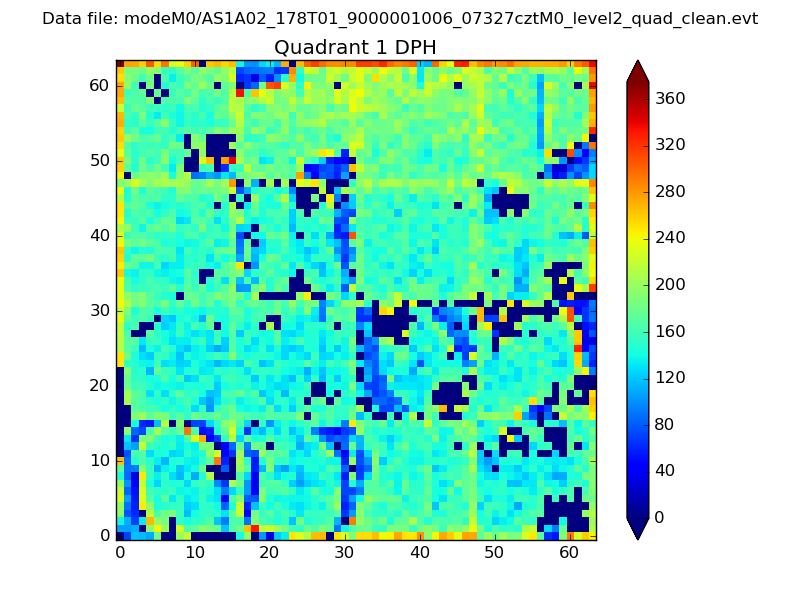 |
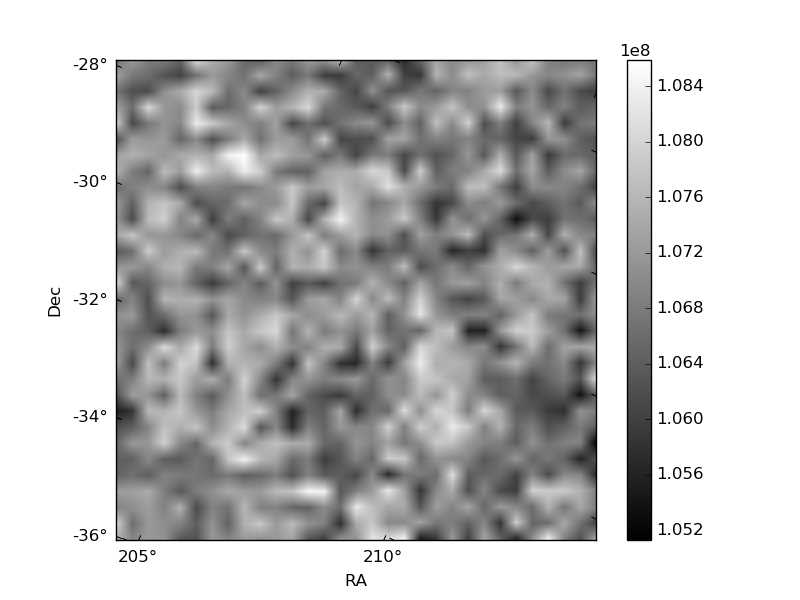
Quadrant B |
|---|---|---|---|
| Quadrant D | 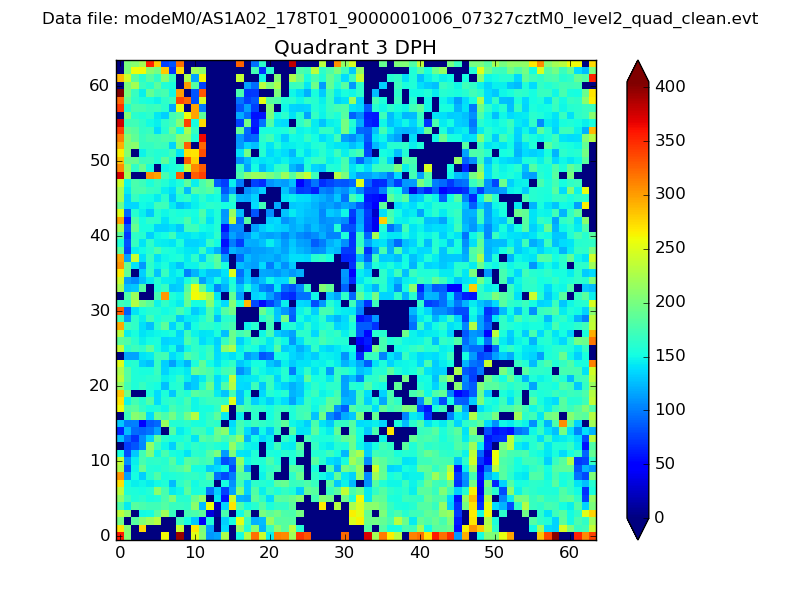 |
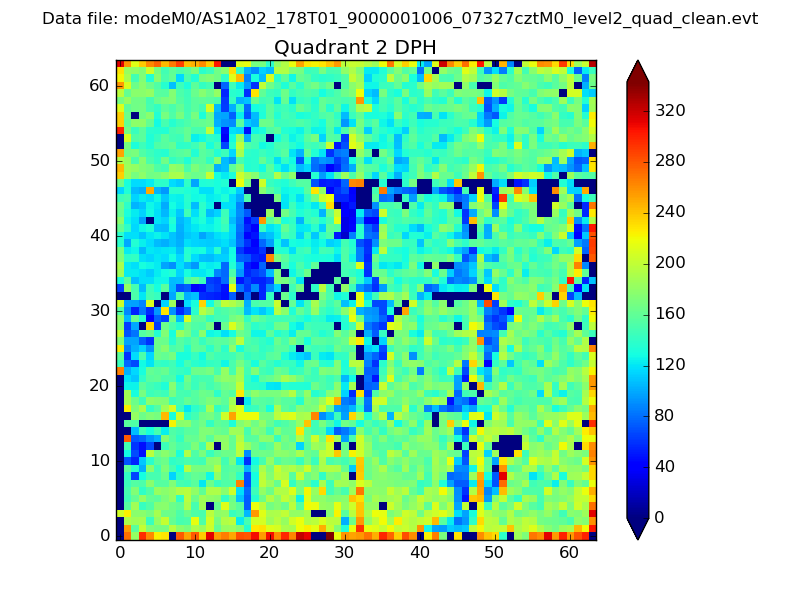 |
Quadrant C |
| Plot type | Count rate plots | Images |
|---|---|---|
| Comparison with Poisson distribution Blue bars denote a histogram of data divided into 1 sec bins. Red curve is a Poisson curve with rate = median count rate of data. |
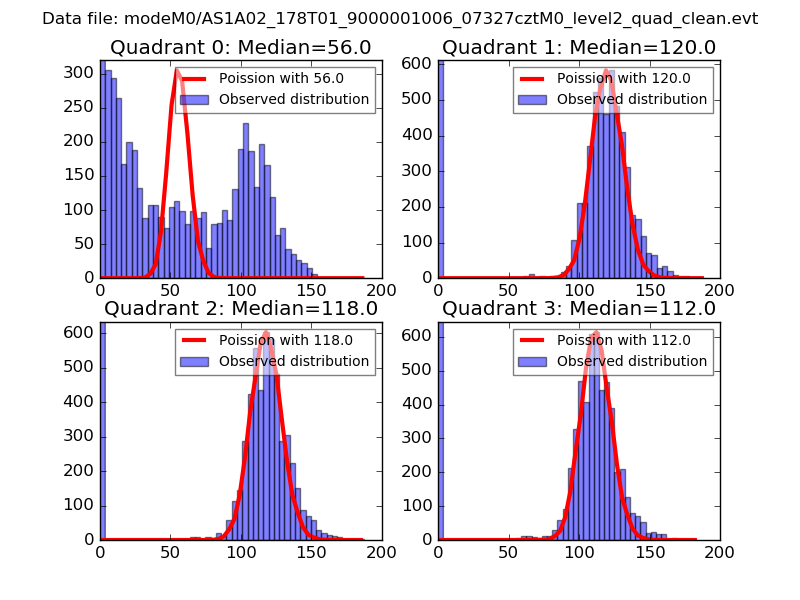 |
 |
| Quadrant-wise count rates Data is divided into 100 sec bins |
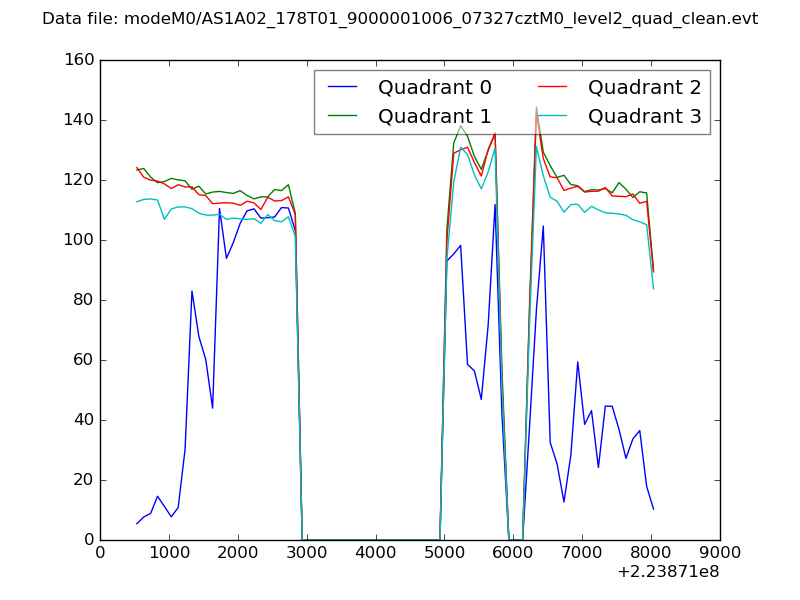 |
|
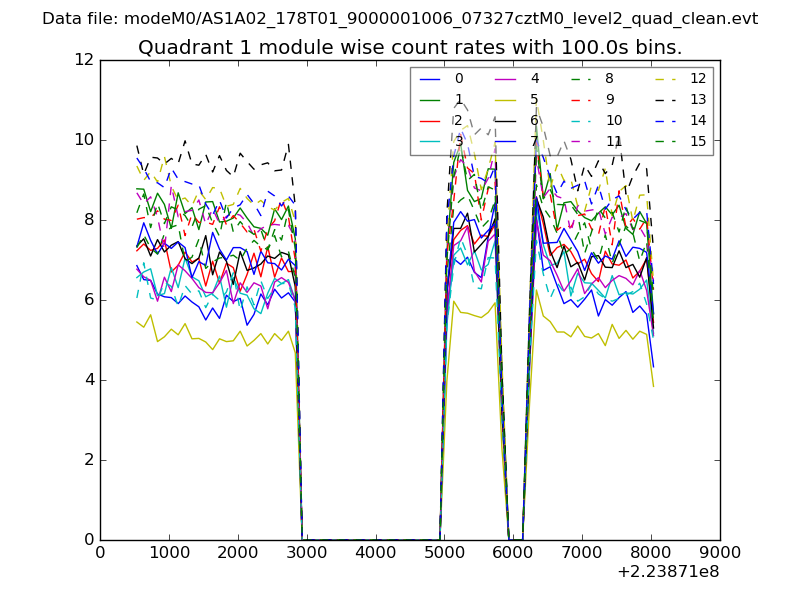
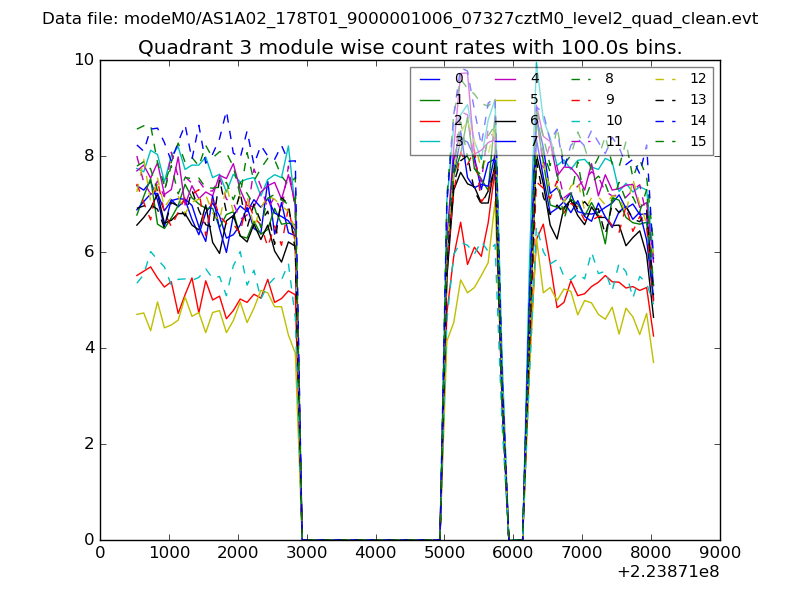
| Module-wise count rates for Quadrant A Data is divided into 100 sec bins |
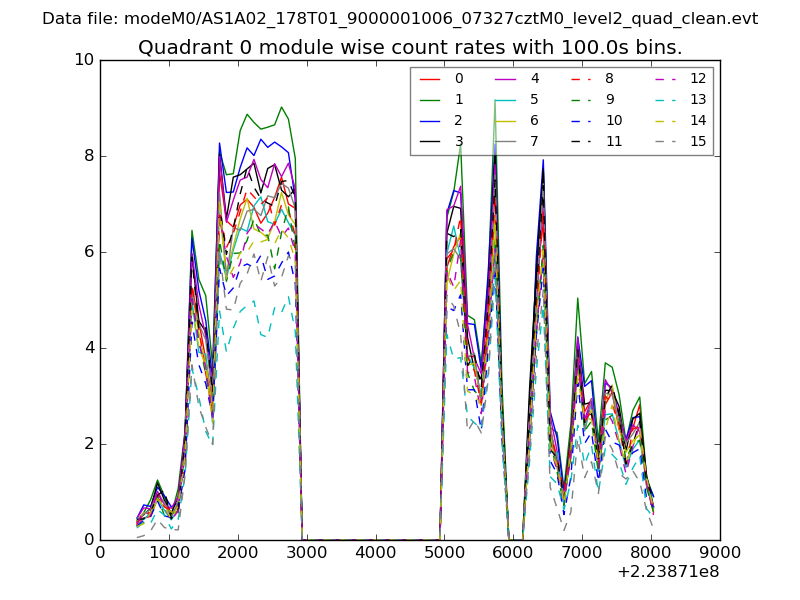 |
 |
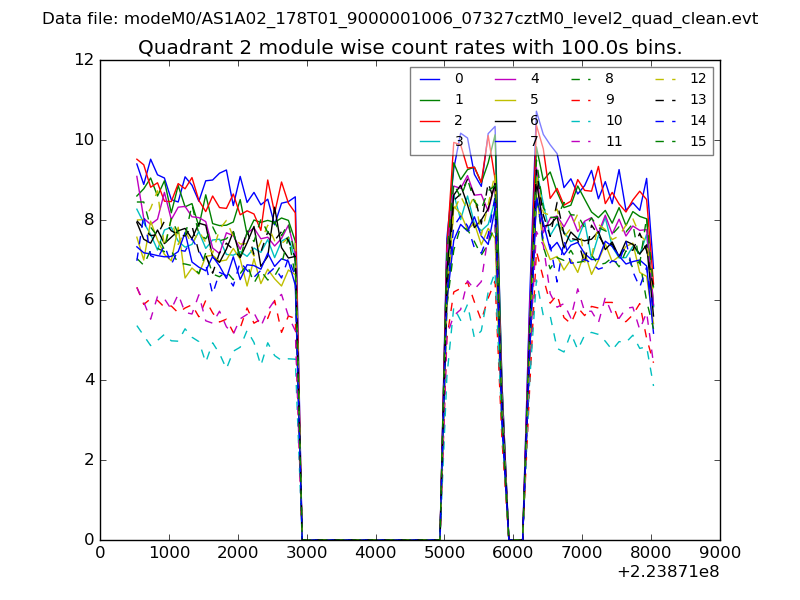
| Module-wise count rates for Quadrant B Data is divided into 100 sec bins |
 |
 |
| Module-wise count rates for Quadrant C Data is divided into 100 sec bins |
 |
 |
| Module-wise count rates for Quadrant D Data is divided into 100 sec bins |
 |
 |
| Parameter | Plot |
|---|---|
| CZT HV Monitor | 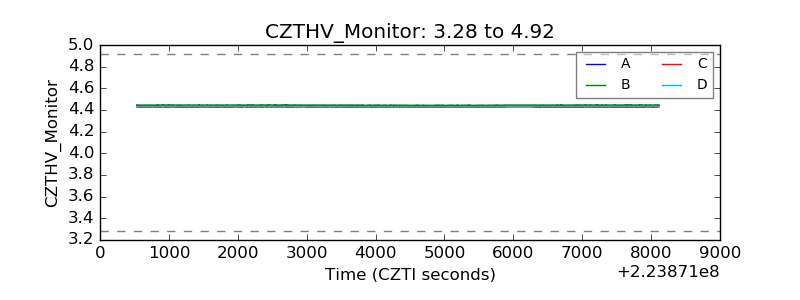 |
| D_VDD | 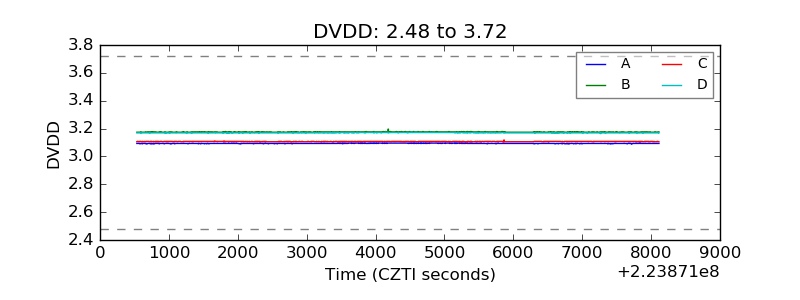 |
| Temperature 1 | 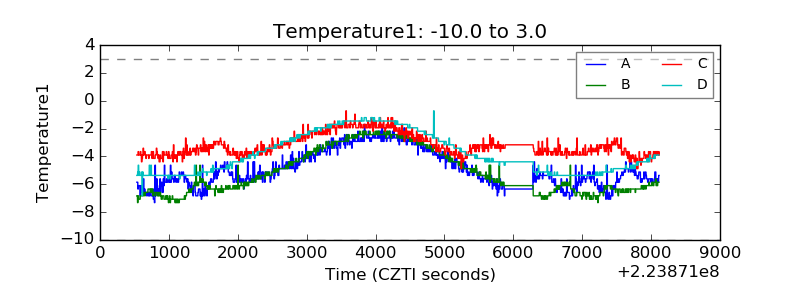 |
| Veto HV Monitor | 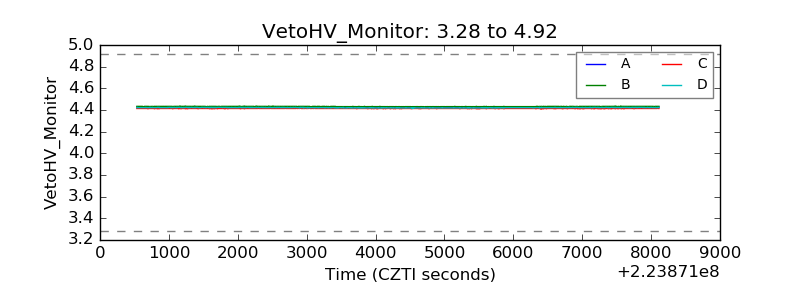 |
| Veto LLD | 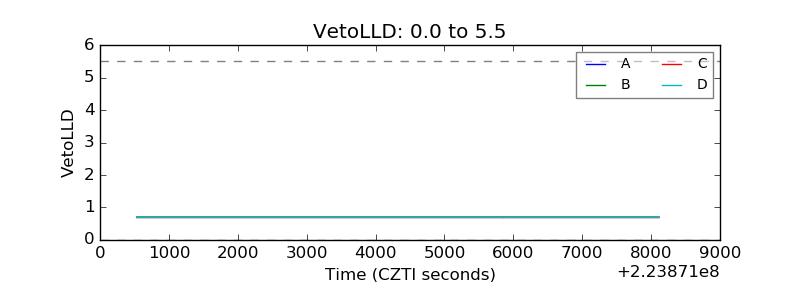 |
| Alpha Counter | 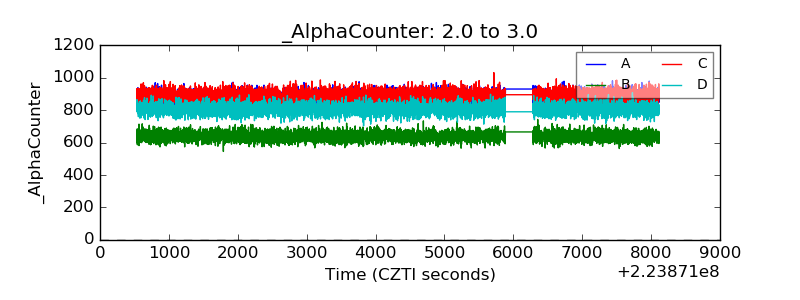 |
| _CPM_Rate | 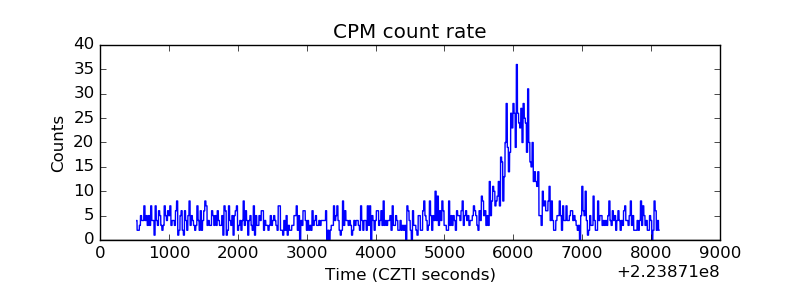 |
| CZT Counter | 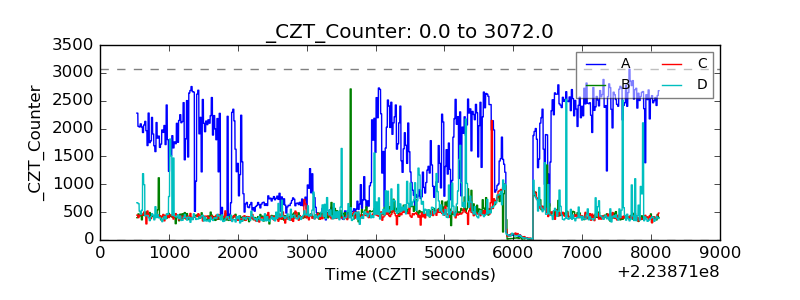 |
| +2.5 Volts monitor |  |
| +5 Volts monitor |  |
| _ROLL_ROT | 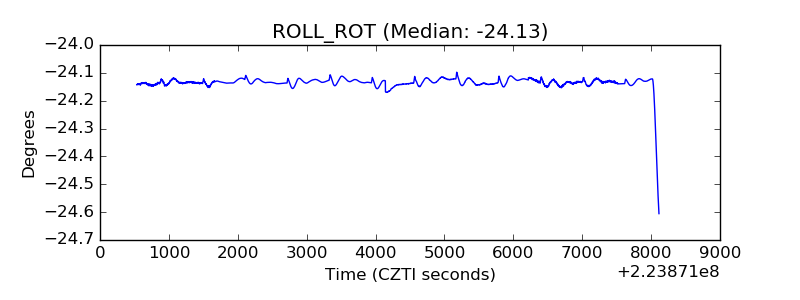 |
| _Roll_DEC | 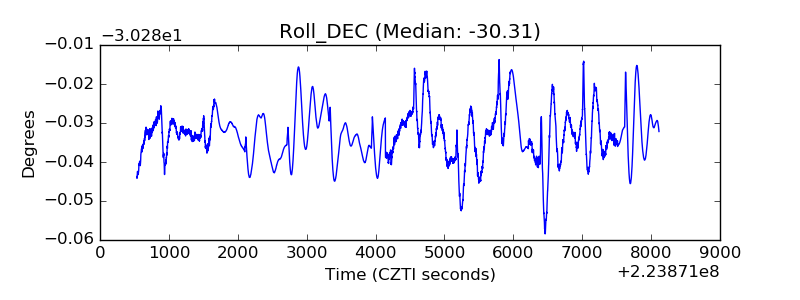 |
| _Roll_RA | 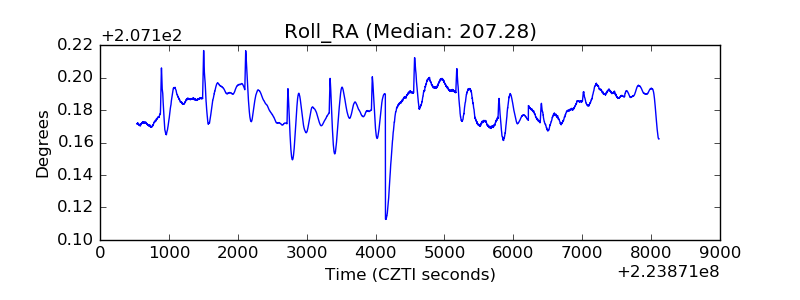 |
| Veto Counter | 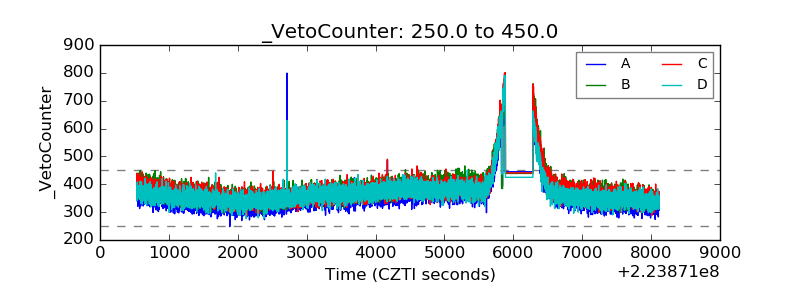 |