| Param | Original file | Final file |
|---|---|---|
| Filename | modeM0/AS1A02_178T01_9000001006_07333cztM0_level2.evt | modeM0/AS1A02_178T01_9000001006_07333cztM0_level2_quad_clean.evt |
| Size (bytes) | 780,410,880 | 66,885,120 |
| Size | 744.3 MB | 63.8 MB |
| Events in quadrant A | 13,169,372 | 184,977 |
| Events in quadrant B | 2,936,445 | 490,913 |
| Events in quadrant C | 2,806,243 | 480,609 |
| Events in quadrant D | 4,307,015 | 438,671 |
| Mode M0 | |||
|---|---|---|---|
| Quadrant | BADHDUFLAG | Total packets | Discarded packets |
| A | 0 | 43257 | 1 |
| B | 0 | 12918 | 0 |
| C | 0 | 12683 | 0 |
| D | 0 | 17244 | 0 |
| Mode SS | |||
|---|---|---|---|
| Quadrant | BADHDUFLAG | Total packets | Discarded packets |
| A | 0 | 122 | 0 |
| B | 0 | 122 | 0 |
| C | 0 | 122 | 0 |
| D | 0 | 122 | 0 |
| Quadrant | Total seconds | Saturated seconds | Saturation percentage |
|---|---|---|---|
| A | 6133 | 5210 | 84.950269% |
| B | 6133 | 104 | 1.695744% |
| C | 6133 | 76 | 1.239198% |
| D | 6133 | 531 | 8.658079% |
Noise dominated data is calculated using 1-second bins in cleaned event files. If a bin has >2000 counts, and if more than 50% of those come from <1% of pixels, then it is considered to be noise-dominated and hence unusable.
| Quadrant | # 1 sec bins | Bins with >0 counts | Bins with >2000 counts | High rate bins dominated by noise | Noise dominated (total time) | Noise dominated (detector-on time) | Marked lightcurve |
|---|---|---|---|---|---|---|---|
| A | 6132 | 6132 | 4280 | 4280 | 69.80% | 69.80% | 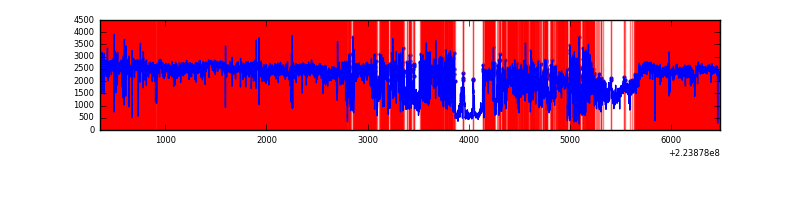 |
| B | 6133 | 6133 | 1 | 1 | 0.02% | 0.02% | 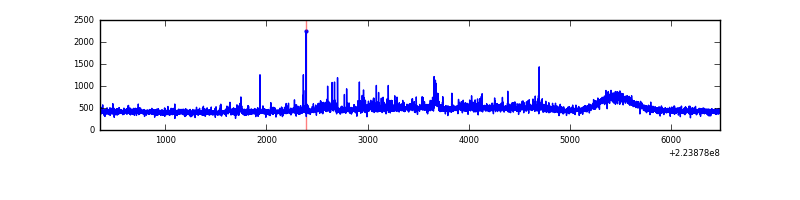 |
| C | 6133 | 6133 | 0 | 0 | 0.00% | 0.00% | 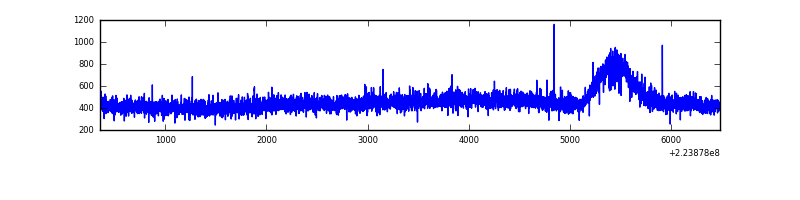 |
| D | 6133 | 6133 | 306 | 306 | 4.99% | 4.99% | 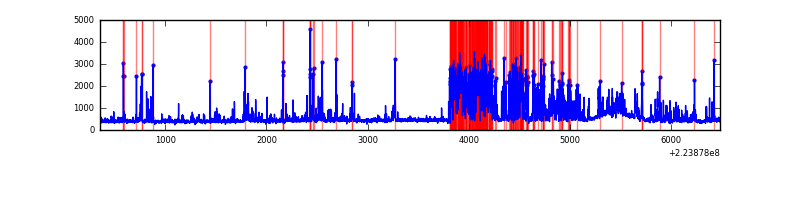 |
Top three noisy pixels from each quadrant. If the there are fewer than three noisy pixels in the level2.evt file, extra rows are filled as -1
| Pixel properties | Quadrant properties | ||||||
|---|---|---|---|---|---|---|---|
| Quadrant | DetID | PixID | Counts | Sigma | Mean | Median | Sigma |
| A | 15 | 234 | 11901182 | 173579.09 | 326 | 318 | 68.6 |
| A | 14 | 111 | 4910 | 66.98 | 326 | 318 | 68.6 |
| A | 13 | 248 | 3437 | 45.49 | 326 | 318 | 68.6 |
| B | 11 | 51 | 36899 | 257.9 | 725 | 705 | 140.3 |
| B | 0 | 214 | 35992 | 251.44 | 725 | 705 | 140.3 |
| B | 0 | 213 | 22215 | 153.27 | 725 | 705 | 140.3 |
| C | 9 | 68 | 50224 | 300.14 | 706 | 706 | 165.0 |
| C | 13 | 61 | 5465 | 28.85 | 706 | 706 | 165.0 |
| C | 10 | 22 | 3035 | 14.12 | 706 | 706 | 165.0 |
| D | 2 | 216 | 1551511 | 9144.07 | 686 | 662 | 169.6 |
| D | 14 | 34 | 84784 | 496.0 | 686 | 662 | 169.6 |
| D | 12 | 233 | 53216 | 309.87 | 686 | 662 | 169.6 |
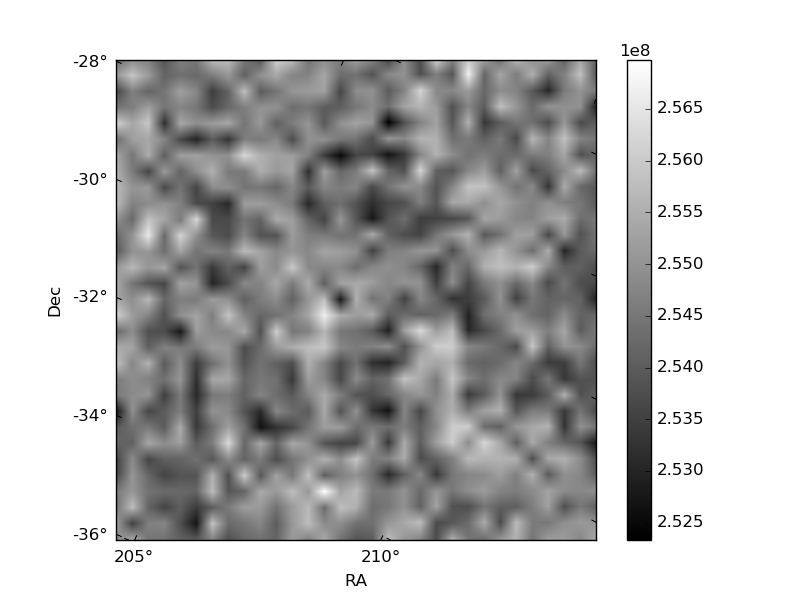
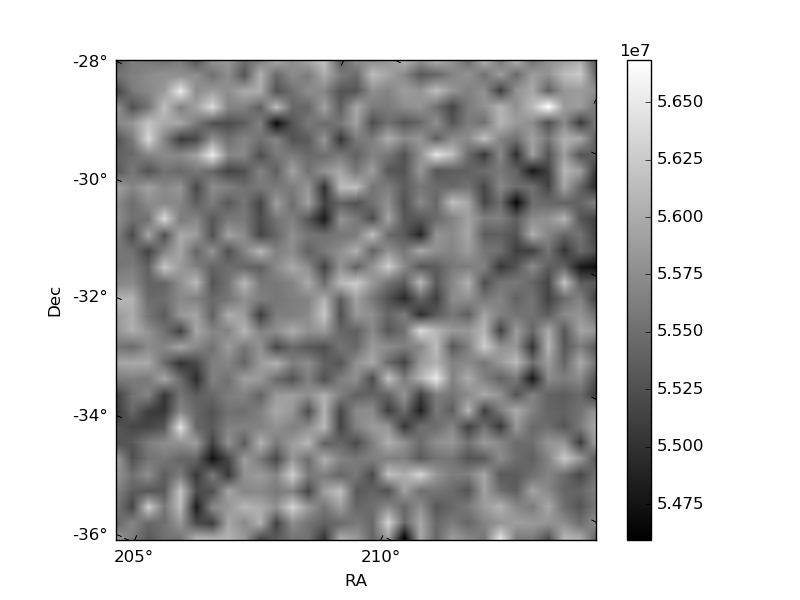
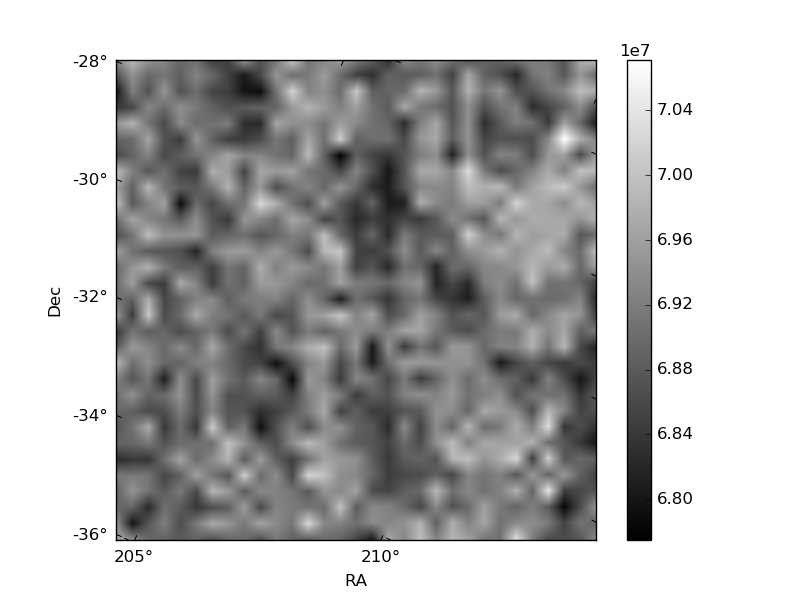
Histogram calculated using DETX and DETY for each event in the final _common_clean file
| Quadrant A | 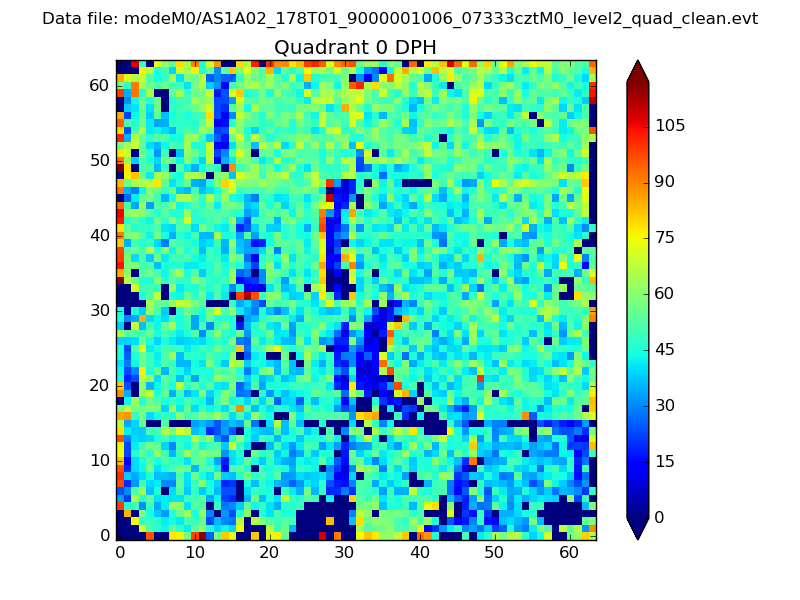 |
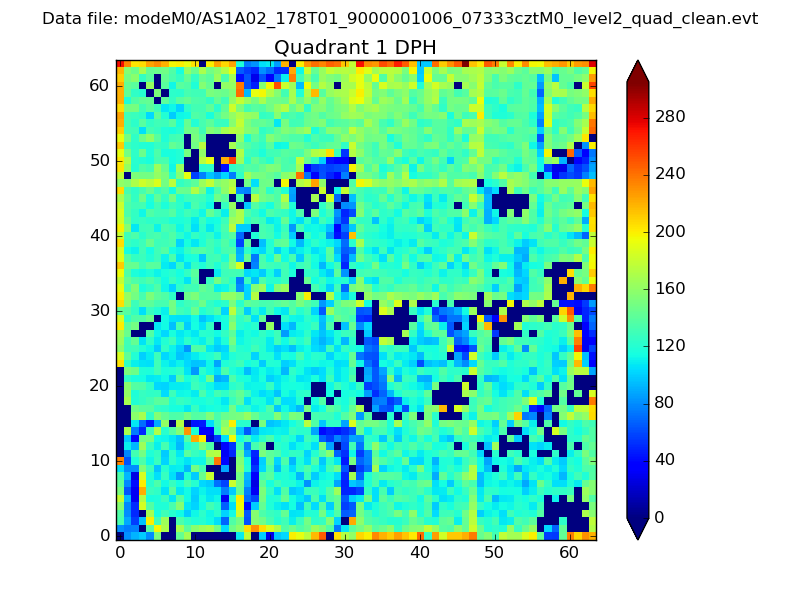 |
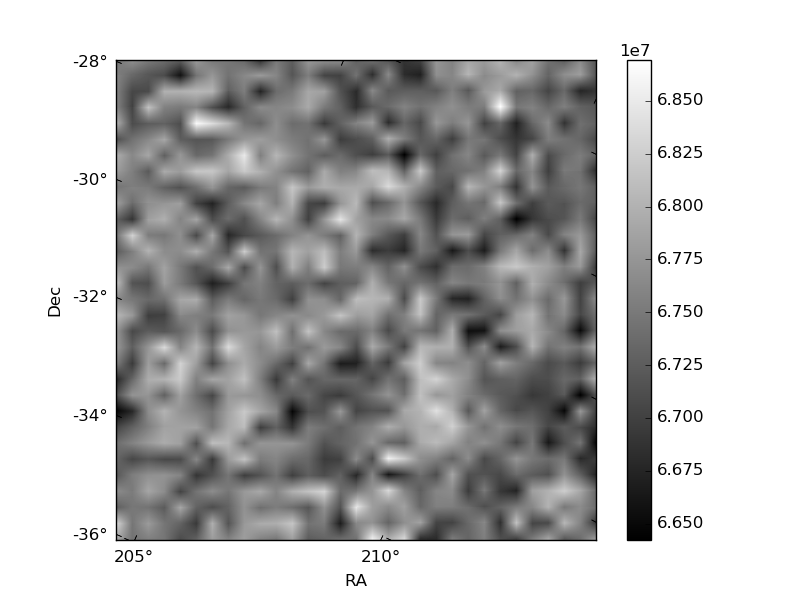
Quadrant B |
|---|---|---|---|
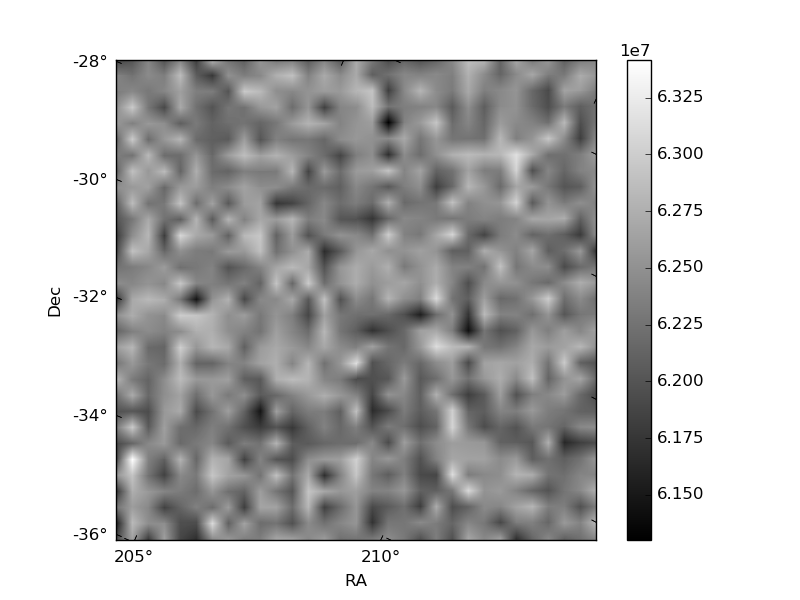
| Quadrant D | 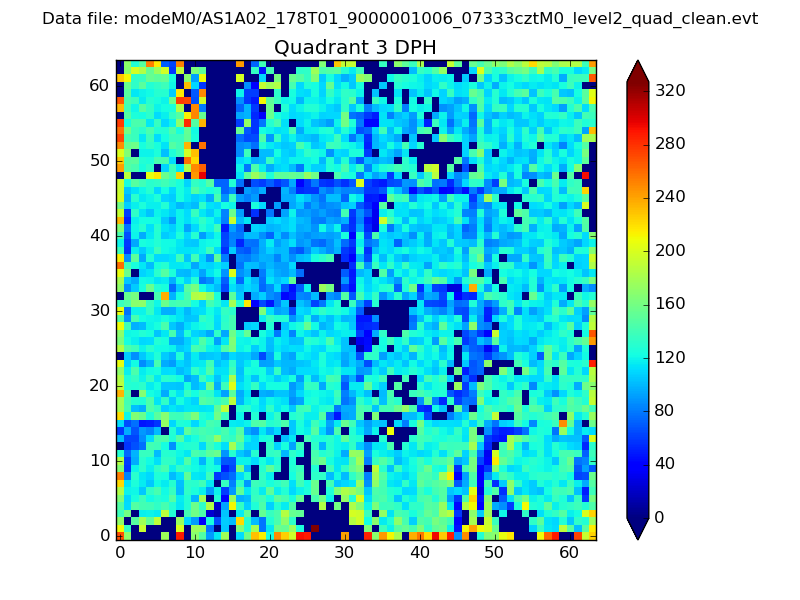 |
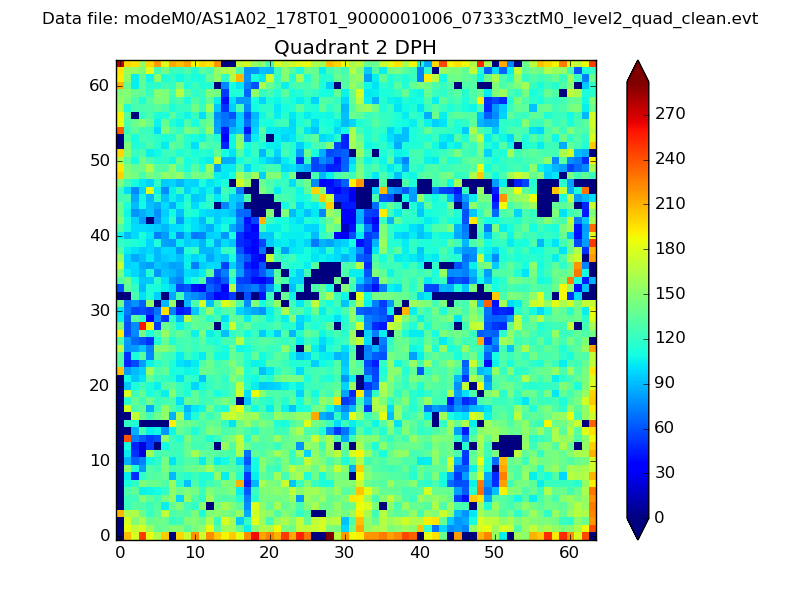 |
Quadrant C |
| Plot type | Count rate plots | Images |
|---|---|---|
| Comparison with Poisson distribution Blue bars denote a histogram of data divided into 1 sec bins. Red curve is a Poisson curve with rate = median count rate of data. |
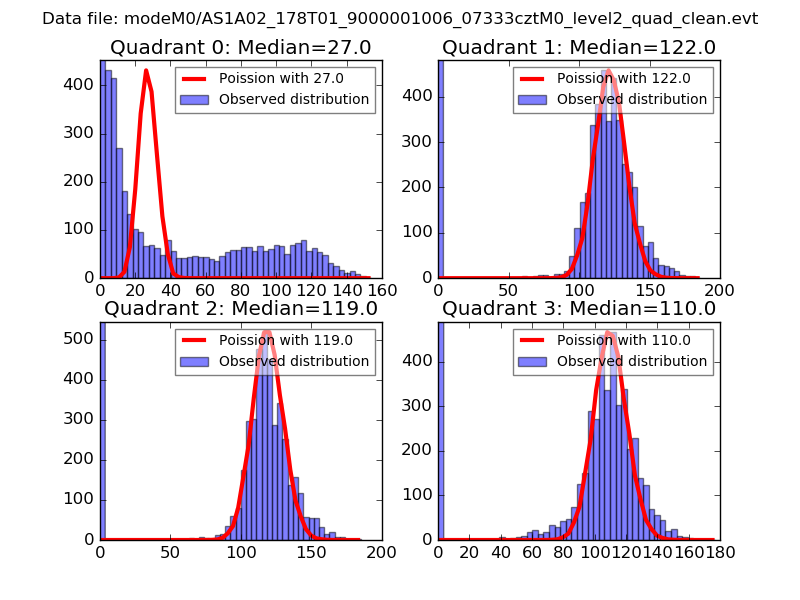 |
 |
| Quadrant-wise count rates Data is divided into 100 sec bins |
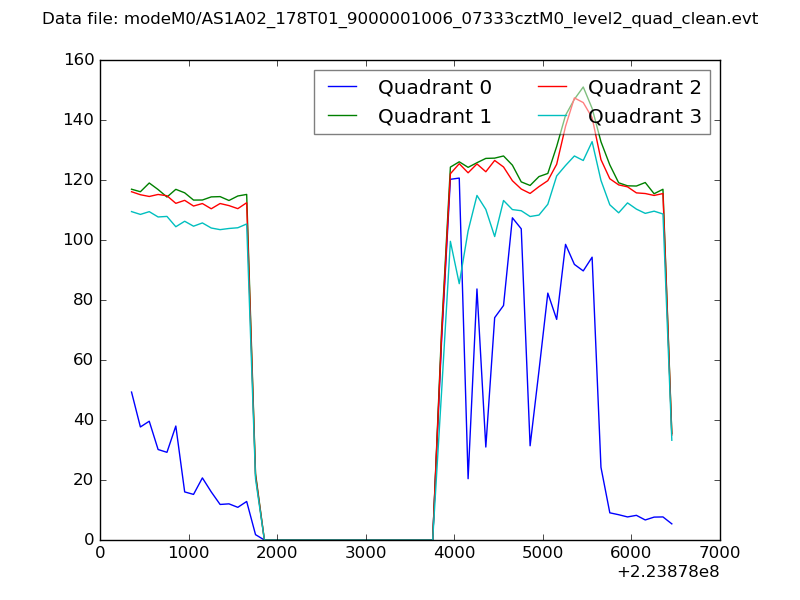 |
|
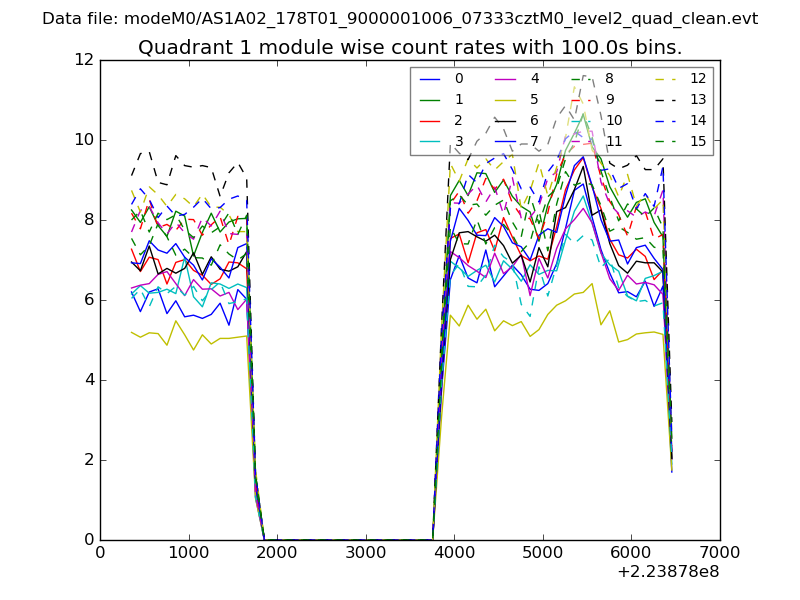
| Module-wise count rates for Quadrant A Data is divided into 100 sec bins |
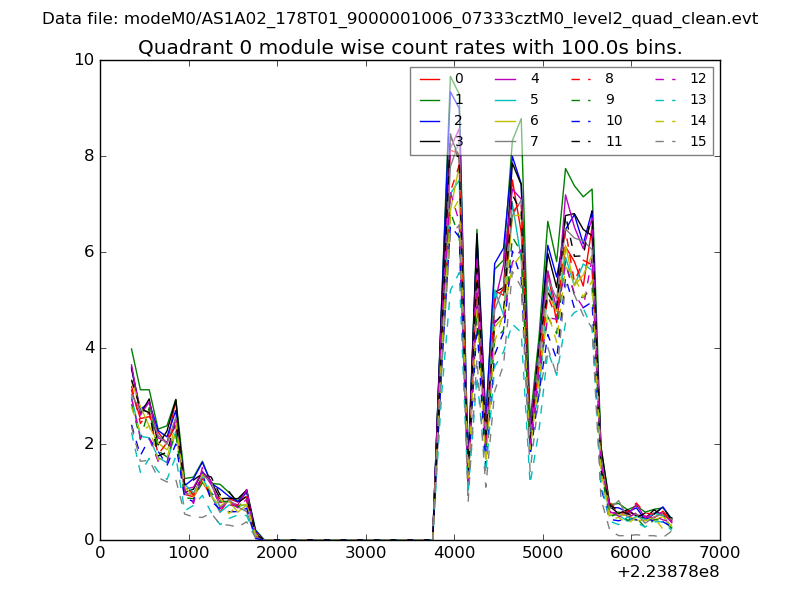 |
 |
| Module-wise count rates for Quadrant B Data is divided into 100 sec bins |
 |
 |
| Module-wise count rates for Quadrant C Data is divided into 100 sec bins |
 |
 |
| Module-wise count rates for Quadrant D Data is divided into 100 sec bins |
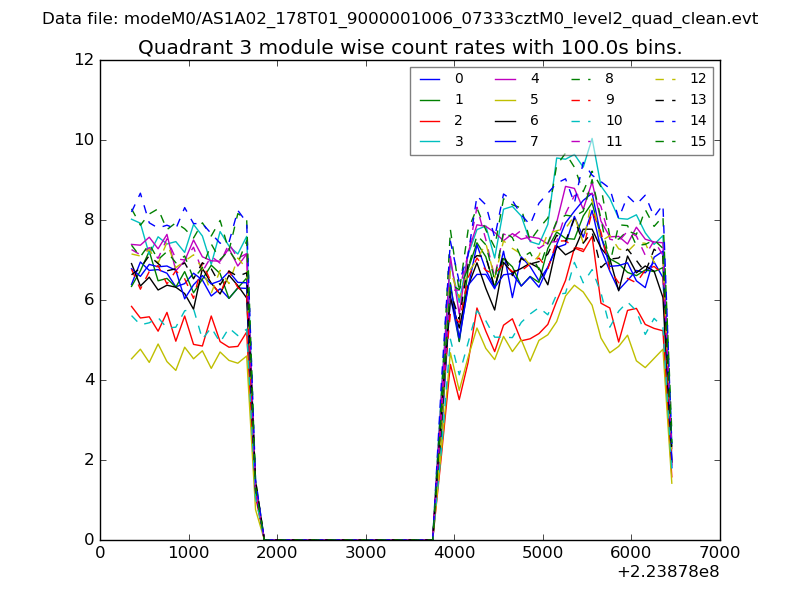 |
 |
| Parameter | Plot |
|---|---|
| CZT HV Monitor | 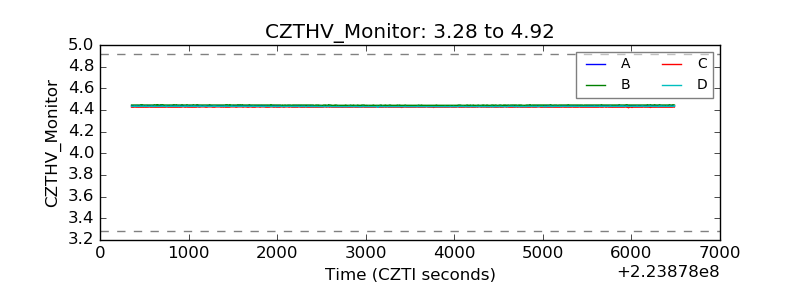 |
| D_VDD | 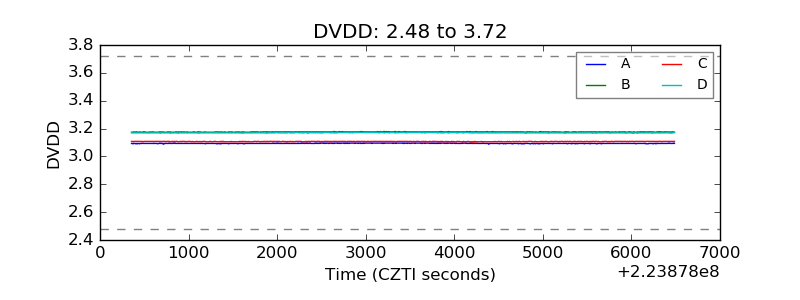 |
| Temperature 1 | 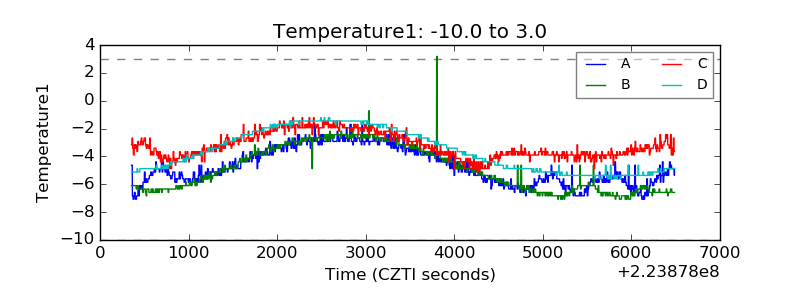 |
| Veto HV Monitor | 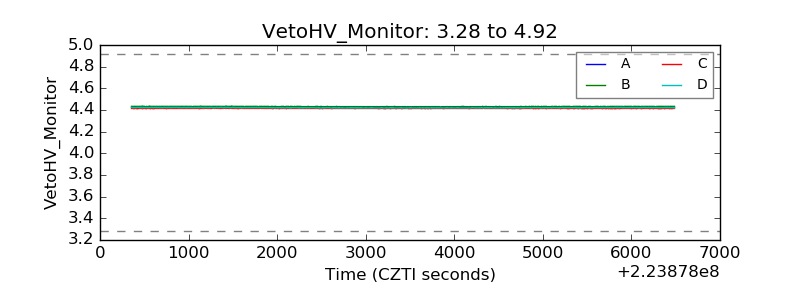 |
| Veto LLD | 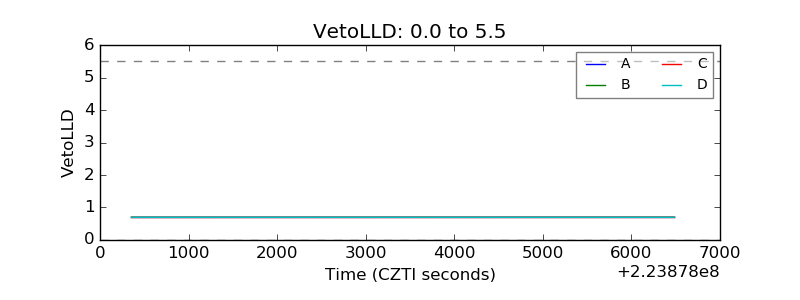 |
| Alpha Counter | 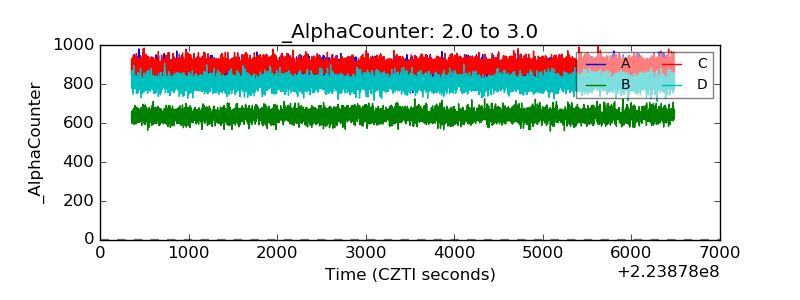 |
| _CPM_Rate | 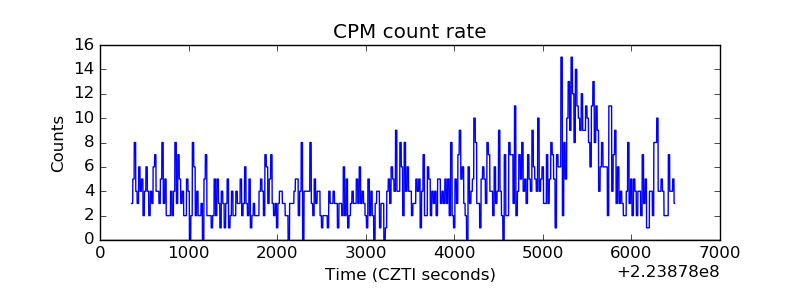 |
| CZT Counter | 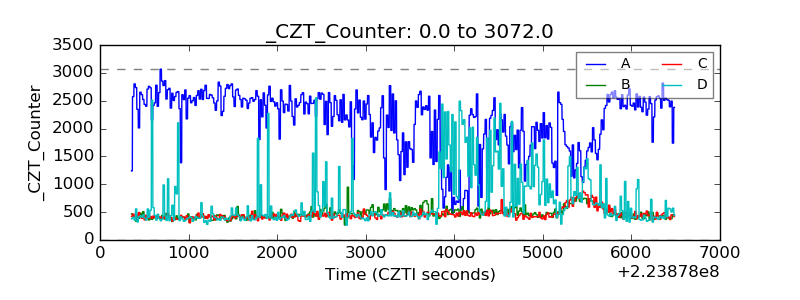 |
| +2.5 Volts monitor |  |
| +5 Volts monitor |  |
| _ROLL_ROT | 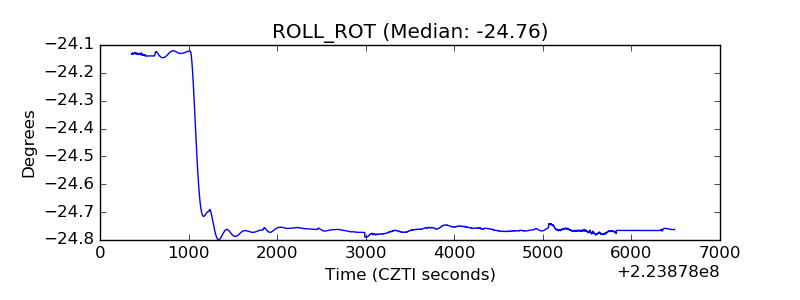 |
| _Roll_DEC | 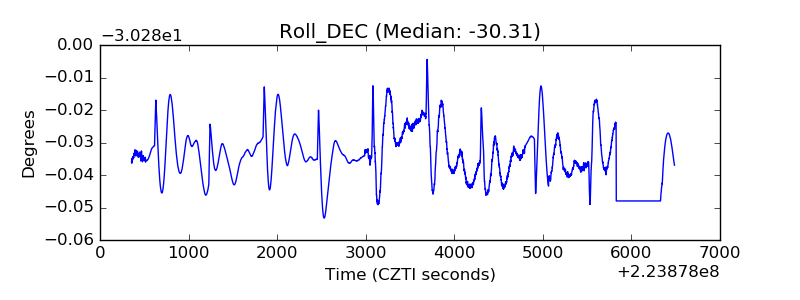 |
| _Roll_RA | 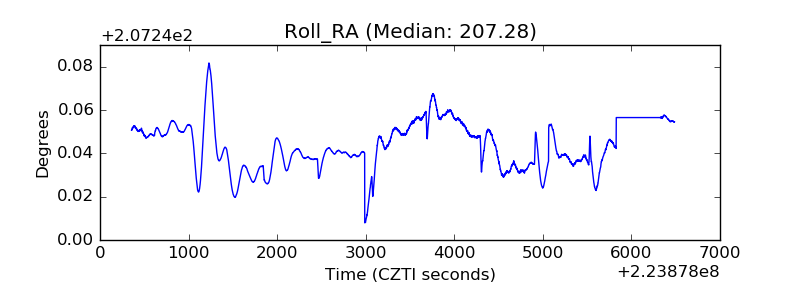 |
| Veto Counter | 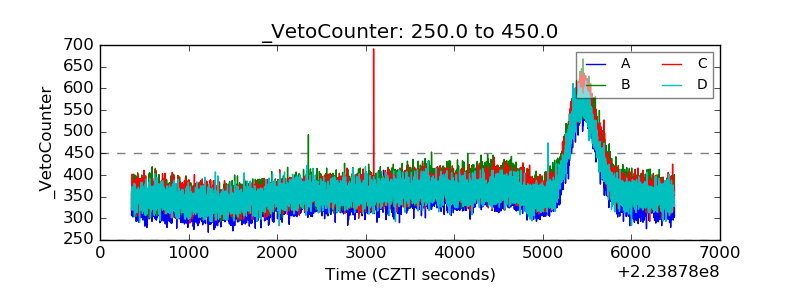 |