| Param | Original file | Final file |
|---|---|---|
| Filename | modeM0/AS1A02_178T01_9000001006_07335cztM0_level2.evt | modeM0/AS1A02_178T01_9000001006_07335cztM0_level2_quad_clean.evt |
| Size (bytes) | 2,944,532,160 | 393,773,760 |
| Size | 2.7 GB | 375.5 MB |
| Events in quadrant A | 24,857,875 | 2,280,620 |
| Events in quadrant B | 17,013,677 | 2,501,572 |
| Events in quadrant C | 25,733,747 | 2,407,566 |
| Events in quadrant D | 19,233,028 | 2,353,443 |
| Mode M0 | |||
|---|---|---|---|
| Quadrant | BADHDUFLAG | Total packets | Discarded packets |
| A | 0 | 97762 | 8 |
| B | 0 | 73729 | 7 |
| C | 0 | 100399 | 7 |
| D | 0 | 81311 | 7 |
| Mode SS | |||
|---|---|---|---|
| Quadrant | BADHDUFLAG | Total packets | Discarded packets |
| A | 0 | 706 | 0 |
| B | 0 | 706 | 0 |
| C | 0 | 706 | 0 |
| D | 0 | 706 | 0 |
| Mode M9 | |||
|---|---|---|---|
| Quadrant | BADHDUFLAG | Total packets | Discarded packets |
| A | 0 | 39 | 0 |
| B | 0 | 39 | 0 |
| C | 0 | 39 | 0 |
| D | 0 | 39 | 0 |
| Quadrant | Total seconds | Saturated seconds | Saturation percentage |
|---|---|---|---|
| A | 34662 | 3801 | 10.965899% |
| B | 34662 | 513 | 1.480007% |
| C | 34662 | 3887 | 11.214010% |
| D | 34662 | 887 | 2.558998% |
Noise dominated data is calculated using 1-second bins in cleaned event files. If a bin has >2000 counts, and if more than 50% of those come from <1% of pixels, then it is considered to be noise-dominated and hence unusable.
| Quadrant | # 1 sec bins | Bins with >0 counts | Bins with >2000 counts | High rate bins dominated by noise | Noise dominated (total time) | Noise dominated (detector-on time) | Marked lightcurve |
|---|---|---|---|---|---|---|---|
| A | 38602 | 34663 | 2699 | 2699 | 6.99% | 7.79% | 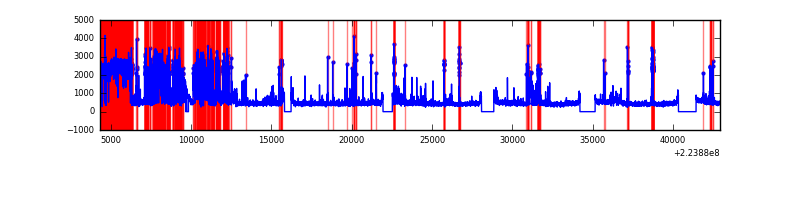 |
| B | 38602 | 34664 | 15 | 15 | 0.04% | 0.04% | 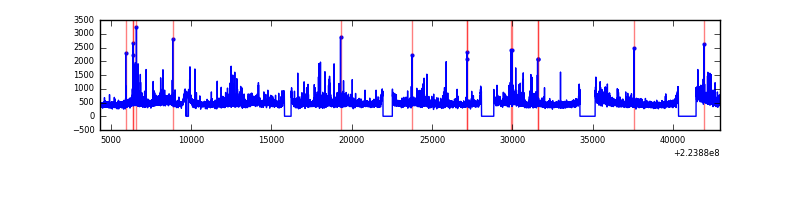 |
| C | 38602 | 34664 | 3031 | 3031 | 7.85% | 8.74% |  |
| D | 38602 | 34663 | 388 | 388 | 1.01% | 1.12% | 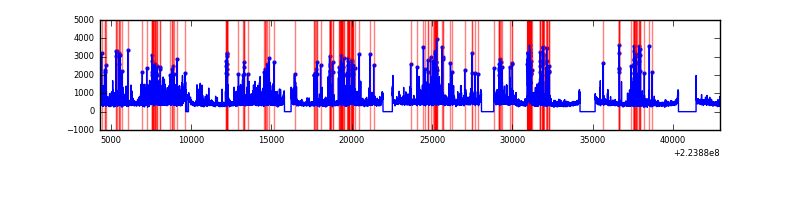 |
Top three noisy pixels from each quadrant. If the there are fewer than three noisy pixels in the level2.evt file, extra rows are filled as -1
| Pixel properties | Quadrant properties | ||||||
|---|---|---|---|---|---|---|---|
| Quadrant | DetID | PixID | Counts | Sigma | Mean | Median | Sigma |
| A | 15 | 234 | 9952449 | 12952.75 | 3800 | 3713 | 768.1 |
| A | 14 | 111 | 213277 | 272.84 | 3800 | 3713 | 768.1 |
| A | 13 | 248 | 50114 | 60.41 | 3800 | 3713 | 768.1 |
| B | 0 | 214 | 542286 | 703.4 | 4050 | 3950 | 765.3 |
| B | 11 | 51 | 425010 | 550.17 | 4050 | 3950 | 765.3 |
| B | 4 | 81 | 151538 | 192.84 | 4050 | 3950 | 765.3 |
| C | 9 | 68 | 10869962 | 12466.61 | 3773 | 3791 | 871.6 |
| C | 1 | 16 | 57563 | 61.69 | 3773 | 3791 | 871.6 |
| C | 10 | 22 | 49677 | 52.64 | 3773 | 3791 | 871.6 |
| D | 2 | 216 | 2795563 | 2941.1 | 3903 | 3784 | 949.2 |
| D | 14 | 34 | 619881 | 649.05 | 3903 | 3784 | 949.2 |
| D | 12 | 221 | 457099 | 477.56 | 3903 | 3784 | 949.2 |
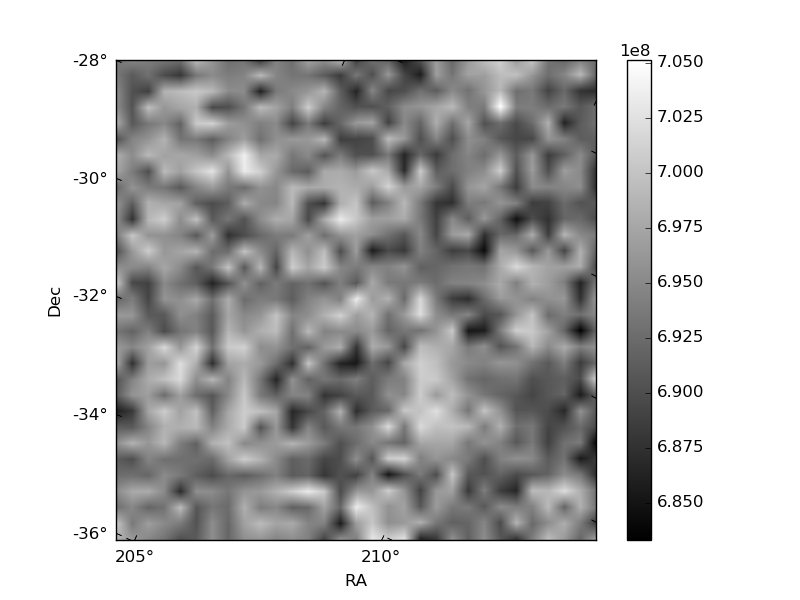
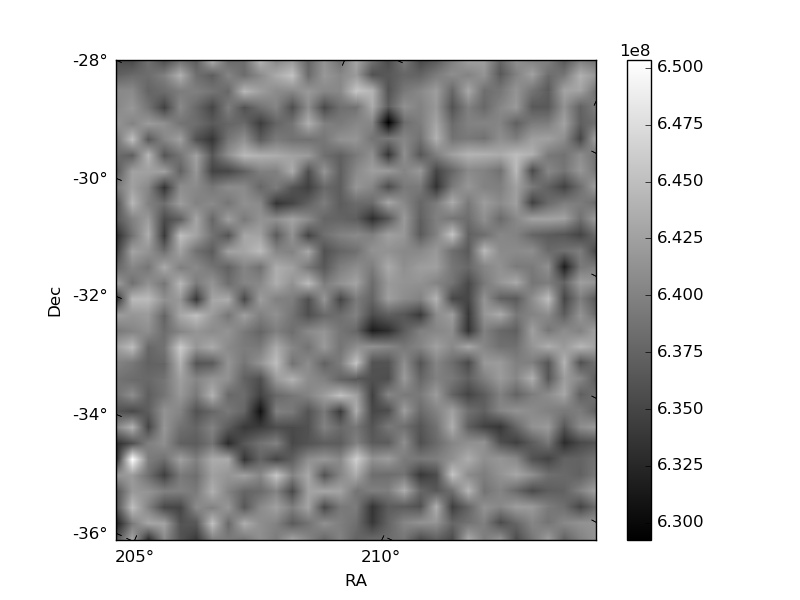
Histogram calculated using DETX and DETY for each event in the final _common_clean file
| Quadrant A | 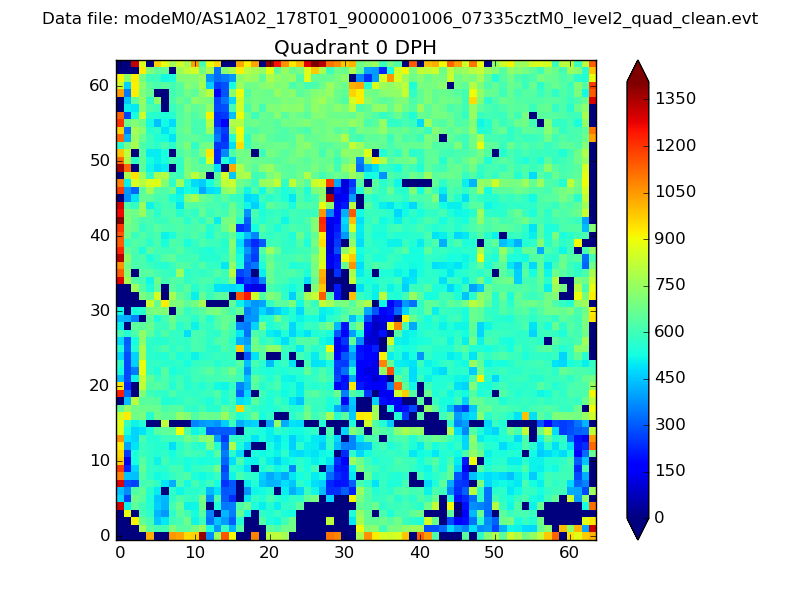 |
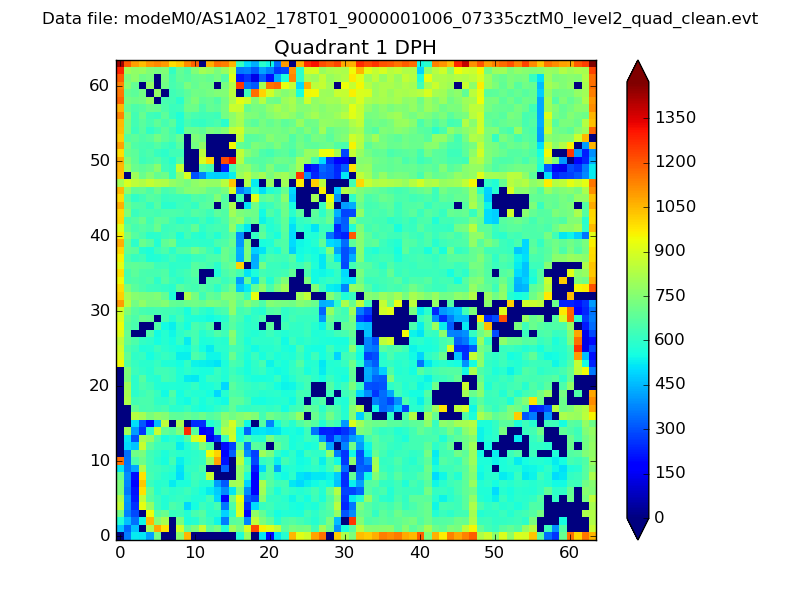 |
Quadrant B |
|---|---|---|---|
| Quadrant D | 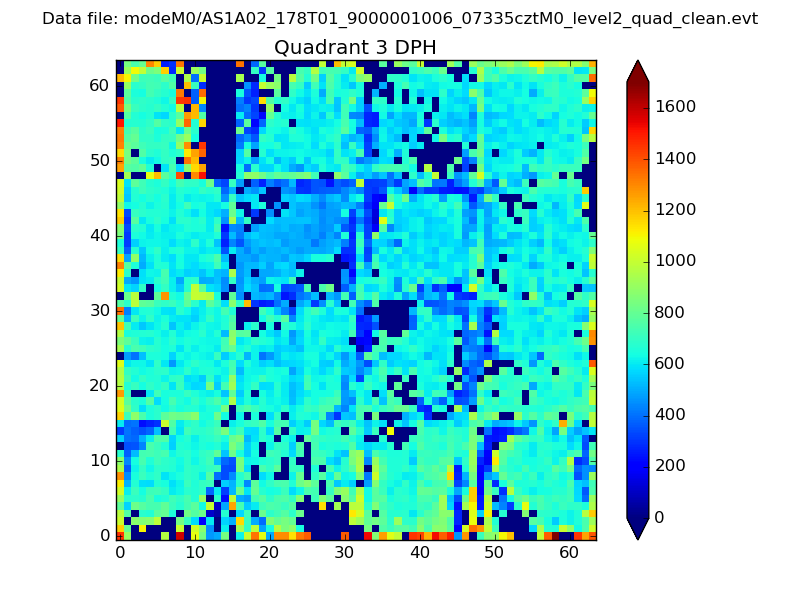 |
 |
Quadrant C |
| Plot type | Count rate plots | Images |
|---|---|---|
| Comparison with Poisson distribution Blue bars denote a histogram of data divided into 1 sec bins. Red curve is a Poisson curve with rate = median count rate of data. |
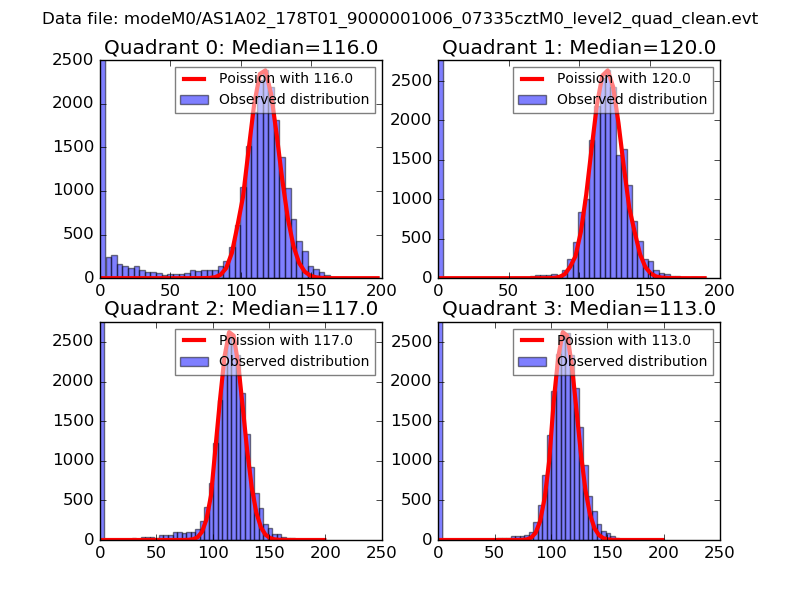 |
 |
| Quadrant-wise count rates Data is divided into 100 sec bins |
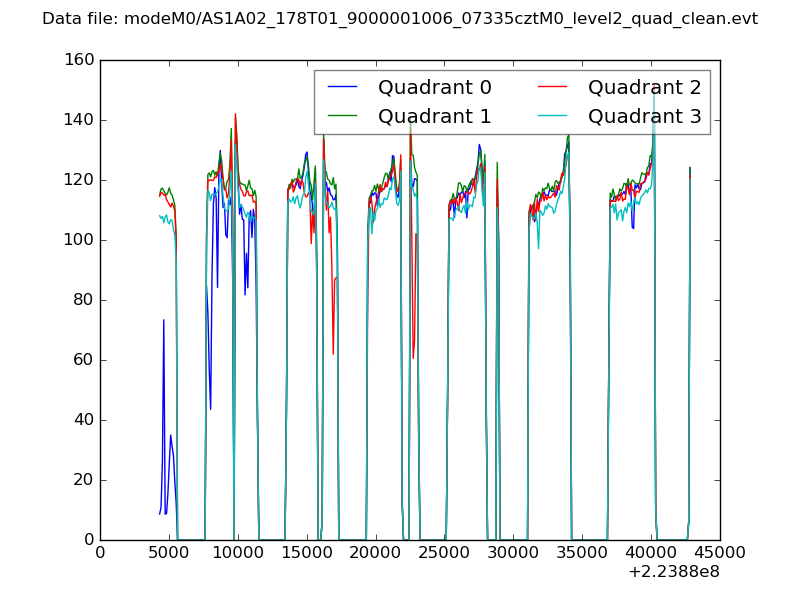 |
|
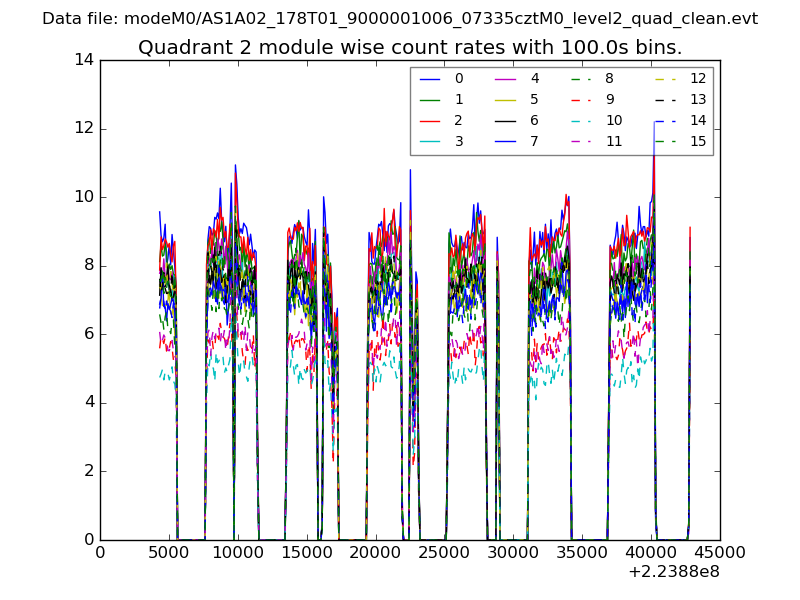
| Module-wise count rates for Quadrant A Data is divided into 100 sec bins |
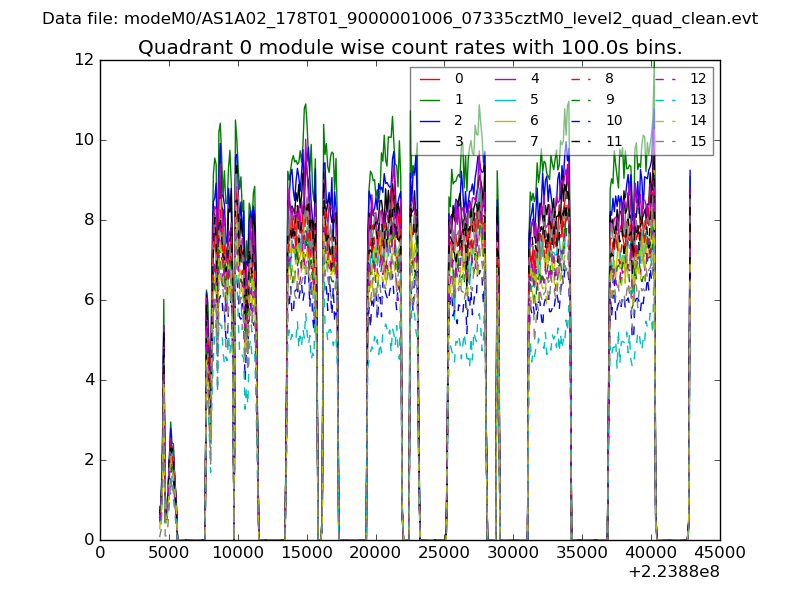 |
 |
| Module-wise count rates for Quadrant B Data is divided into 100 sec bins |
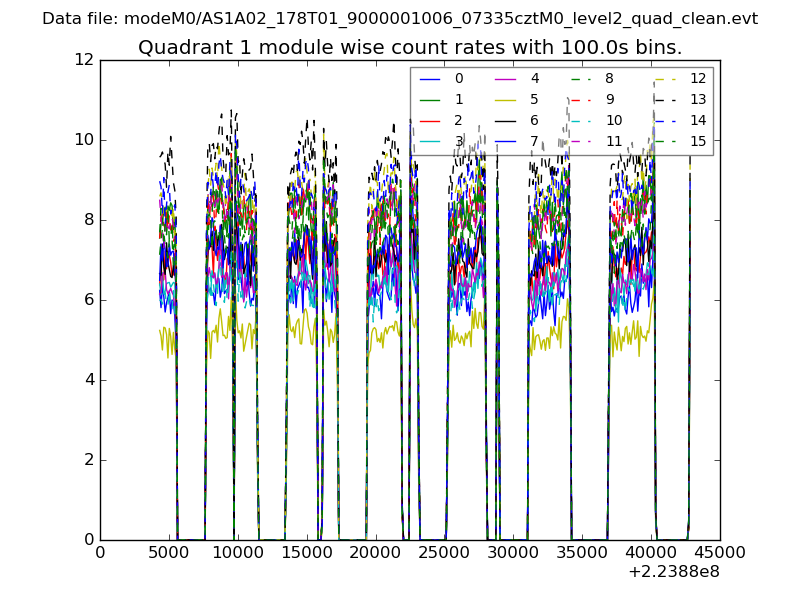 |
 |
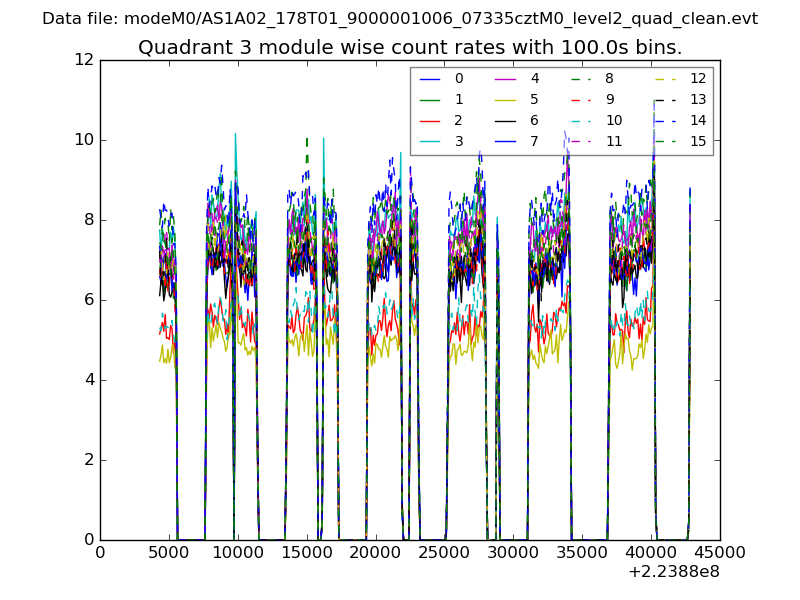
| Module-wise count rates for Quadrant C Data is divided into 100 sec bins |
 |
 |
| Module-wise count rates for Quadrant D Data is divided into 100 sec bins |
 |
 |
| Parameter | Plot |
|---|---|
| CZT HV Monitor | 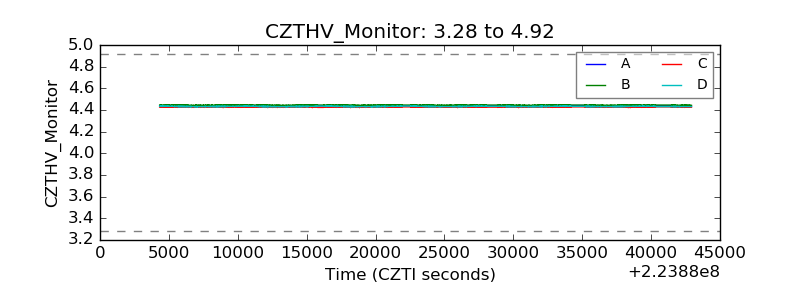 |
| D_VDD | 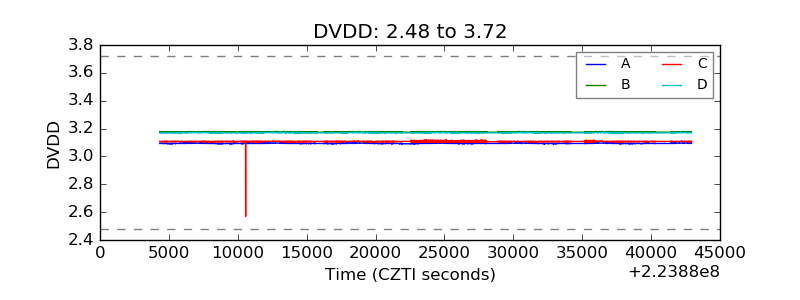 |
| Temperature 1 | 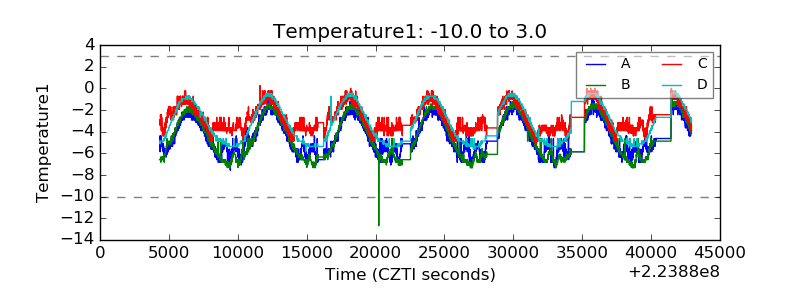 |
| Veto HV Monitor | 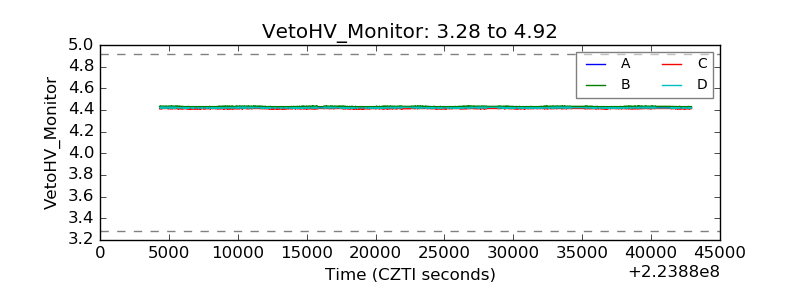 |
| Veto LLD | 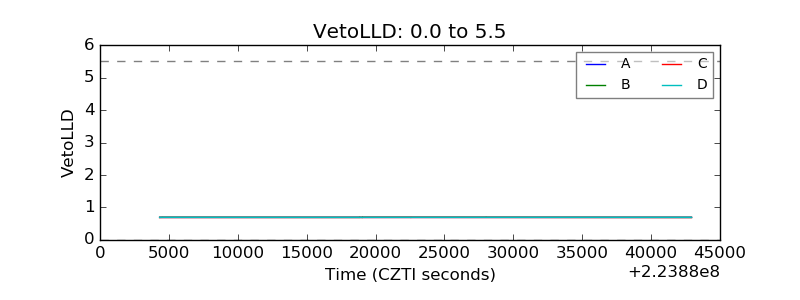 |
| Alpha Counter | 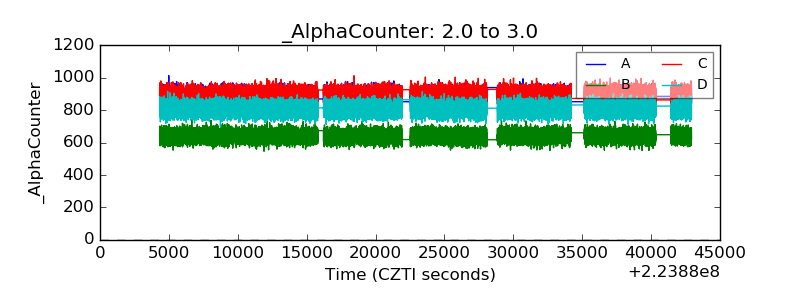 |
| _CPM_Rate | 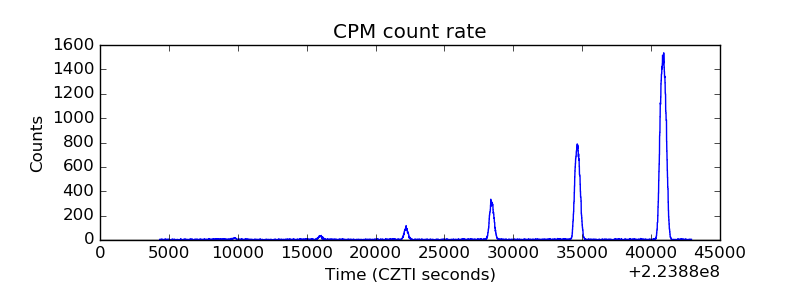 |
| CZT Counter | 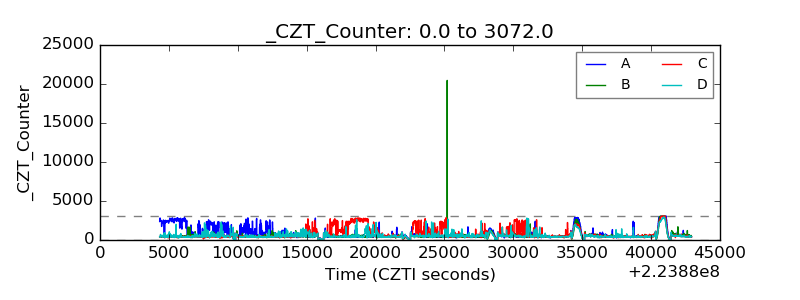 |
| +2.5 Volts monitor | 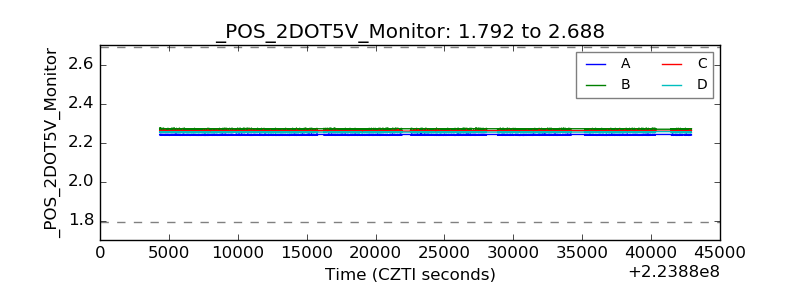 |
| +5 Volts monitor |  |
| _ROLL_ROT | 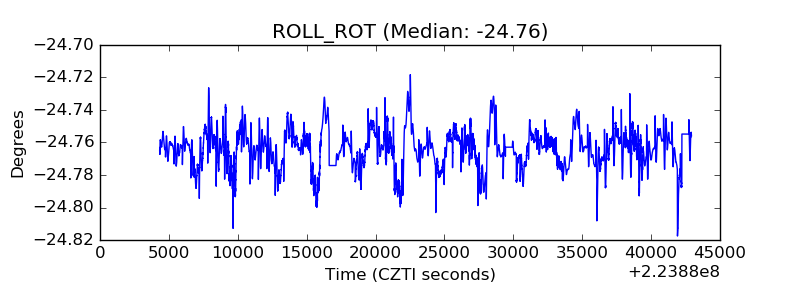 |
| _Roll_DEC | 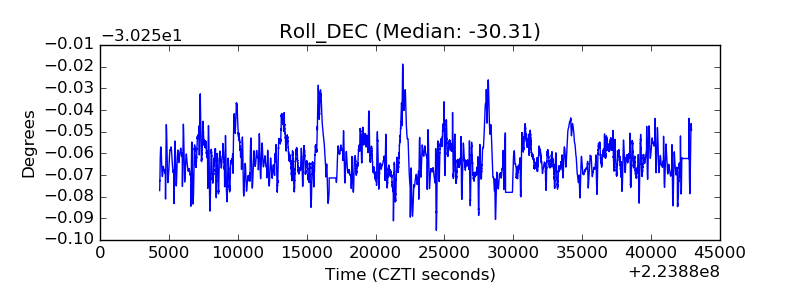 |
| _Roll_RA | 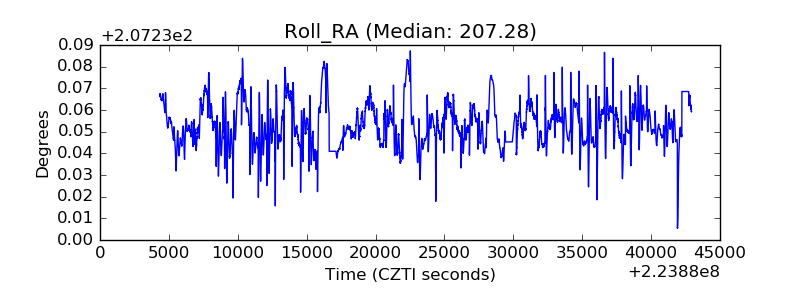 |
| Veto Counter | 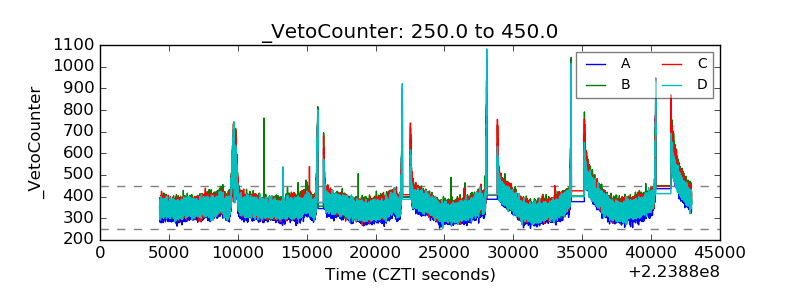 |