| Param | Original file | Final file |
|---|---|---|
| Filename | modeM0/AS1A02_178T01_9000001006_07336cztM0_level2.evt | modeM0/AS1A02_178T01_9000001006_07336cztM0_level2_quad_clean.evt |
| Size (bytes) | 413,184,960 | 79,081,920 |
| Size | 394.0 MB | 75.4 MB |
| Events in quadrant A | 2,981,721 | 501,055 |
| Events in quadrant B | 2,947,920 | 510,830 |
| Events in quadrant C | 2,919,596 | 495,747 |
| Events in quadrant D | 3,266,039 | 478,060 |
| Mode M0 | |||
|---|---|---|---|
| Quadrant | BADHDUFLAG | Total packets | Discarded packets |
| A | 0 | 12805 | 2 |
| B | 0 | 12649 | 1 |
| C | 0 | 12563 | 1 |
| D | 0 | 13880 | 1 |
| Mode SS | |||
|---|---|---|---|
| Quadrant | BADHDUFLAG | Total packets | Discarded packets |
| A | 0 | 118 | 0 |
| B | 0 | 118 | 0 |
| C | 0 | 118 | 0 |
| D | 0 | 118 | 0 |
| Mode M9 | |||
|---|---|---|---|
| Quadrant | BADHDUFLAG | Total packets | Discarded packets |
| A | 0 | 13 | 0 |
| B | 0 | 13 | 0 |
| C | 0 | 13 | 0 |
| D | 0 | 13 | 0 |
| Quadrant | Total seconds | Saturated seconds | Saturation percentage |
|---|---|---|---|
| A | 5856 | 94 | 1.605191% |
| B | 5856 | 69 | 1.178279% |
| C | 5856 | 69 | 1.178279% |
| D | 5856 | 164 | 2.800546% |
Noise dominated data is calculated using 1-second bins in cleaned event files. If a bin has >2000 counts, and if more than 50% of those come from <1% of pixels, then it is considered to be noise-dominated and hence unusable.
| Quadrant | # 1 sec bins | Bins with >0 counts | Bins with >2000 counts | High rate bins dominated by noise | Noise dominated (total time) | Noise dominated (detector-on time) | Marked lightcurve |
|---|---|---|---|---|---|---|---|
| A | 7071 | 5856 | 22 | 22 | 0.31% | 0.38% | 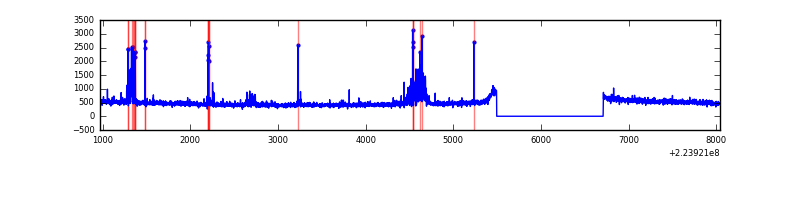 |
| B | 7071 | 5856 | 8 | 8 | 0.11% | 0.14% | 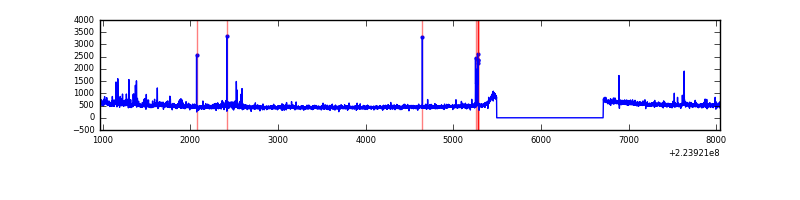 |
| C | 7071 | 5856 | 25 | 25 | 0.35% | 0.43% | 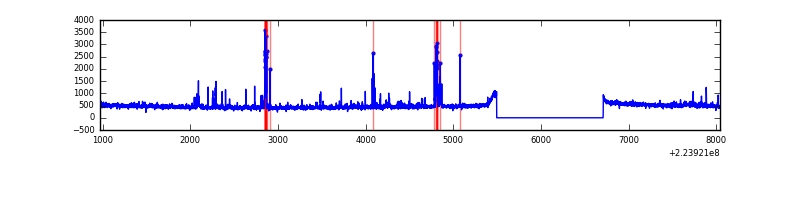 |
| D | 7071 | 5856 | 92 | 92 | 1.30% | 1.57% | 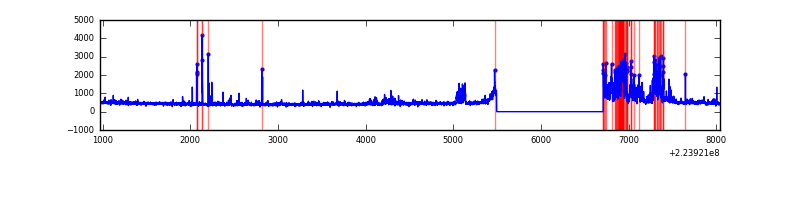 |
Top three noisy pixels from each quadrant. If the there are fewer than three noisy pixels in the level2.evt file, extra rows are filled as -1
| Pixel properties | Quadrant properties | ||||||
|---|---|---|---|---|---|---|---|
| Quadrant | DetID | PixID | Counts | Sigma | Mean | Median | Sigma |
| A | 15 | 234 | 175140 | 1204.49 | 710 | 696 | 144.8 |
| A | 14 | 111 | 56565 | 385.76 | 710 | 696 | 144.8 |
| A | 13 | 248 | 12835 | 83.82 | 710 | 696 | 144.8 |
| B | 0 | 214 | 50487 | 368.12 | 720 | 704 | 135.2 |
| B | 11 | 51 | 40339 | 293.08 | 720 | 704 | 135.2 |
| B | 0 | 245 | 23584 | 169.19 | 720 | 704 | 135.2 |
| C | 1 | 16 | 163881 | 1026.66 | 687 | 693 | 159.0 |
| C | 9 | 68 | 63940 | 397.9 | 687 | 693 | 159.0 |
| C | 13 | 61 | 5281 | 28.86 | 687 | 693 | 159.0 |
| D | 12 | 221 | 595448 | 3631.47 | 676 | 656 | 163.8 |
| D | 14 | 34 | 37382 | 224.23 | 676 | 656 | 163.8 |
| D | 2 | 14 | 36418 | 218.34 | 676 | 656 | 163.8 |
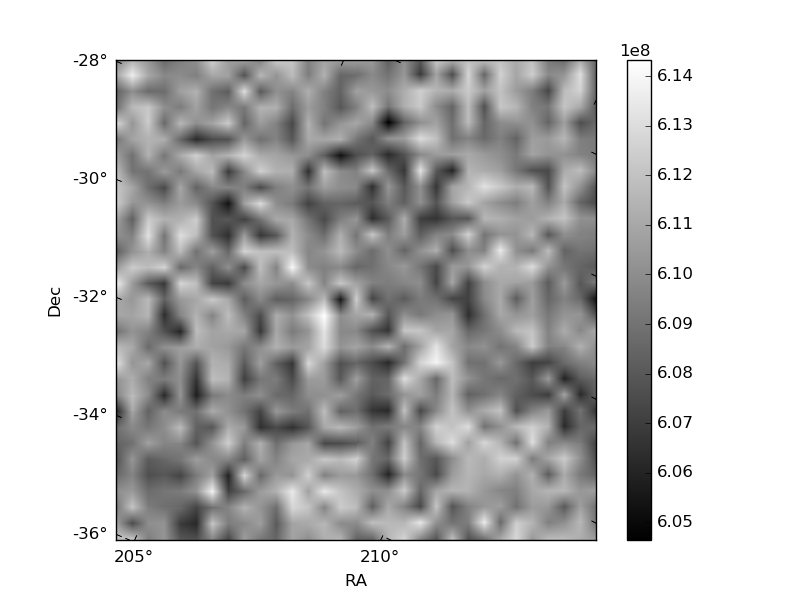
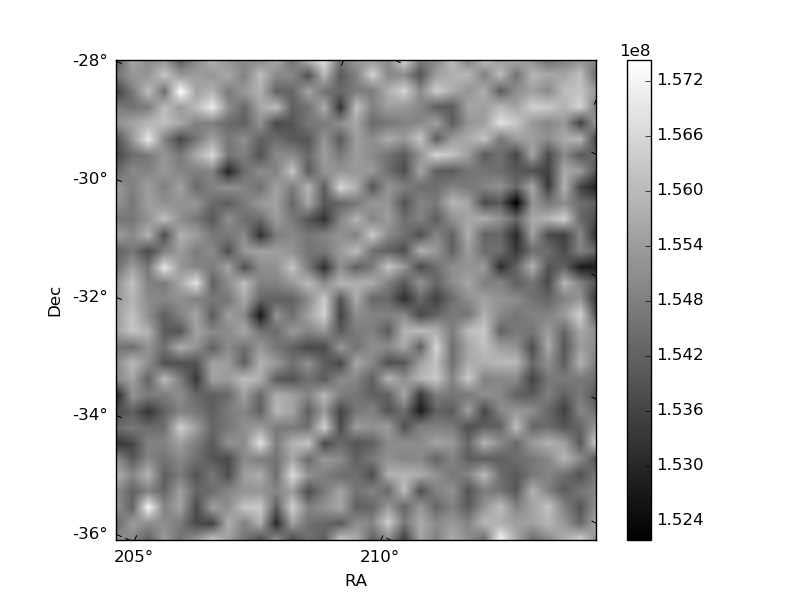
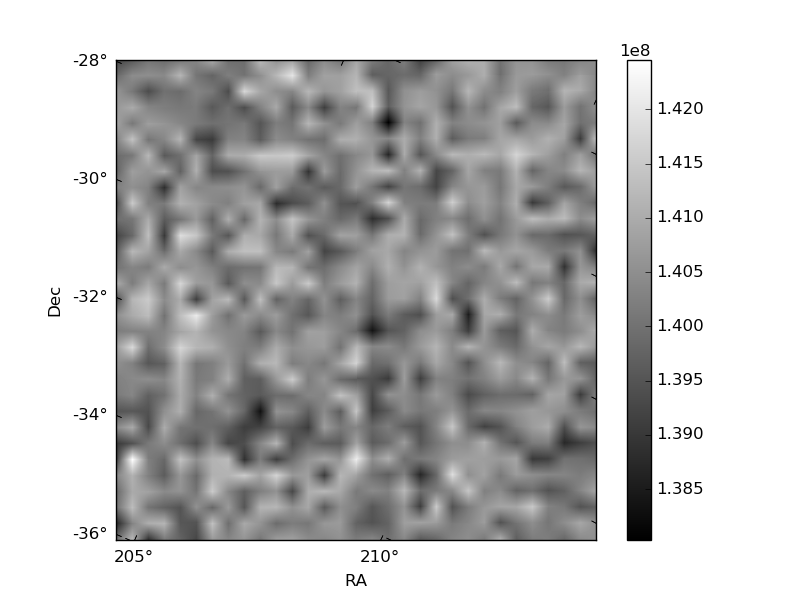
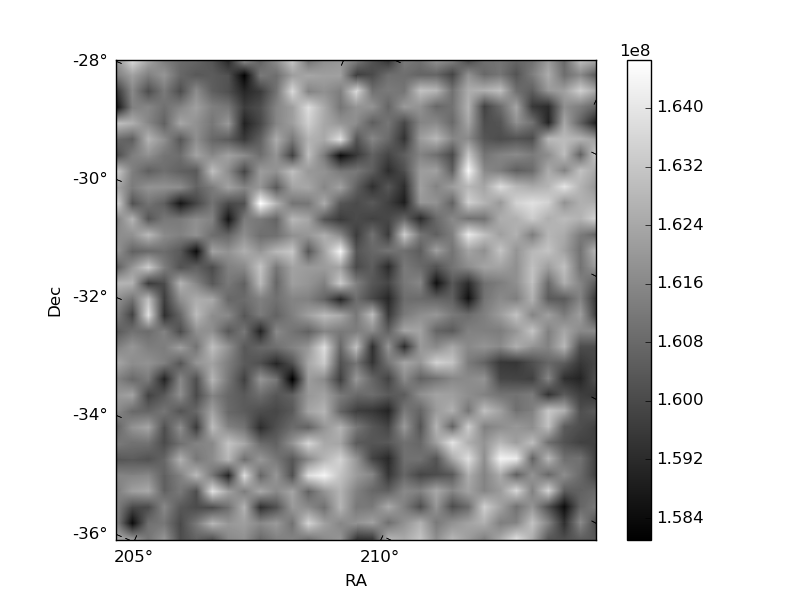
Histogram calculated using DETX and DETY for each event in the final _common_clean file
| Quadrant A | 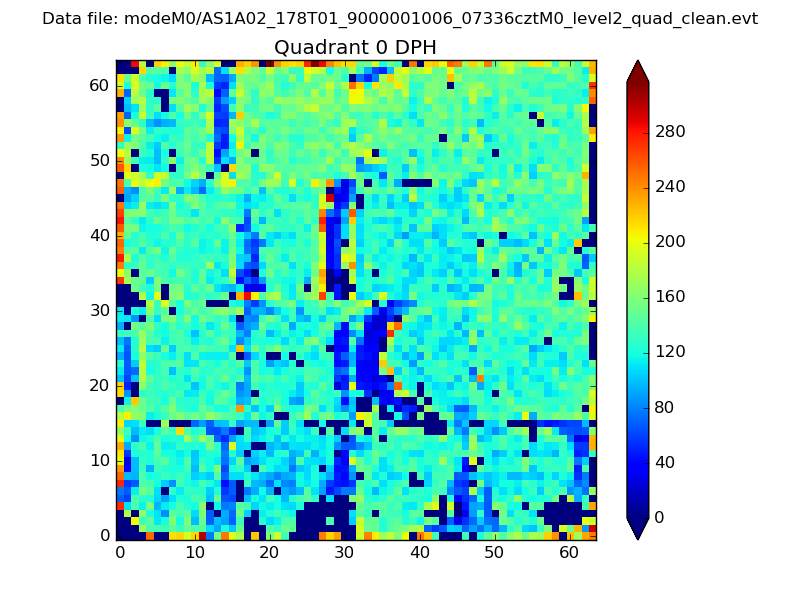 |
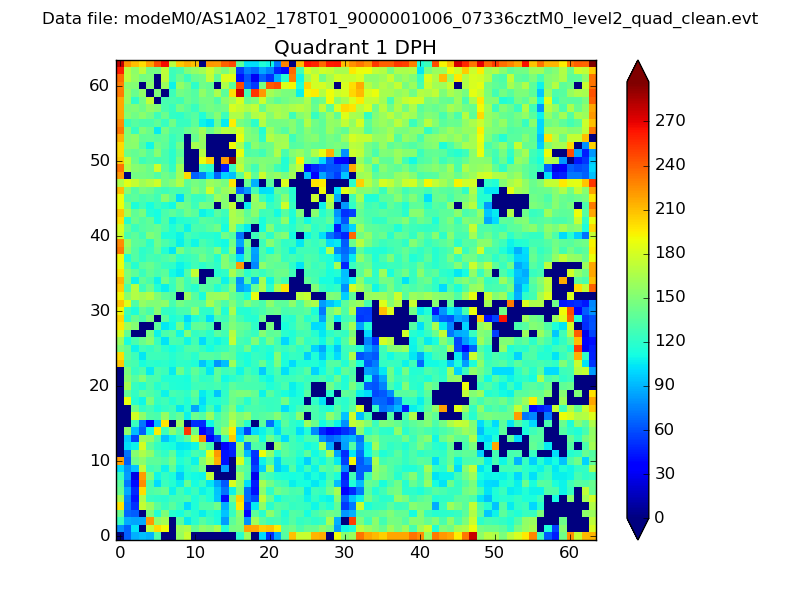 |
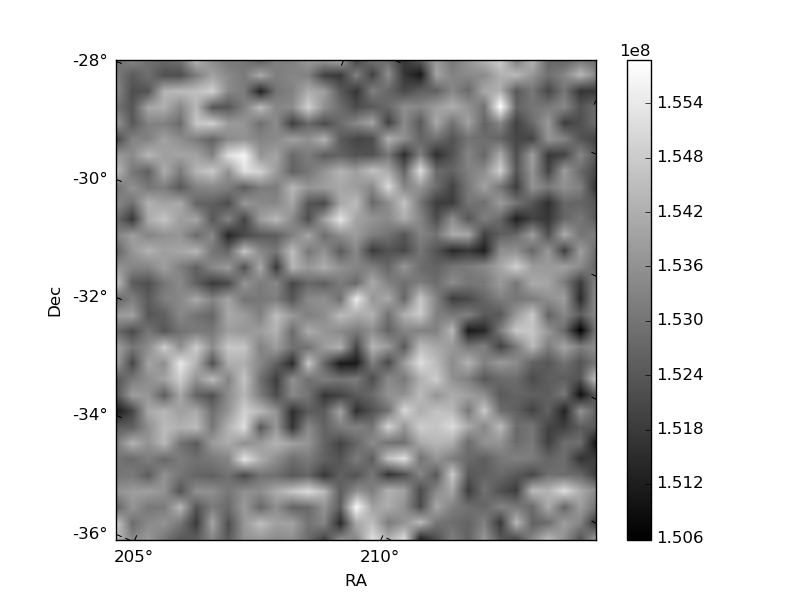
Quadrant B |
|---|---|---|---|
| Quadrant D | 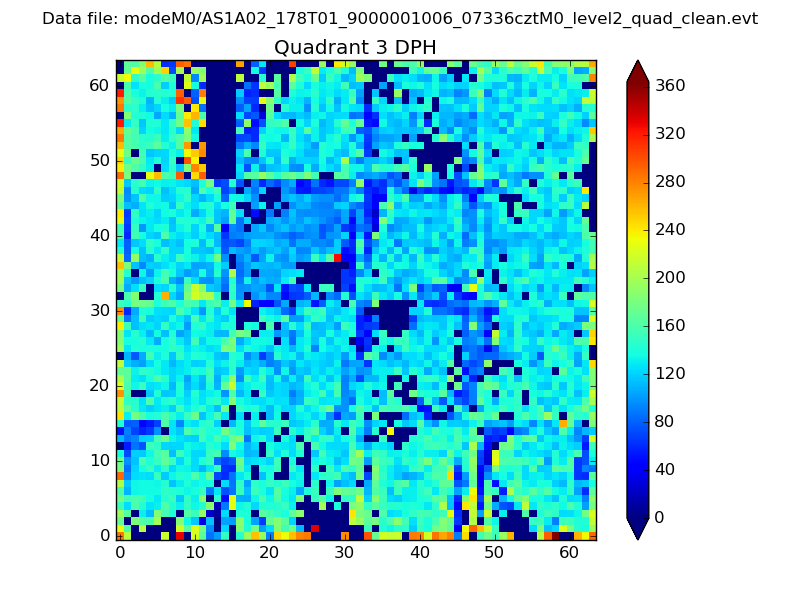 |
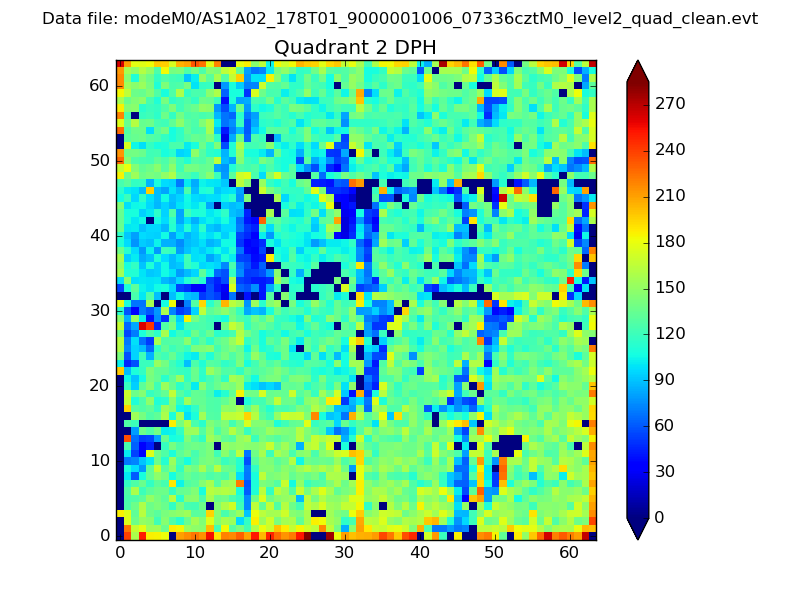 |
Quadrant C |
| Plot type | Count rate plots | Images |
|---|---|---|
| Comparison with Poisson distribution Blue bars denote a histogram of data divided into 1 sec bins. Red curve is a Poisson curve with rate = median count rate of data. |
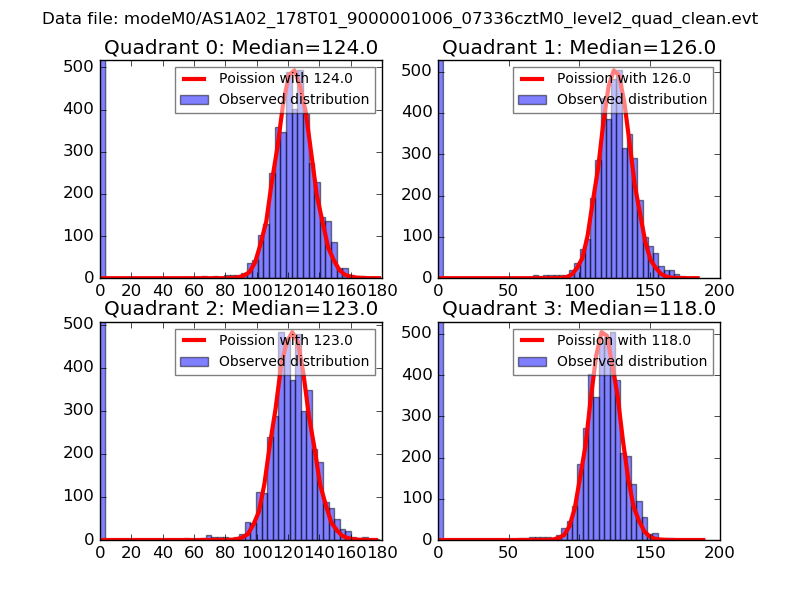 |
 |
| Quadrant-wise count rates Data is divided into 100 sec bins |
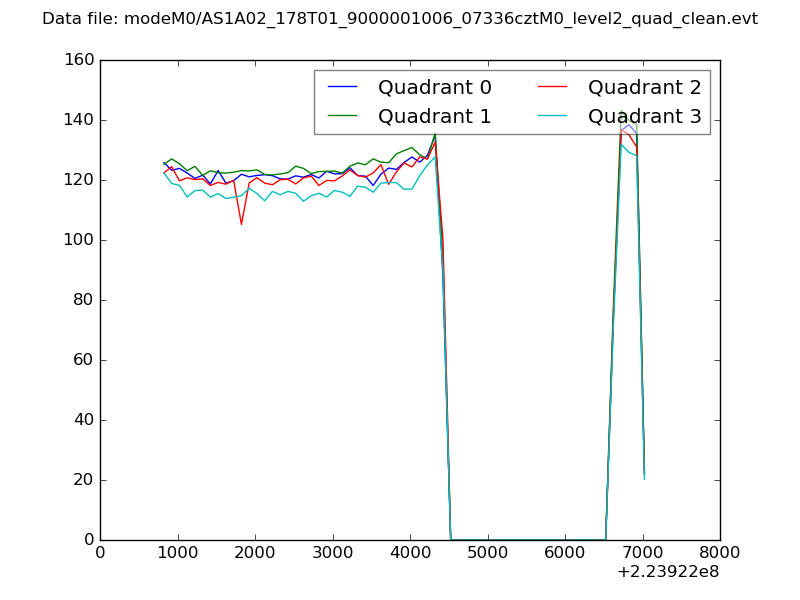 |
|
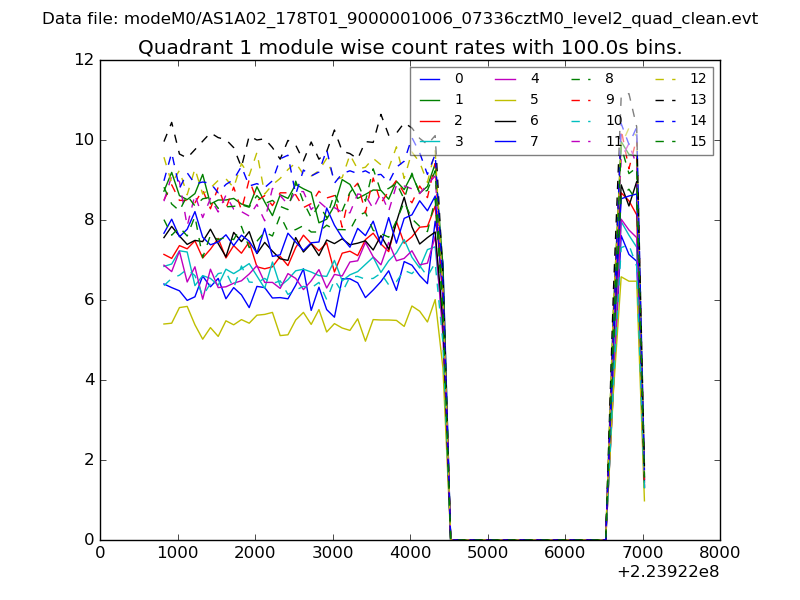
| Module-wise count rates for Quadrant A Data is divided into 100 sec bins |
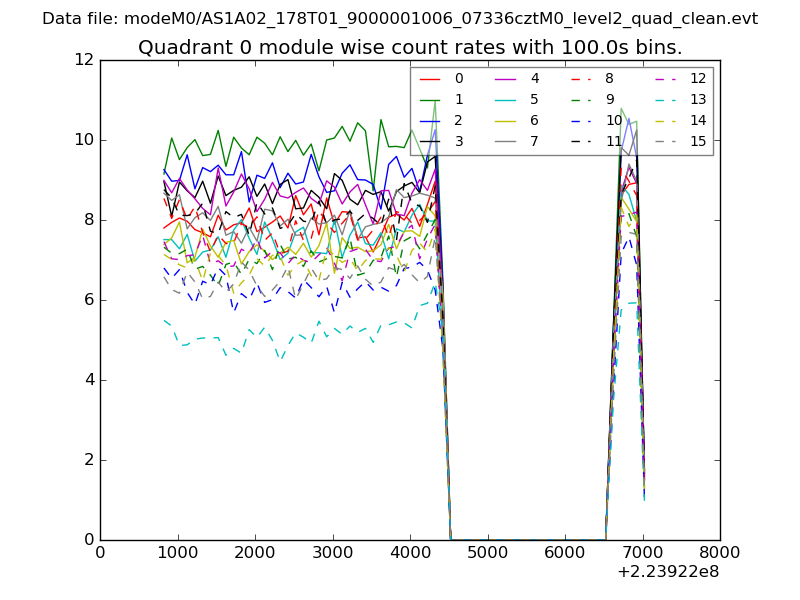 |
 |
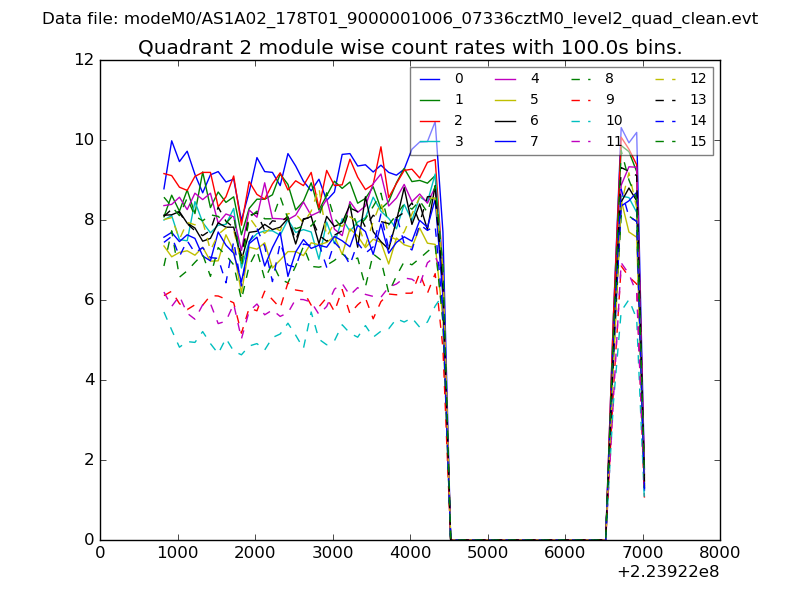
| Module-wise count rates for Quadrant B Data is divided into 100 sec bins |
 |
 |
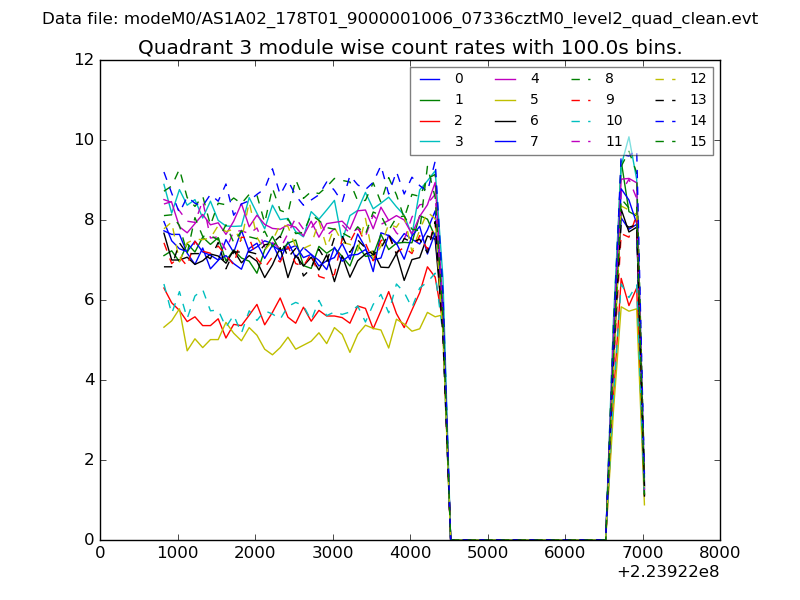
| Module-wise count rates for Quadrant C Data is divided into 100 sec bins |
 |
 |
| Module-wise count rates for Quadrant D Data is divided into 100 sec bins |
 |
 |
| Parameter | Plot |
|---|---|
| CZT HV Monitor | 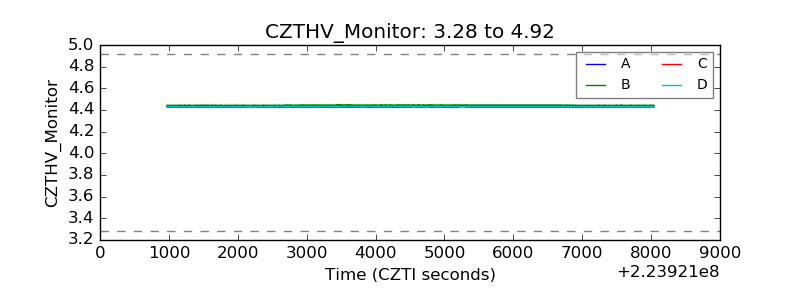 |
| D_VDD | 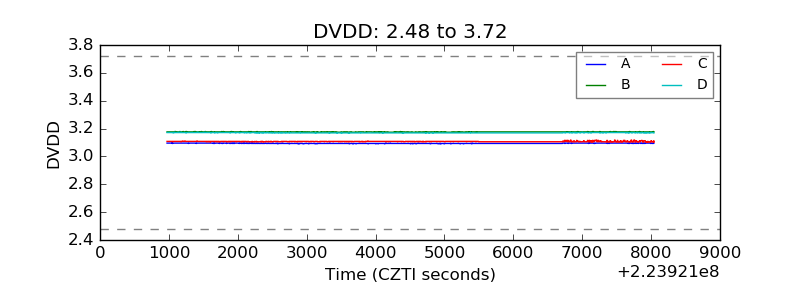 |
| Temperature 1 | 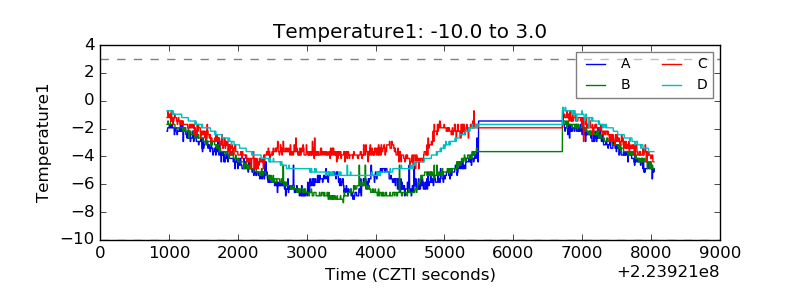 |
| Veto HV Monitor | 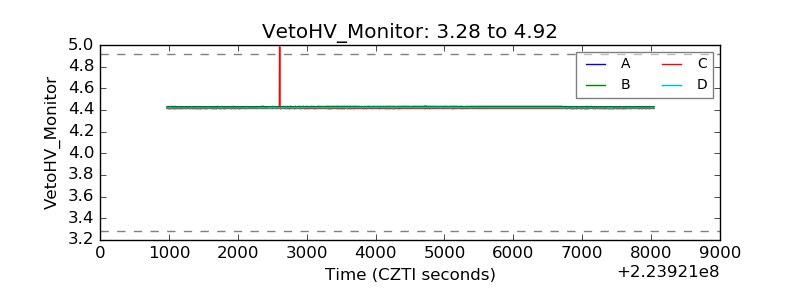 |
| Veto LLD | 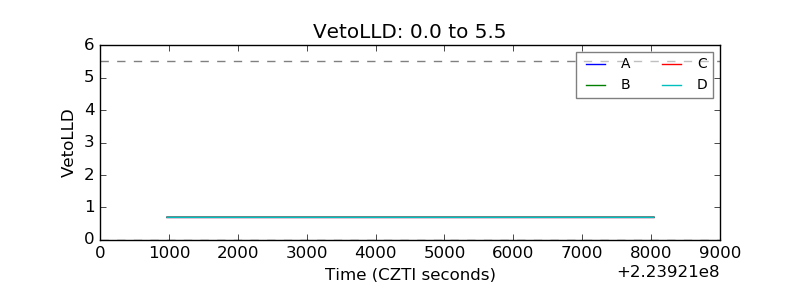 |
| Alpha Counter | 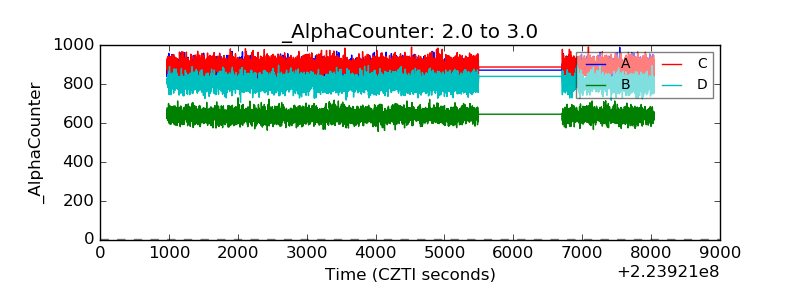 |
| _CPM_Rate | 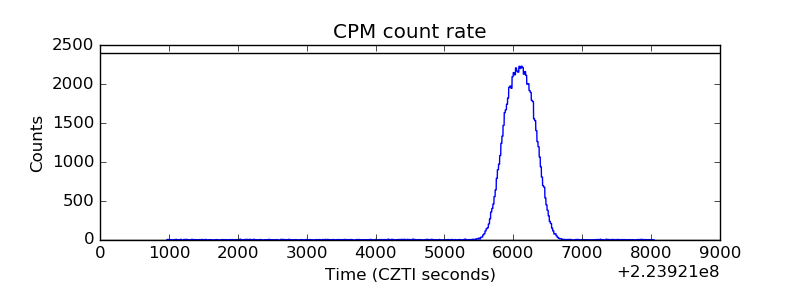 |
| CZT Counter | 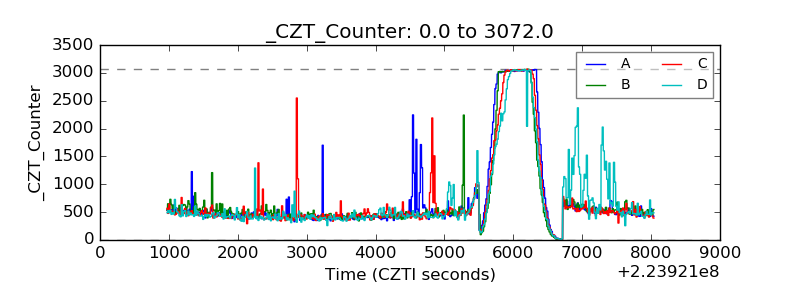 |
| +2.5 Volts monitor |  |
| +5 Volts monitor |  |
| _ROLL_ROT | 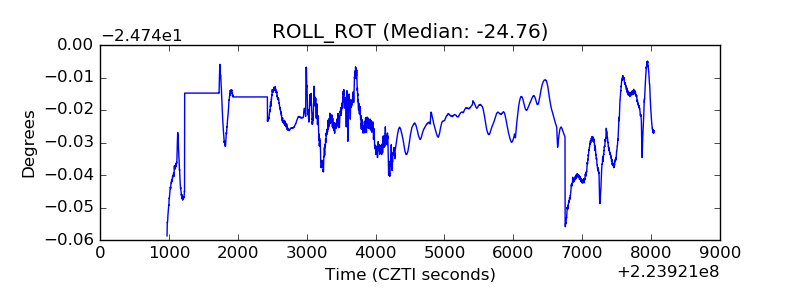 |
| _Roll_DEC | 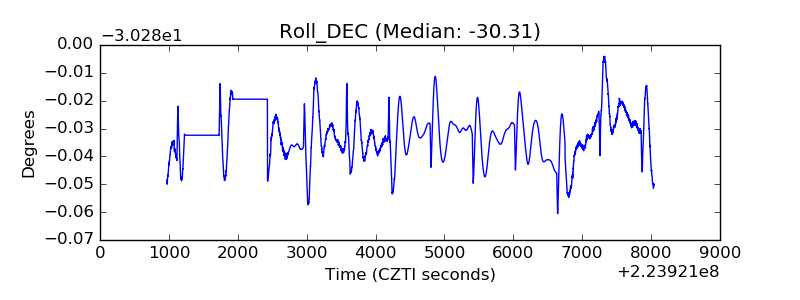 |
| _Roll_RA | 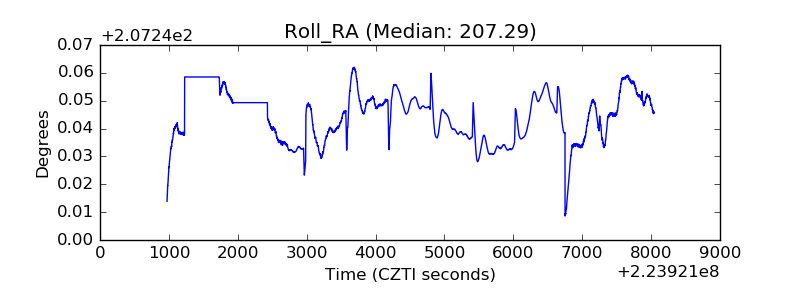 |
| Veto Counter | 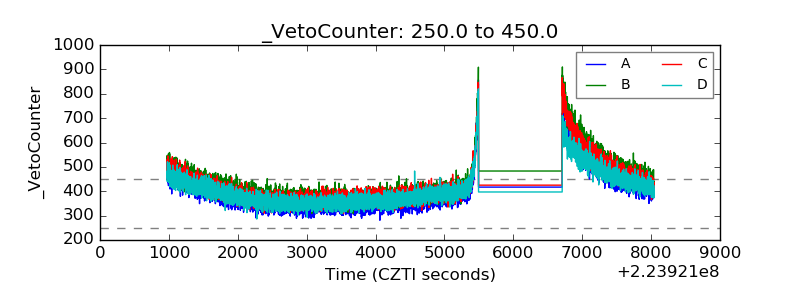 |