| Param | Original file | Final file |
|---|---|---|
| Filename | modeM0/AS1A02_178T01_9000001006_07337cztM0_level2.evt | modeM0/AS1A02_178T01_9000001006_07337cztM0_level2_quad_clean.evt |
| Size (bytes) | 191,468,160 | 29,021,760 |
| Size | 182.6 MB | 27.7 MB |
| Events in quadrant A | 1,220,680 | 179,805 |
| Events in quadrant B | 1,257,397 | 184,106 |
| Events in quadrant C | 1,186,954 | 177,665 |
| Events in quadrant D | 1,972,706 | 168,177 |
| Mode M0 | |||
|---|---|---|---|
| Quadrant | BADHDUFLAG | Total packets | Discarded packets |
| A | 0 | 5155 | 1 |
| B | 0 | 5233 | 1 |
| C | 0 | 5060 | 1 |
| D | 0 | 7434 | 1 |
| Mode SS | |||
|---|---|---|---|
| Quadrant | BADHDUFLAG | Total packets | Discarded packets |
| A | 0 | 48 | 0 |
| B | 0 | 48 | 0 |
| C | 0 | 48 | 0 |
| D | 0 | 48 | 0 |
| Mode M9 | |||
|---|---|---|---|
| Quadrant | BADHDUFLAG | Total packets | Discarded packets |
| A | 0 | 13 | 0 |
| B | 0 | 13 | 0 |
| C | 0 | 13 | 0 |
| D | 0 | 13 | 0 |
| Quadrant | Total seconds | Saturated seconds | Saturation percentage |
|---|---|---|---|
| A | 2341 | 61 | 2.605724% |
| B | 2341 | 56 | 2.392140% |
| C | 2341 | 38 | 1.623238% |
| D | 2341 | 178 | 7.603588% |
Noise dominated data is calculated using 1-second bins in cleaned event files. If a bin has >2000 counts, and if more than 50% of those come from <1% of pixels, then it is considered to be noise-dominated and hence unusable.
| Quadrant | # 1 sec bins | Bins with >0 counts | Bins with >2000 counts | High rate bins dominated by noise | Noise dominated (total time) | Noise dominated (detector-on time) | Marked lightcurve |
|---|---|---|---|---|---|---|---|
| A | 3556 | 2341 | 4 | 4 | 0.11% | 0.17% | 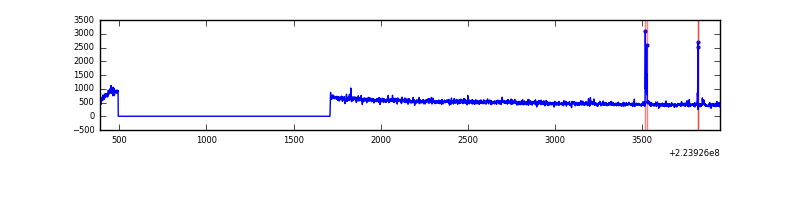 |
| B | 3556 | 2341 | 0 | 0 | 0.00% | 0.00% | 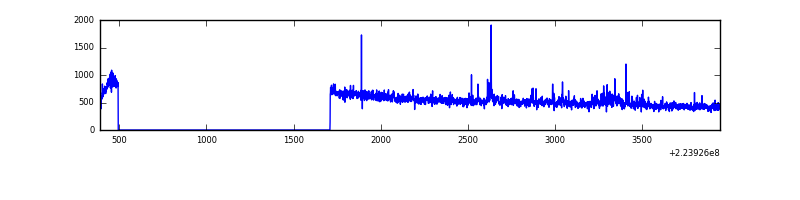 |
| C | 3556 | 2341 | 0 | 0 | 0.00% | 0.00% | 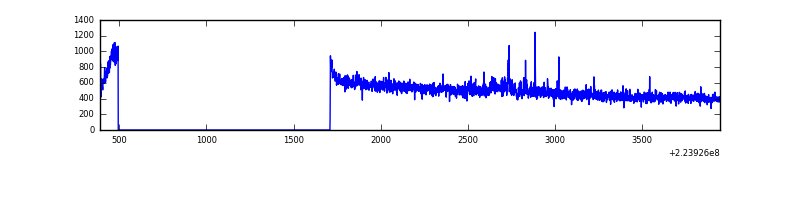 |
| D | 3556 | 2341 | 106 | 106 | 2.98% | 4.53% | 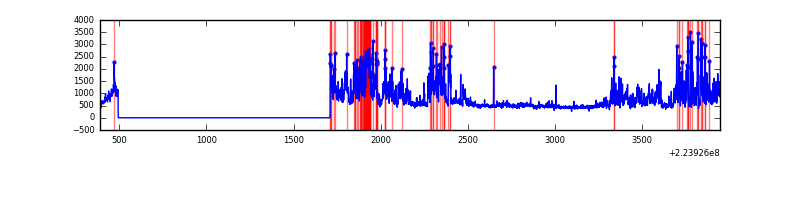 |
Top three noisy pixels from each quadrant. If the there are fewer than three noisy pixels in the level2.evt file, extra rows are filled as -1
| Pixel properties | Quadrant properties | ||||||
|---|---|---|---|---|---|---|---|
| Quadrant | DetID | PixID | Counts | Sigma | Mean | Median | Sigma |
| A | 15 | 239 | 15157 | 231.13 | 309 | 303 | 64.3 |
| A | 15 | 234 | 11988 | 181.82 | 309 | 303 | 64.3 |
| A | 0 | 23 | 5146 | 75.36 | 309 | 303 | 64.3 |
| B | 0 | 214 | 25536 | 418.42 | 312 | 306 | 60.3 |
| B | 4 | 173 | 9195 | 147.42 | 312 | 306 | 60.3 |
| B | 0 | 230 | 7161 | 113.68 | 312 | 306 | 60.3 |
| C | 9 | 68 | 22805 | 321.15 | 294 | 295 | 70.1 |
| C | 8 | 128 | 6225 | 84.6 | 294 | 295 | 70.1 |
| C | 1 | 16 | 3509 | 45.85 | 294 | 295 | 70.1 |
| D | 12 | 221 | 841851 | 11769.2 | 286 | 277 | 71.5 |
| D | 14 | 34 | 15562 | 213.76 | 286 | 277 | 71.5 |
| D | 2 | 14 | 13922 | 190.82 | 286 | 277 | 71.5 |
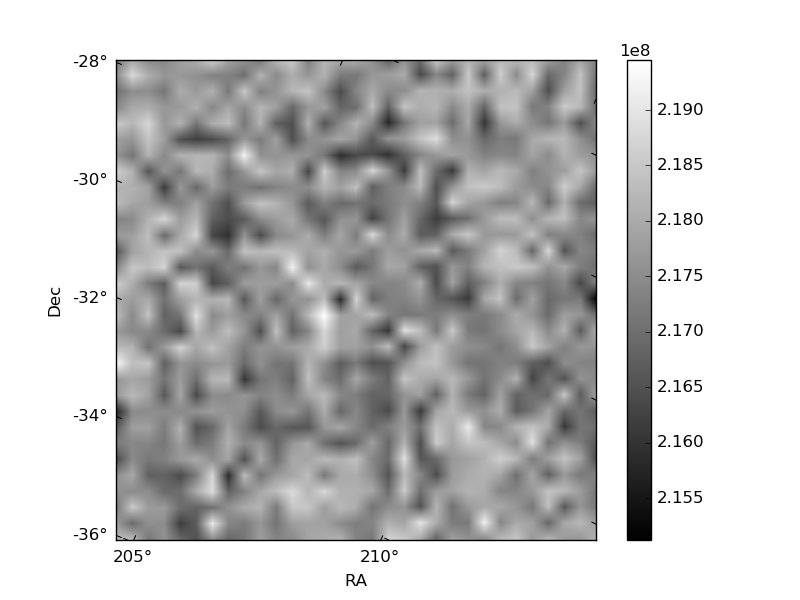
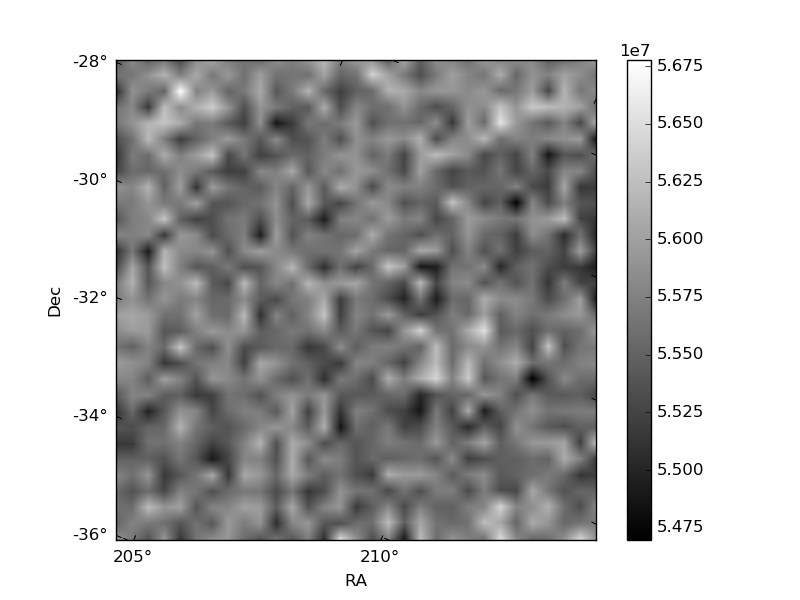
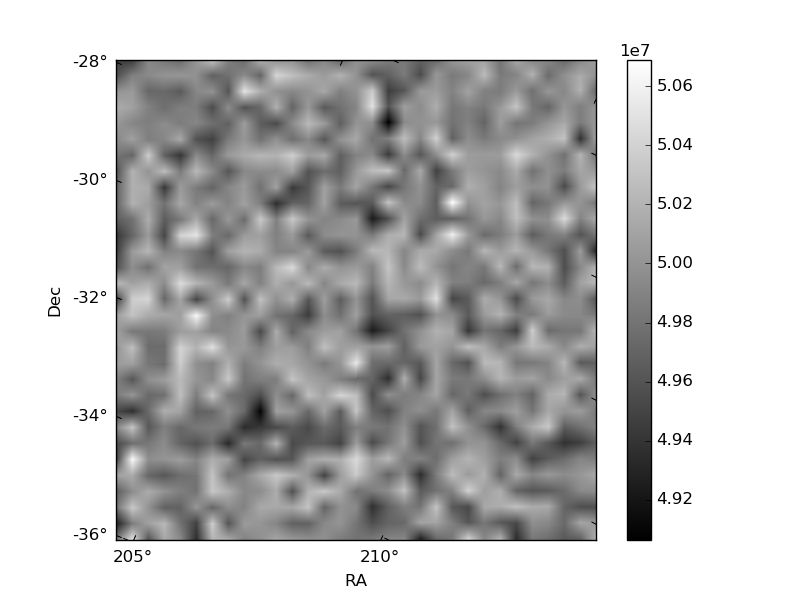
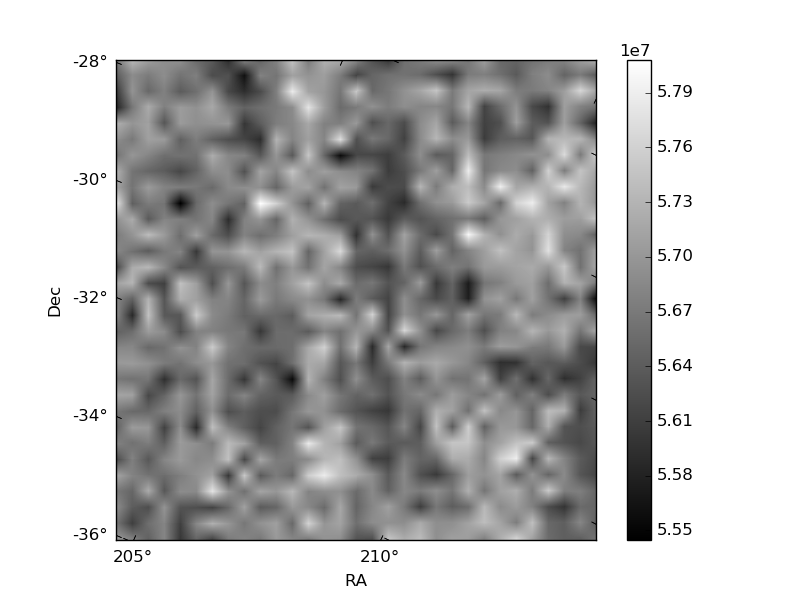
Histogram calculated using DETX and DETY for each event in the final _common_clean file
| Quadrant A | 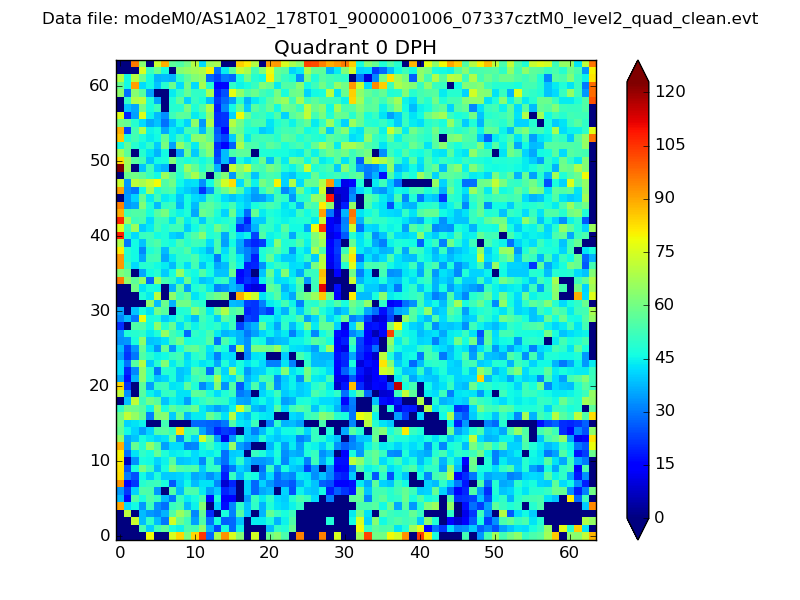 |
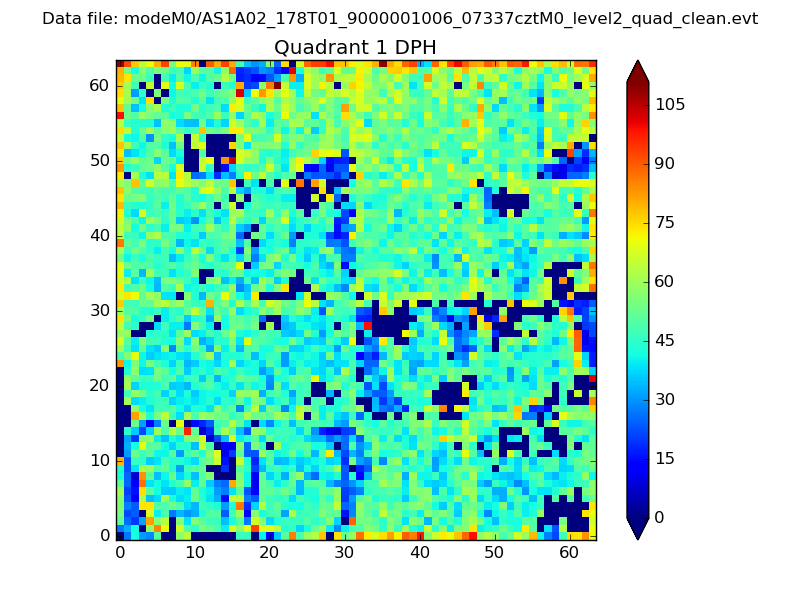 |
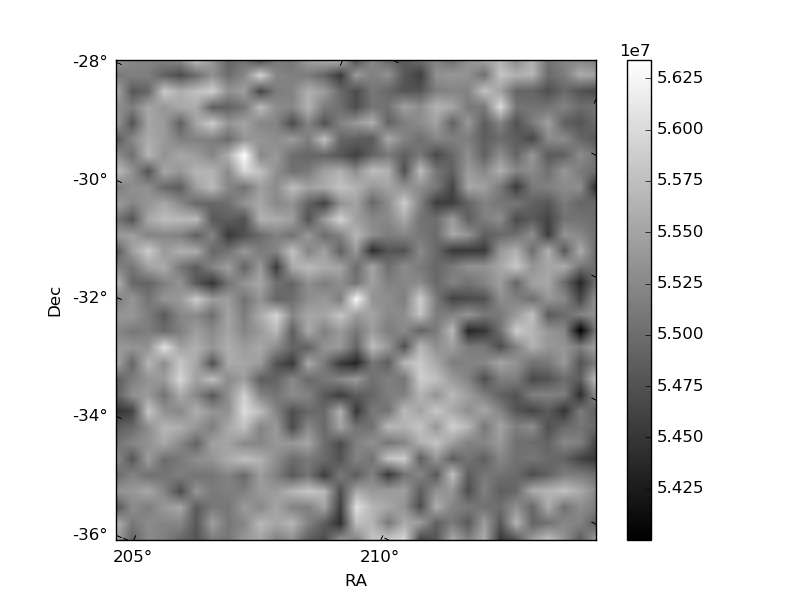
Quadrant B |
|---|---|---|---|
| Quadrant D | 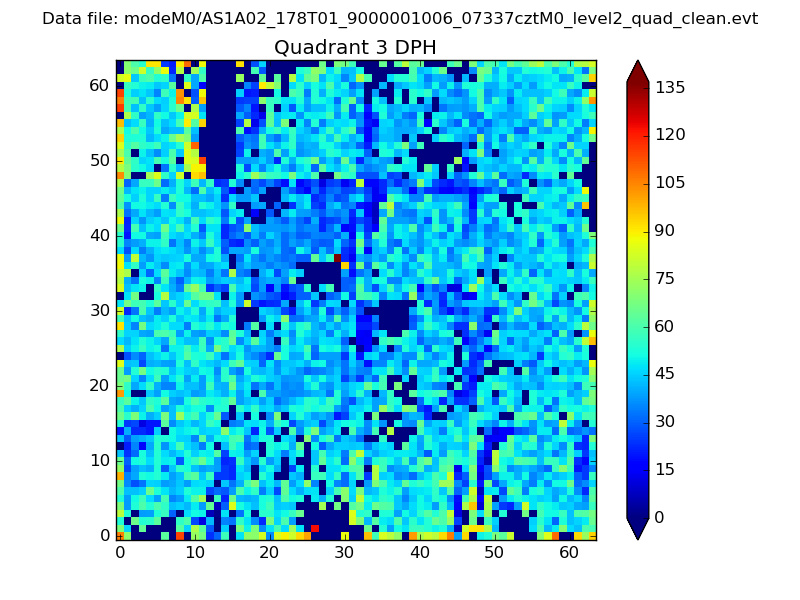 |
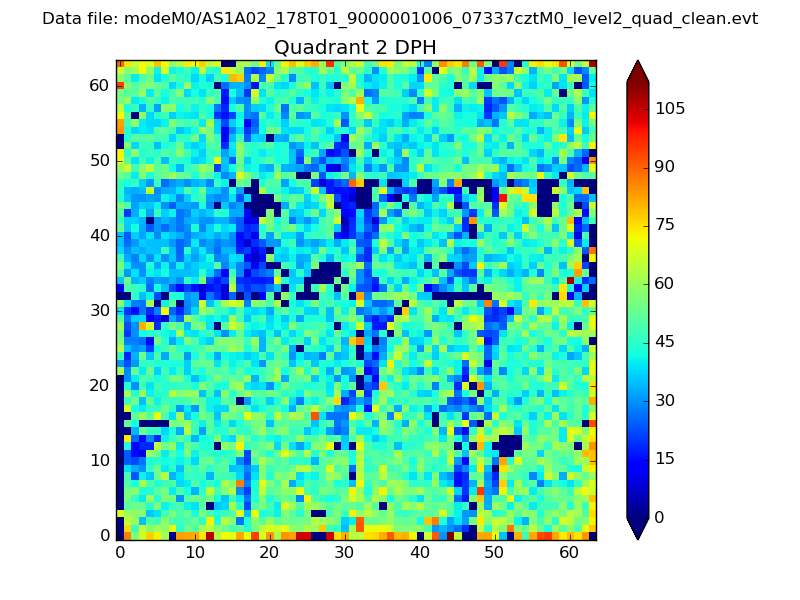 |
Quadrant C |
| Plot type | Count rate plots | Images |
|---|---|---|
| Comparison with Poisson distribution Blue bars denote a histogram of data divided into 1 sec bins. Red curve is a Poisson curve with rate = median count rate of data. |
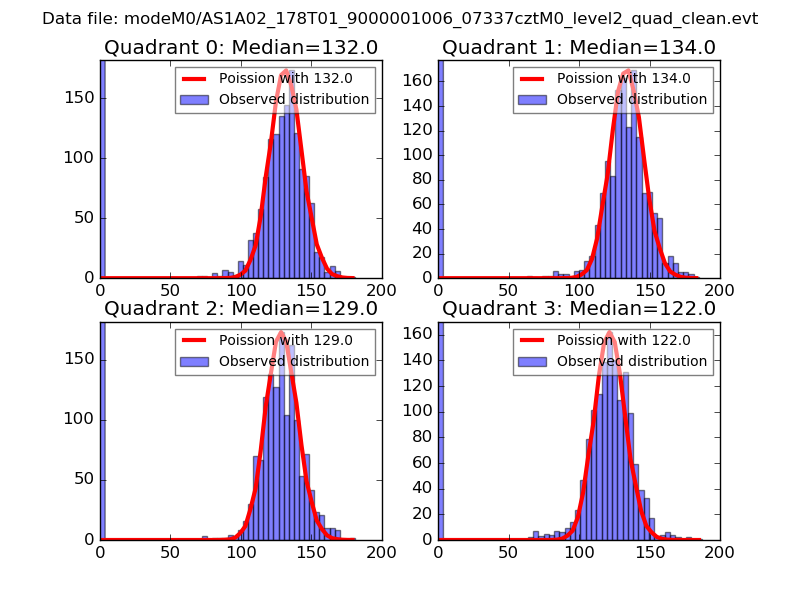 |
 |
| Quadrant-wise count rates Data is divided into 100 sec bins |
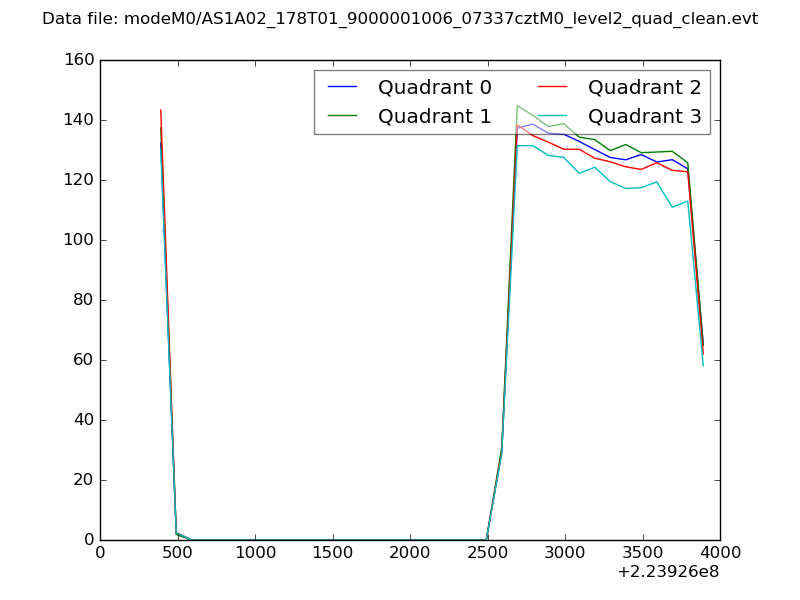 |
|
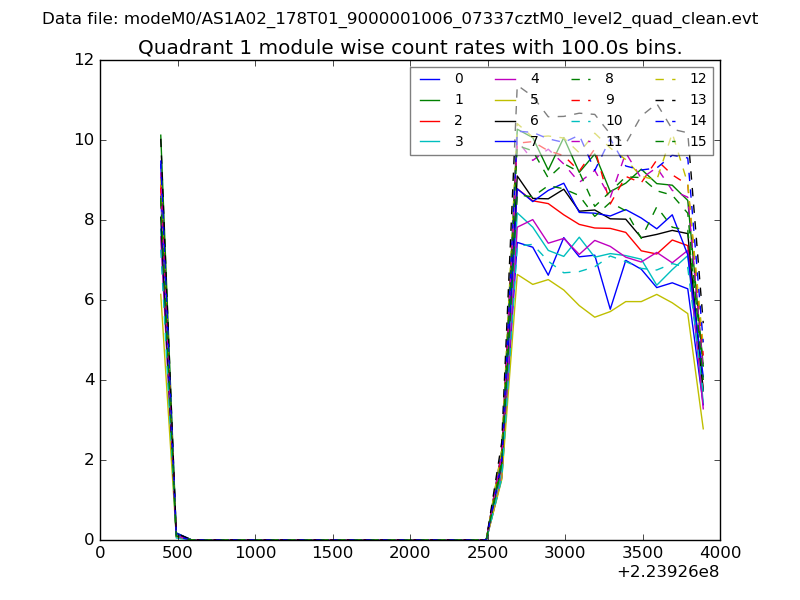
| Module-wise count rates for Quadrant A Data is divided into 100 sec bins |
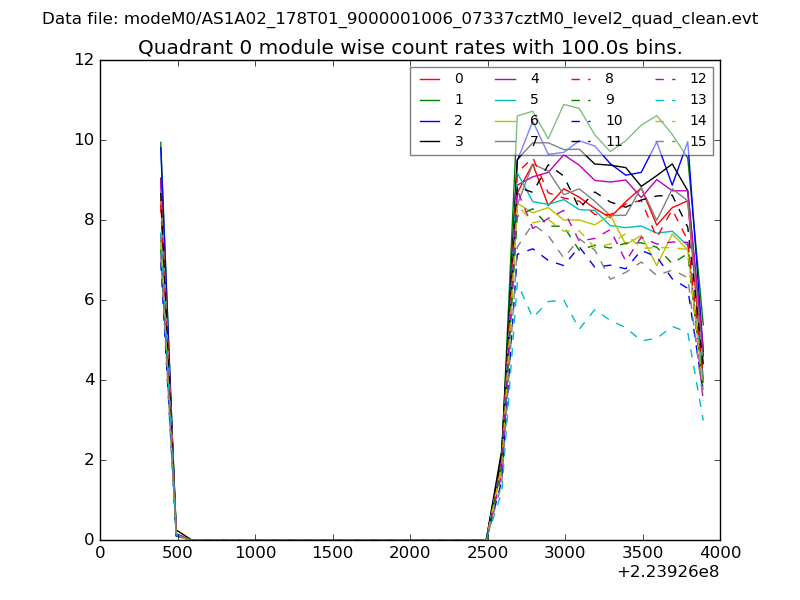 |
 |
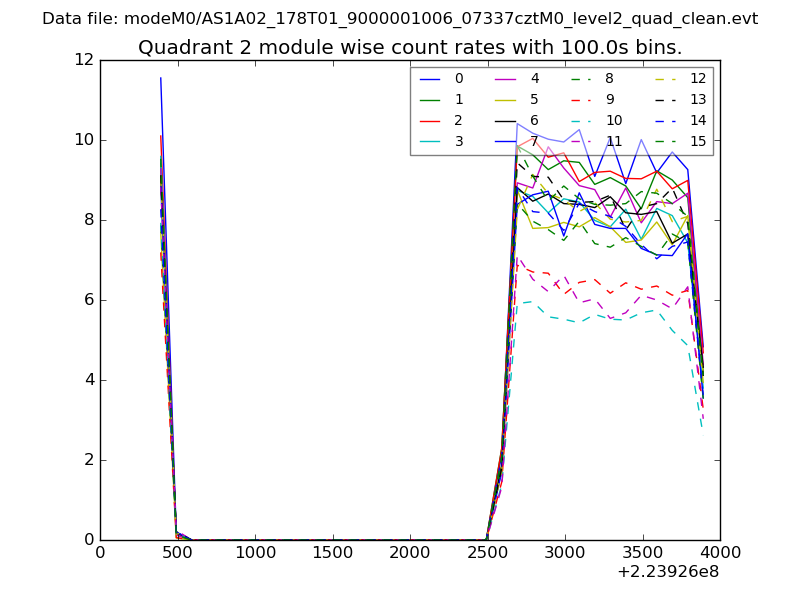
| Module-wise count rates for Quadrant B Data is divided into 100 sec bins |
 |
 |
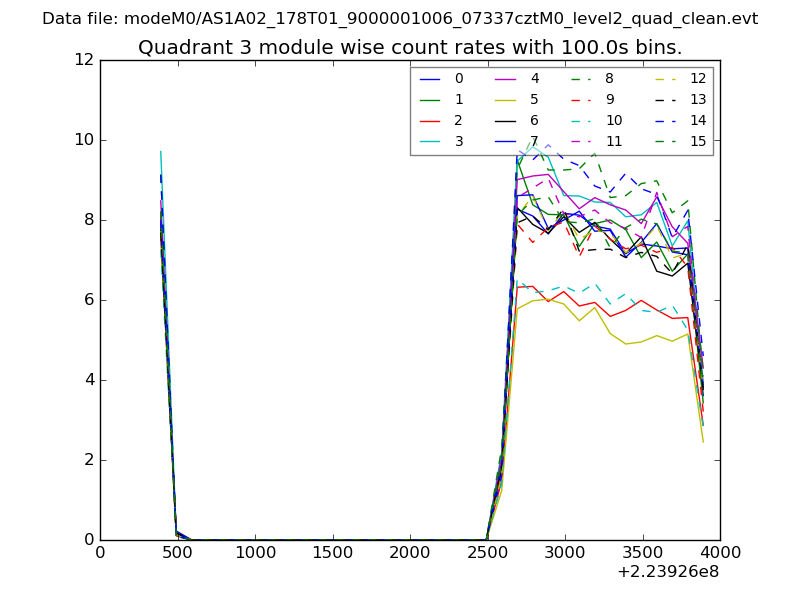
| Module-wise count rates for Quadrant C Data is divided into 100 sec bins |
 |
 |
| Module-wise count rates for Quadrant D Data is divided into 100 sec bins |
 |
 |
| Parameter | Plot |
|---|---|
| CZT HV Monitor | 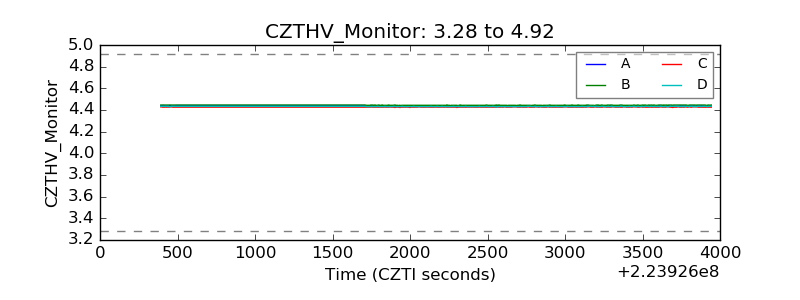 |
| D_VDD | 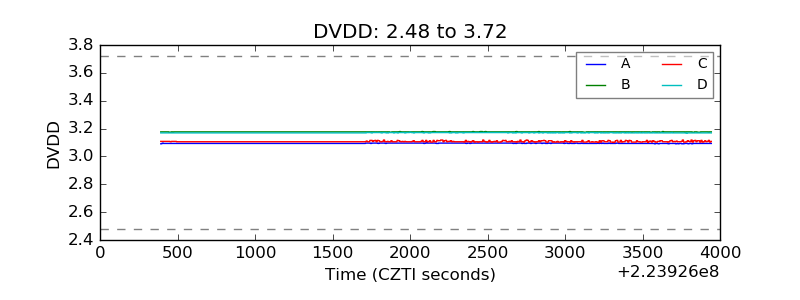 |
| Temperature 1 | 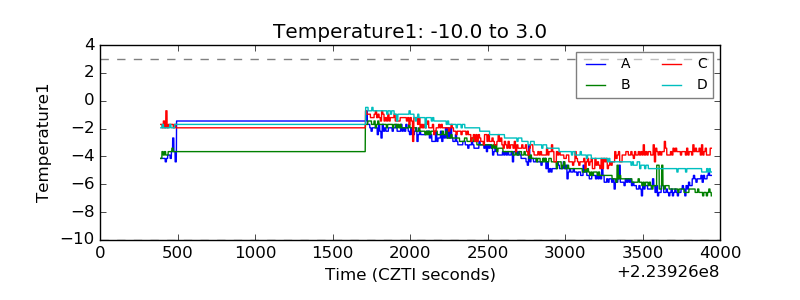 |
| Veto HV Monitor | 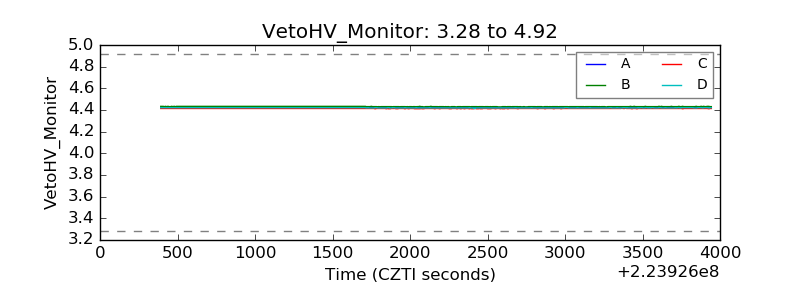 |
| Veto LLD | 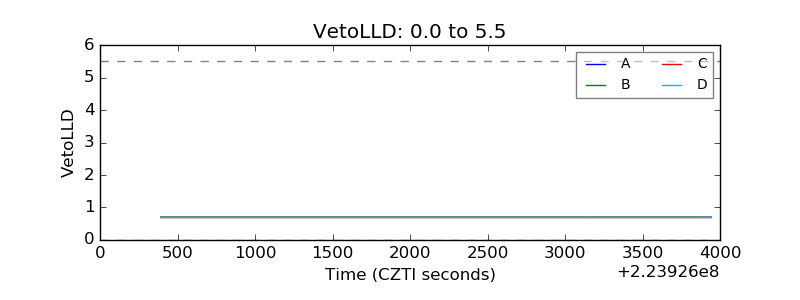 |
| Alpha Counter | 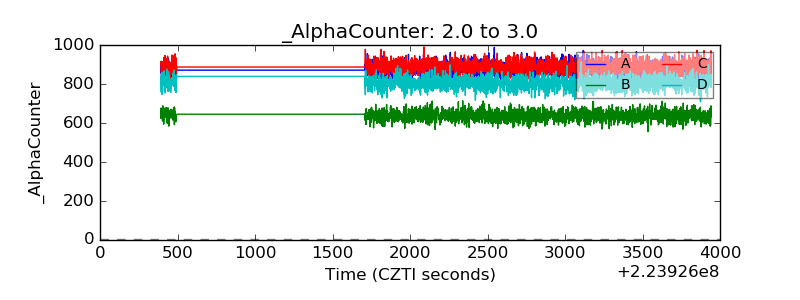 |
| _CPM_Rate | 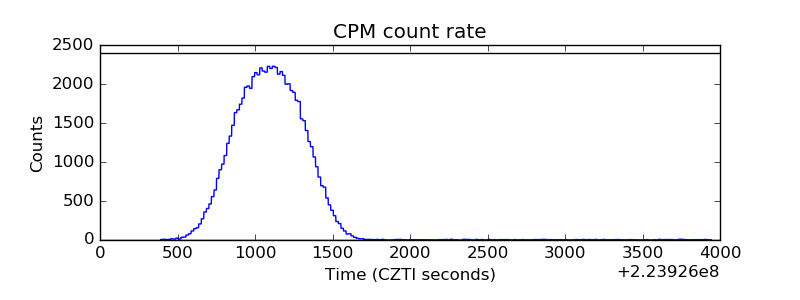 |
| CZT Counter | 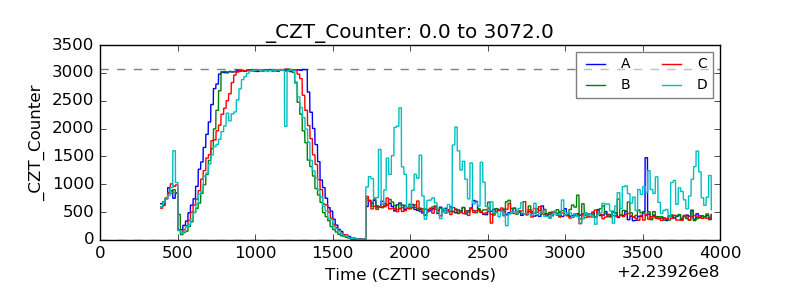 |
| +2.5 Volts monitor |  |
| +5 Volts monitor | 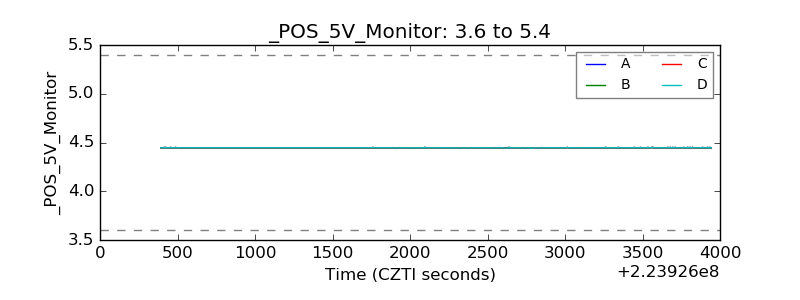 |
| _ROLL_ROT | 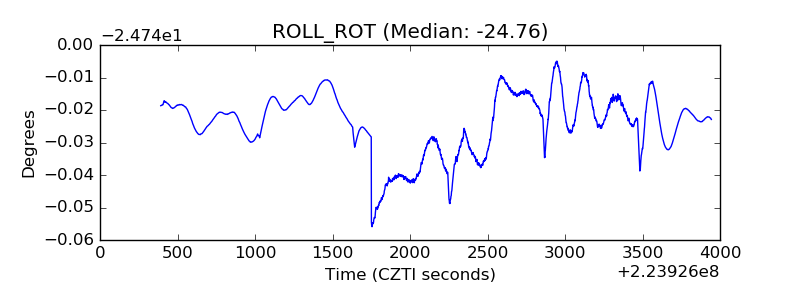 |
| _Roll_DEC | 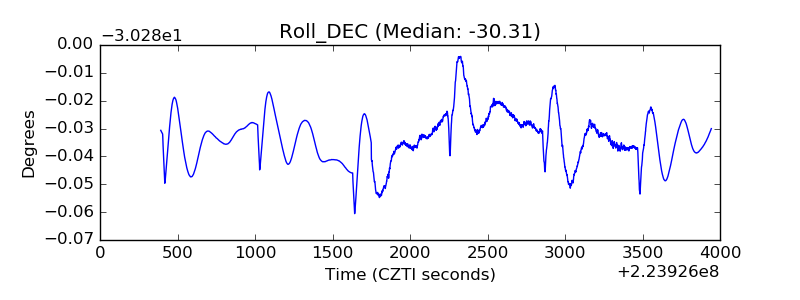 |
| _Roll_RA | 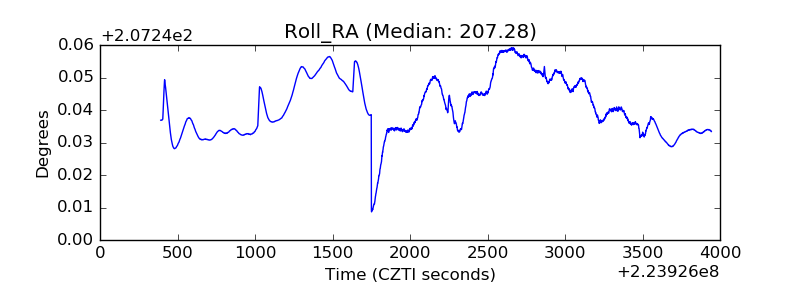 |
| Veto Counter | 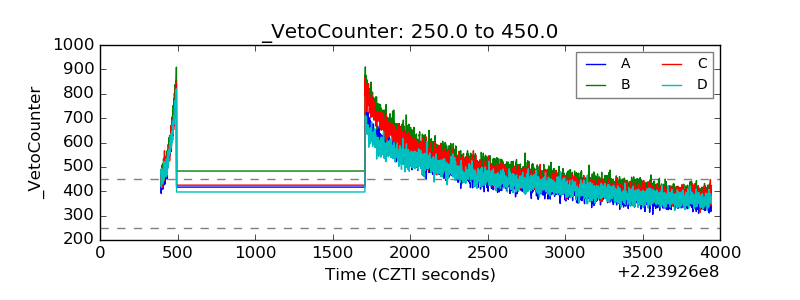 |