| Param | Original file | Final file |
|---|---|---|
| Filename | modeM0/AS1G06_164T01_9000001004cztM0_level2.fits | modeM0/AS1G06_164T01_9000001004cztM0_level2_quad_clean.evt |
| Size (bytes) | 252,815,040 | 308,347,200 |
| Size | 241.1 MB | 294.1 MB |
| Events in quadrant A | 1,481,430 | 1,937,392 |
| Events in quadrant B | 1,449,864 | 1,920,589 |
| Events in quadrant C | 1,479,812 | 1,824,926 |
| Events in quadrant D | 1,268,712 | 1,679,865 |
| Mode SS | |||
|---|---|---|---|
| Quadrant | BADHDUFLAG | Total packets | Discarded packets |
| A | 0 | 584 | 0 |
| B | 0 | 584 | 0 |
| C | 0 | 582 | 0 |
| D | 0 | 584 | 0 |
| Mode M9 | |||
|---|---|---|---|
| Quadrant | BADHDUFLAG | Total packets | Discarded packets |
| A | 0 | 16 | 0 |
| B | 0 | 16 | 0 |
| C | 0 | 16 | 0 |
| D | 0 | 16 | 0 |
| Mode M0 | |||
|---|---|---|---|
| Quadrant | BADHDUFLAG | Total packets | Discarded packets |
| A | 0 | 62011 | 0 |
| B | 0 | 60082 | 0 |
| C | 0 | 59074 | 0 |
| D | 0 | 65004 | 0 |
| Quadrant | Total seconds | Saturated seconds | Saturation percentage |
|---|---|---|---|
| A | 28737 | 814 | 2.832585% |
| B | 28741 | 670 | 2.331165% |
| C | 28741 | 381 | 1.325632% |
| D | 28740 | 560 | 1.948504% |
Noise dominated data is calculated using 1-second bins in cleaned event files. If a bin has >2000 counts, and if more than 50% of those come from <1% of pixels, then it is considered to be noise-dominated and hence unusable.
| Quadrant | # 1 sec bins | Bins with >0 counts | Bins with >2000 counts | High rate bins dominated by noise | Noise dominated (total time) | Noise dominated (detector-on time) | Marked lightcurve |
|---|---|---|---|---|---|---|---|
| A | 30341 | 28743 | 0 | 0 | 0.00% | 0.00% |  |
| B | 30341 | 28743 | 0 | 0 | 0.00% | 0.00% |  |
| C | 30341 | 28745 | 0 | 0 | 0.00% | 0.00% | 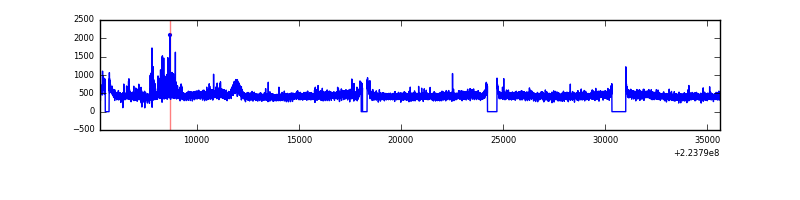 |
| D | 30341 | 28738 | 0 | 0 | 0.00% | 0.00% |  |
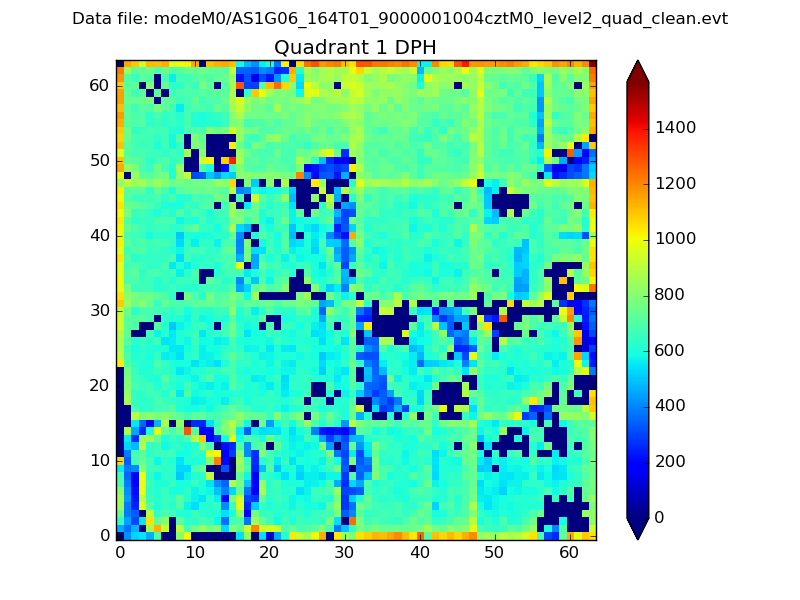
Top three noisy pixels from each quadrant. If the there are fewer than three noisy pixels in the level2.evt file, extra rows are filled as -1
| Pixel properties | Quadrant properties | ||||||
|---|---|---|---|---|---|---|---|
| Quadrant | DetID | PixID | Counts | Sigma | Mean | Median | Sigma |
| A | 14 | 188 | 1468 | 11.05 | 384 | 359 | 100.3 |
| A | 0 | 29 | 1434 | 10.71 | 384 | 359 | 100.3 |
| A | 14 | 204 | 1252 | 8.9 | 384 | 359 | 100.3 |
| B | 2 | 9 | 1319 | 12.48 | 381 | 362 | 76.7 |
| B | 3 | 17 | 990 | 8.19 | 381 | 362 | 76.7 |
| B | 14 | 254 | 978 | 8.03 | 381 | 362 | 76.7 |
| C | 1 | 80 | 1087 | 6.9 | 390 | 360 | 105.4 |
| C | 1 | 81 | 1083 | 6.86 | 390 | 360 | 105.4 |
| C | 12 | 241 | 1078 | 6.82 | 390 | 360 | 105.4 |
| D | 3 | 14 | 969 | 6.5 | 361 | 326 | 98.9 |
| D | 6 | 231 | 946 | 6.27 | 361 | 326 | 98.9 |
| D | 3 | 31 | 922 | 6.02 | 361 | 326 | 98.9 |
Histogram calculated using DETX and DETY for each event in the final _common_clean file
| Quadrant A |  |
 |
Quadrant B |
|---|---|---|---|
| Quadrant D |  |
 |
Quadrant C |
| Plot type | Count rate plots | Images |
|---|---|---|
| Comparison with Poisson distribution Blue bars denote a histogram of data divided into 1 sec bins. Red curve is a Poisson curve with rate = median count rate of data. |
 |
 |
| Quadrant-wise count rates Data is divided into 100 sec bins |
 |
|
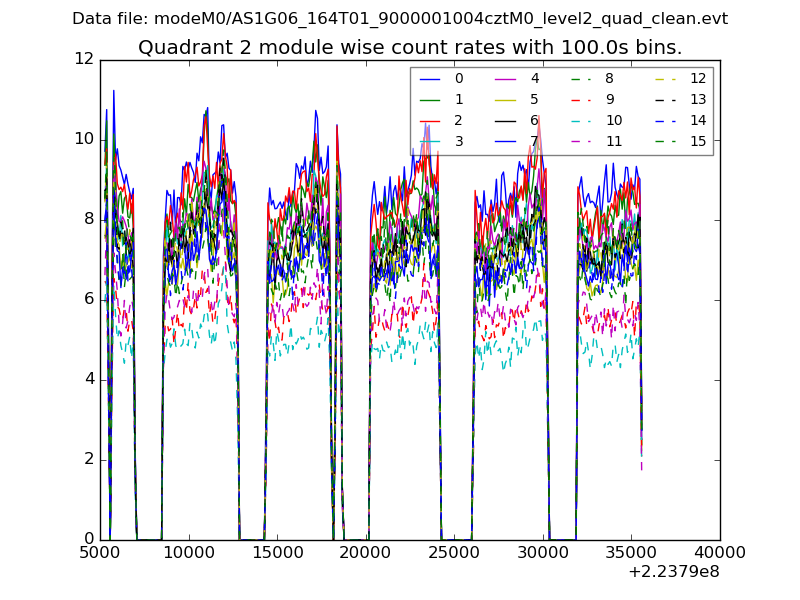
| Module-wise count rates for Quadrant A Data is divided into 100 sec bins |
 |
 |
| Module-wise count rates for Quadrant B Data is divided into 100 sec bins |
 |
 |
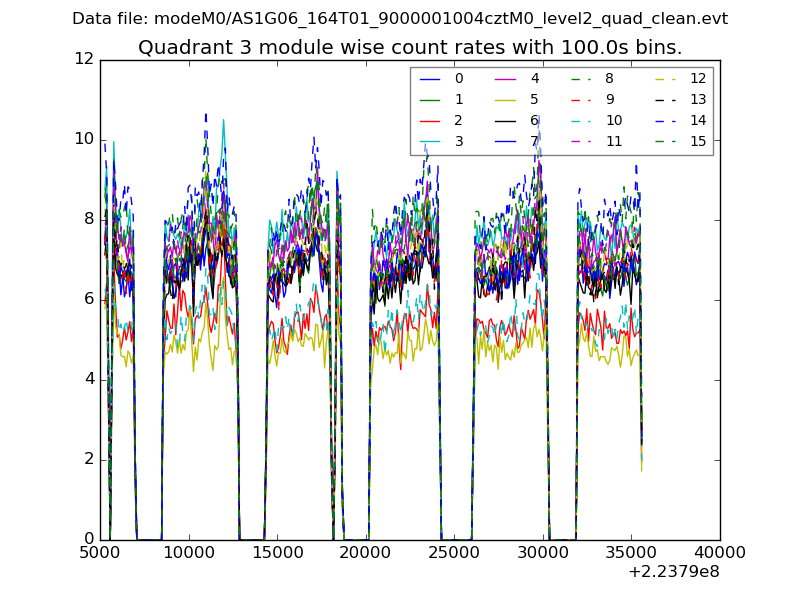
| Module-wise count rates for Quadrant C Data is divided into 100 sec bins |
 |
 |
| Module-wise count rates for Quadrant D Data is divided into 100 sec bins |
 |
 |
| Parameter | Plot |
|---|---|
| CZT HV Monitor |  |
| D_VDD | 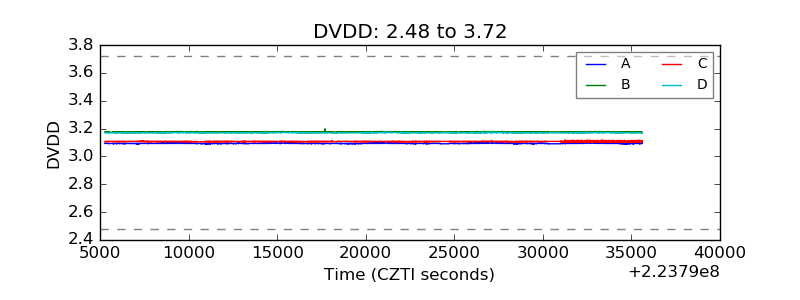 |
| Temperature 1 |  |
| Veto HV Monitor |  |
| Veto LLD |  |
| Alpha Counter |  |
| _CPM_Rate | 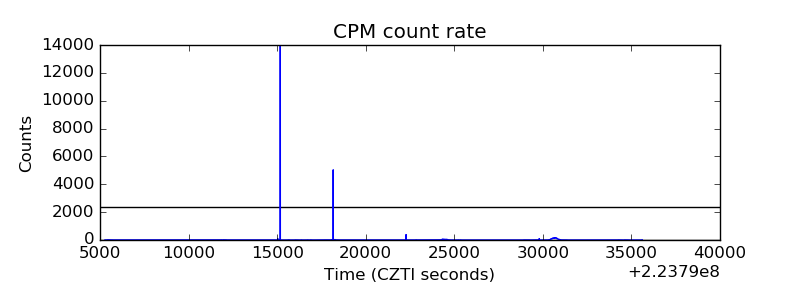 |
| CZT Counter | 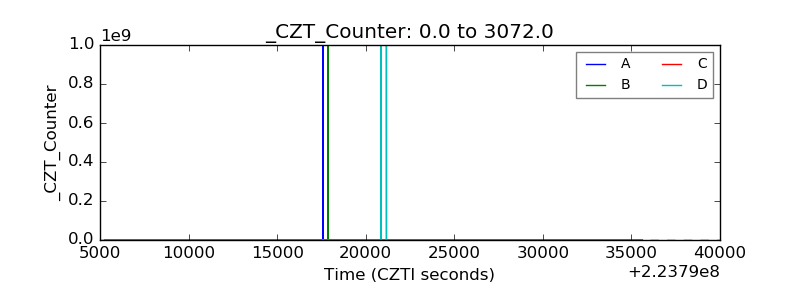 |
| +2.5 Volts monitor |  |
| +5 Volts monitor |  |
| _ROLL_ROT | 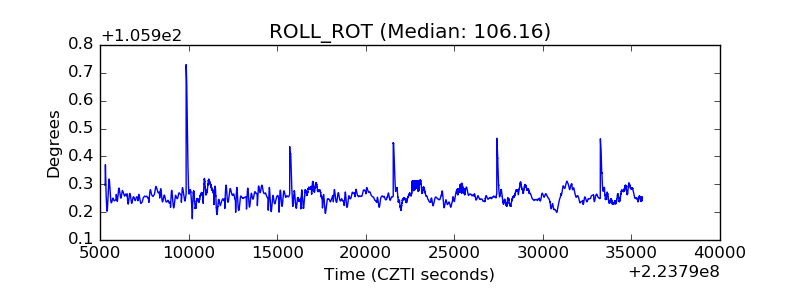 |
| _Roll_DEC |  |
| _Roll_RA | 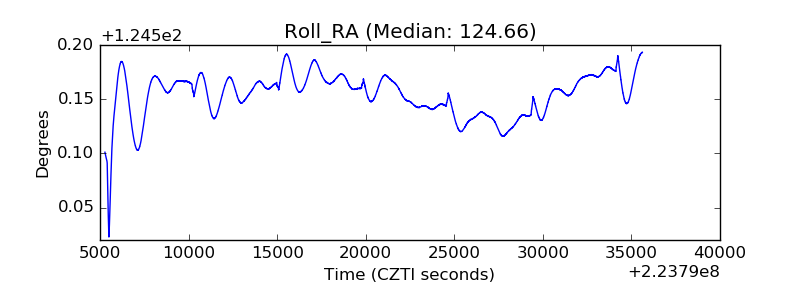 |
| Veto Counter |  |