| Param | Original file | Final file |
|---|---|---|
| Filename | modeM0/AS1G06_164T01_9000001004_07317cztM0_level2.evt | modeM0/AS1G06_164T01_9000001004_07317cztM0_level2_quad_clean.evt |
| Size (bytes) | 72,645,120 | 21,237,120 |
| Size | 69.3 MB | 20.3 MB |
| Events in quadrant A | 508,725 | 141,679 |
| Events in quadrant B | 535,327 | 140,985 |
| Events in quadrant C | 502,945 | 138,809 |
| Events in quadrant D | 571,864 | 134,129 |
| Mode SS | |||
|---|---|---|---|
| Quadrant | BADHDUFLAG | Total packets | Discarded packets |
| A | 0 | 63 | 43 |
| B | 0 | 69 | 47 |
| C | 0 | 66 | 46 |
| D | 0 | 72 | 44 |
| Mode M9 | |||
|---|---|---|---|
| Quadrant | BADHDUFLAG | Total packets | Discarded packets |
| A | 0 | 2 | 2 |
| B | 1 | 2 | 2 |
| C | 1 | -1 | -1 |
| D | 1 | -1 | -1 |
| Mode M0 | |||
|---|---|---|---|
| Quadrant | BADHDUFLAG | Total packets | Discarded packets |
| A | 0 | 6876 | 4553 |
| B | 0 | 7015 | 4677 |
| C | 0 | 6817 | 4538 |
| D | 0 | 7591 | 5224 |
| Quadrant | Total seconds | Saturated seconds | Saturation percentage |
|---|---|---|---|
| A | 1158 | 2 | 0.172712% |
| B | 1153 | 0 | 0.000000% |
| C | 1136 | 0 | 0.000000% |
| D | 1144 | 1 | 0.087413% |
Noise dominated data is calculated using 1-second bins in cleaned event files. If a bin has >2000 counts, and if more than 50% of those come from <1% of pixels, then it is considered to be noise-dominated and hence unusable.
| Quadrant | # 1 sec bins | Bins with >0 counts | Bins with >2000 counts | High rate bins dominated by noise | Noise dominated (total time) | Noise dominated (detector-on time) | Marked lightcurve |
|---|---|---|---|---|---|---|---|
| A | 6949 | 1303 | 0 | 0 | 0.00% | 0.00% | 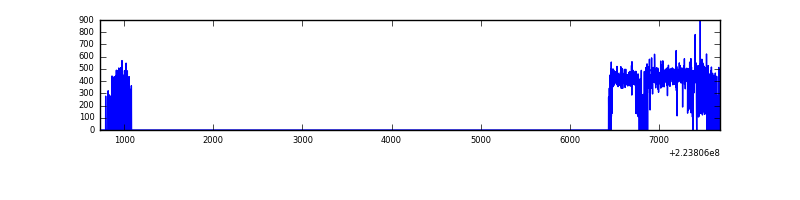 |
| B | 6930 | 1300 | 0 | 0 | 0.00% | 0.00% | 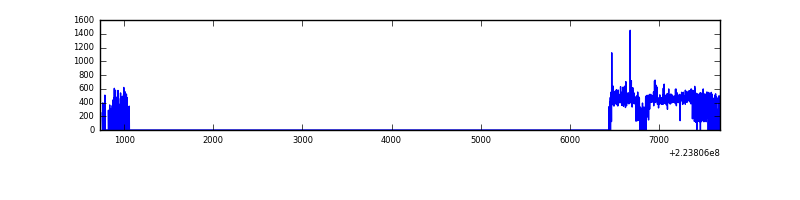 |
| C | 6893 | 1278 | 0 | 0 | 0.00% | 0.00% | 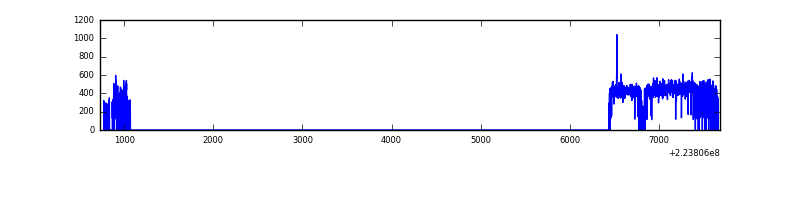 |
| D | 6945 | 1296 | 0 | 0 | 0.00% | 0.00% | 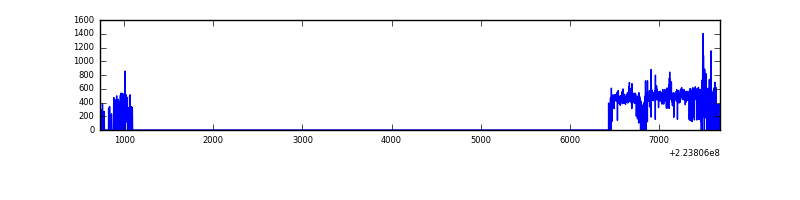 |
Top three noisy pixels from each quadrant. If the there are fewer than three noisy pixels in the level2.evt file, extra rows are filled as -1
| Pixel properties | Quadrant properties | ||||||
|---|---|---|---|---|---|---|---|
| Quadrant | DetID | PixID | Counts | Sigma | Mean | Median | Sigma |
| A | 8 | 15 | 3145 | 105.44 | 130 | 127 | 28.6 |
| A | 13 | 14 | 1608 | 51.74 | 130 | 127 | 28.6 |
| A | 0 | 226 | 1156 | 35.95 | 130 | 127 | 28.6 |
| B | 11 | 51 | 14996 | 536.64 | 133 | 129 | 27.7 |
| B | 12 | 111 | 2716 | 93.38 | 133 | 129 | 27.7 |
| B | 11 | 111 | 2146 | 72.81 | 133 | 129 | 27.7 |
| C | 9 | 68 | 2935 | 86.42 | 128 | 128 | 32.5 |
| C | 13 | 61 | 1002 | 26.91 | 128 | 128 | 32.5 |
| C | 10 | 22 | 357 | 7.05 | 128 | 128 | 32.5 |
| D | 1 | 20 | 86762 | 2623.85 | 125 | 120 | 33.0 |
| D | 12 | 233 | 10531 | 315.28 | 125 | 120 | 33.0 |
| D | 2 | 14 | 3639 | 106.57 | 125 | 120 | 33.0 |
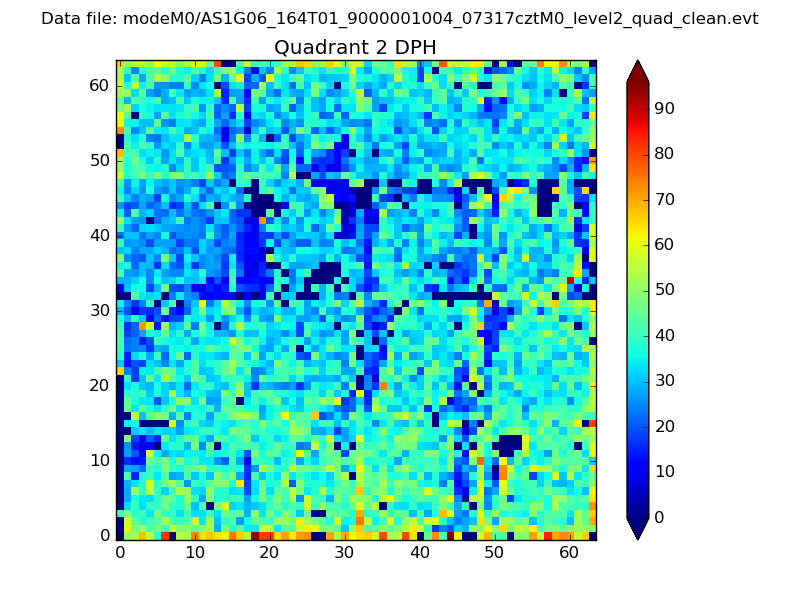
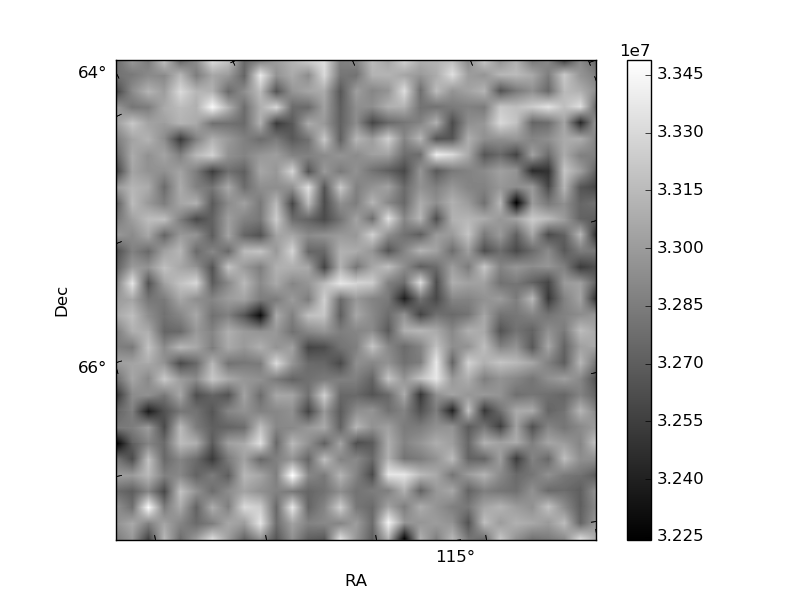
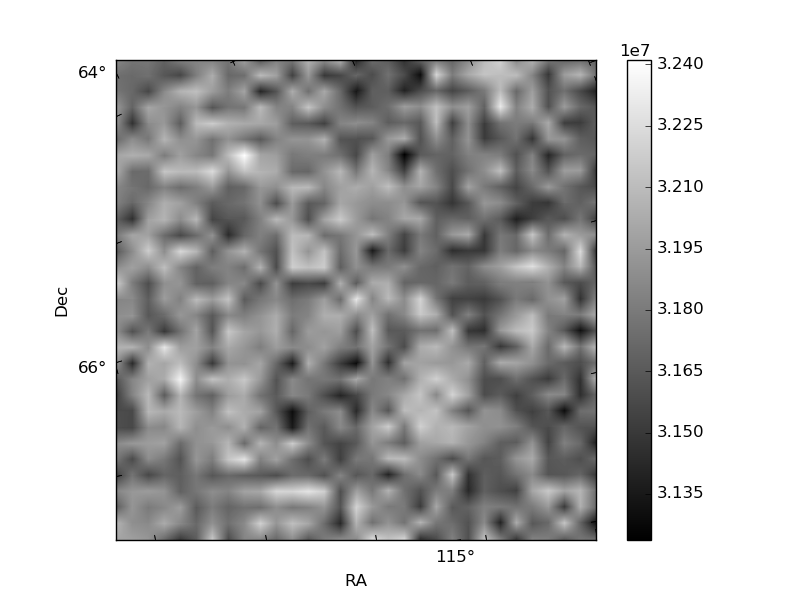
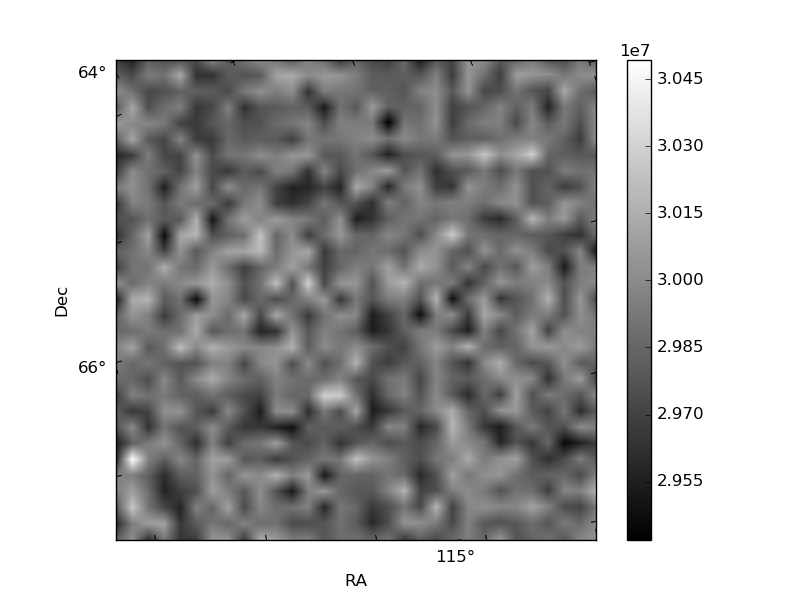
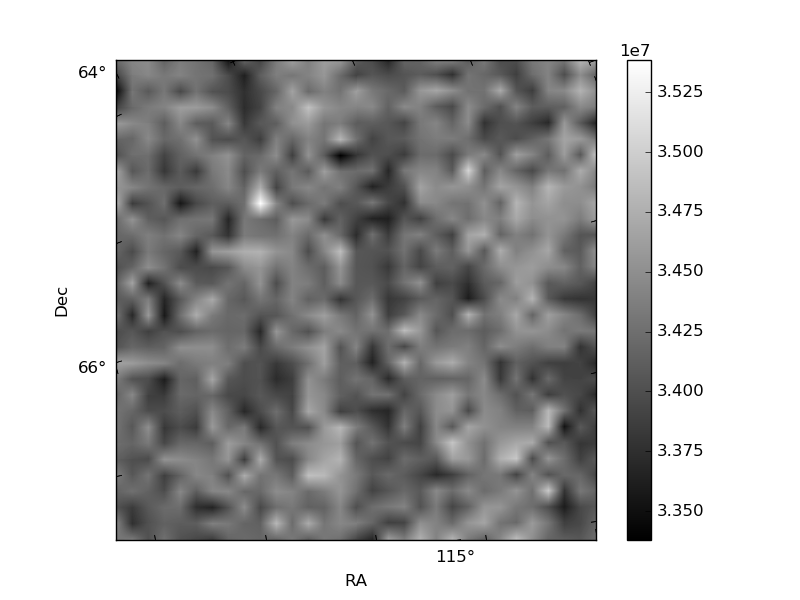
Histogram calculated using DETX and DETY for each event in the final _common_clean file
| Quadrant A | 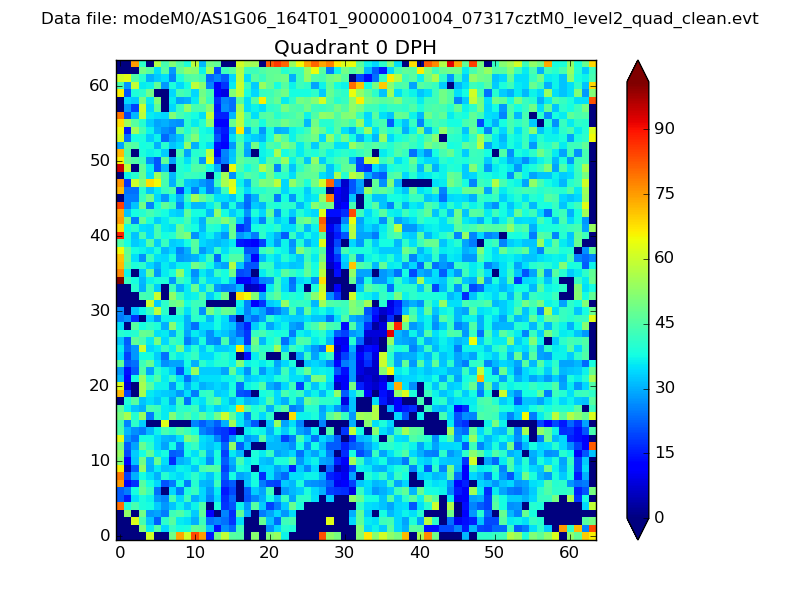 |
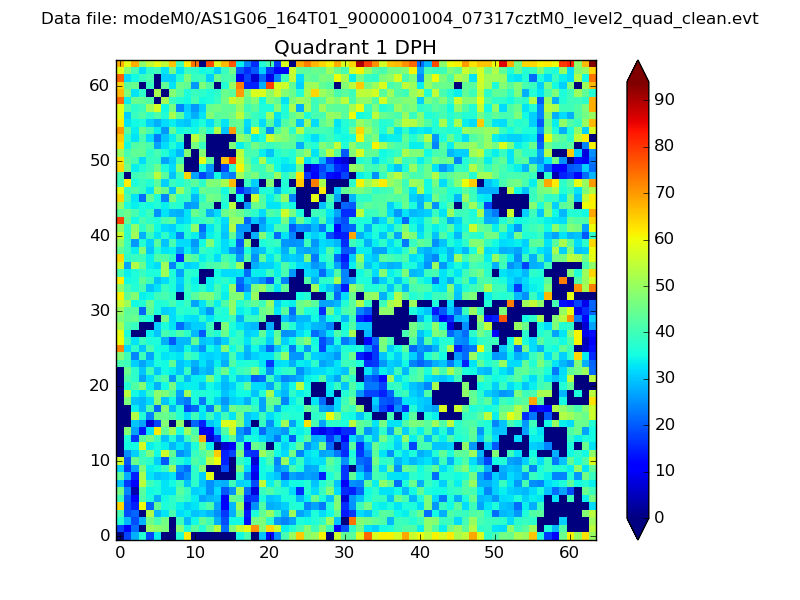 |
Quadrant B |
|---|---|---|---|
| Quadrant D | 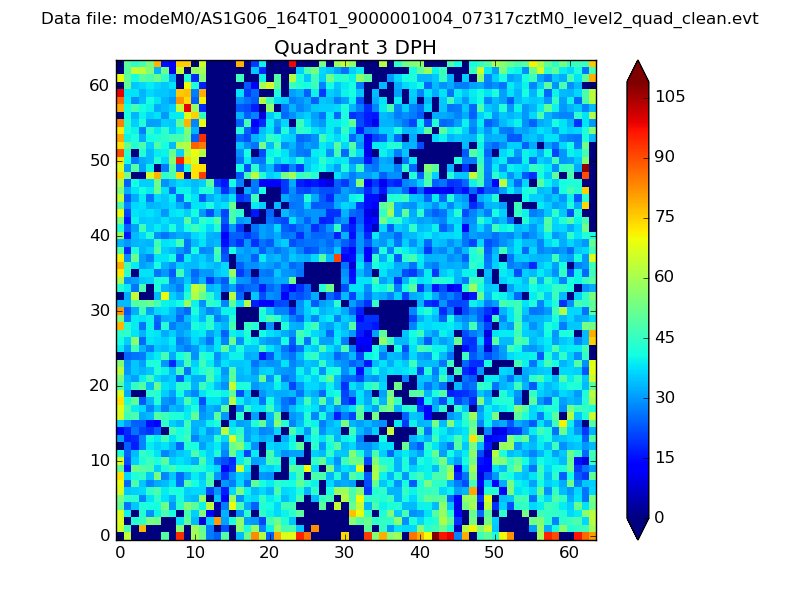 |
 |
Quadrant C |
| Plot type | Count rate plots | Images |
|---|---|---|
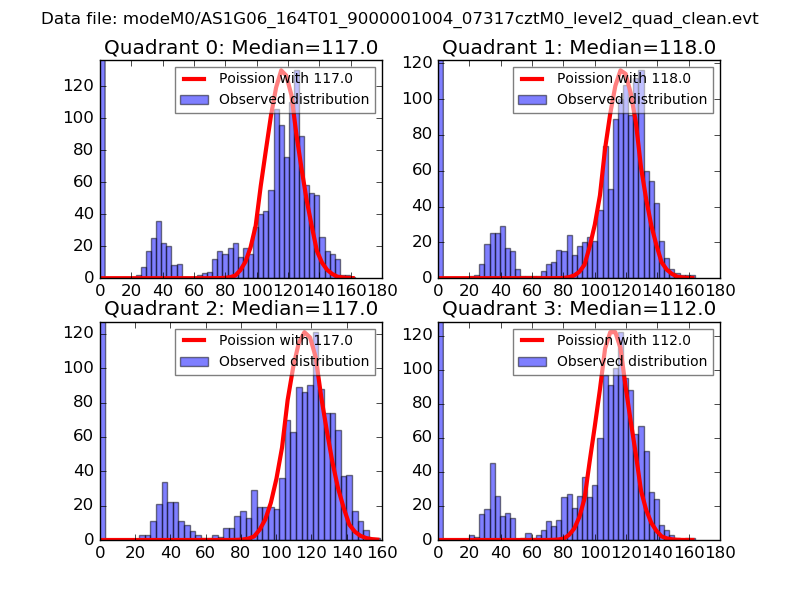
| Comparison with Poisson distribution Blue bars denote a histogram of data divided into 1 sec bins. Red curve is a Poisson curve with rate = median count rate of data. |
 |
 |
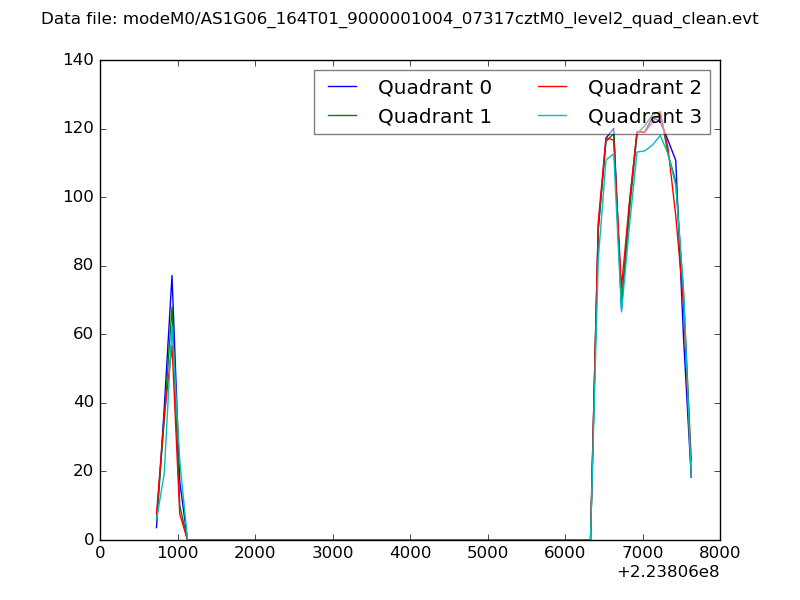
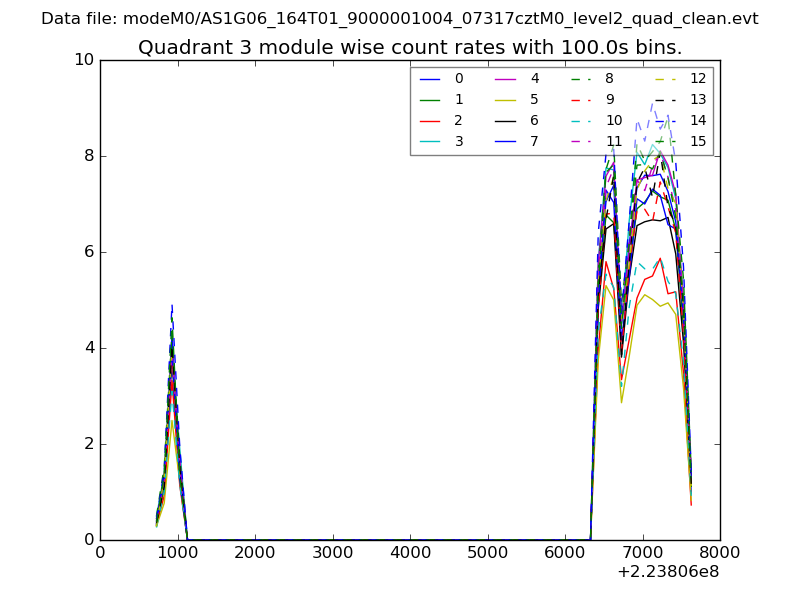
| Quadrant-wise count rates Data is divided into 100 sec bins |
 |
|
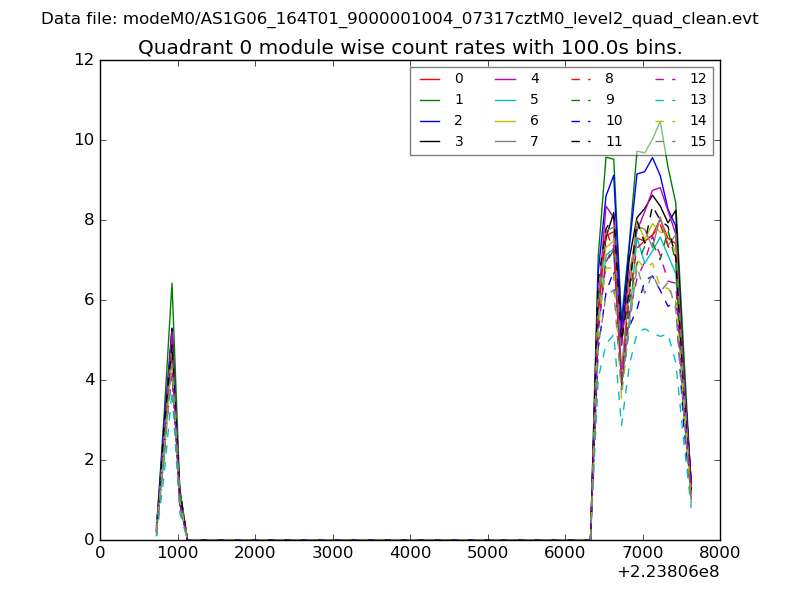
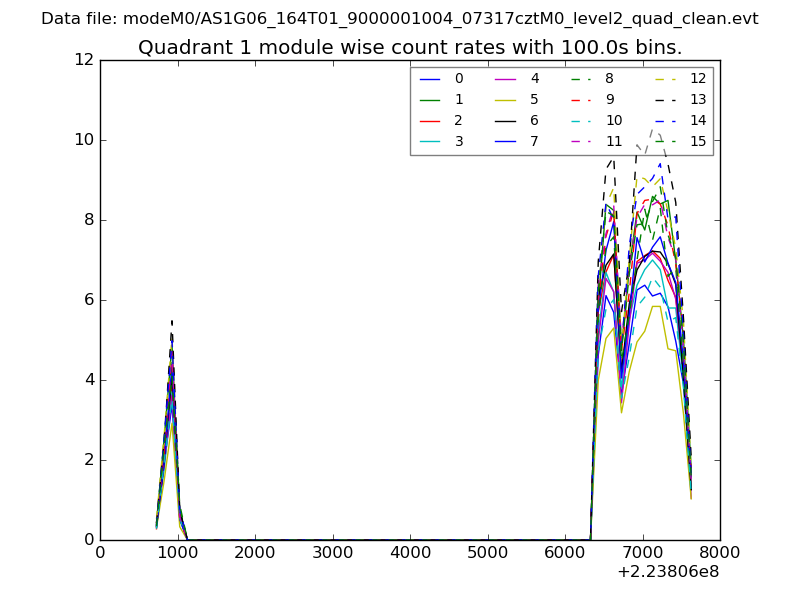
| Module-wise count rates for Quadrant A Data is divided into 100 sec bins |
 |
 |
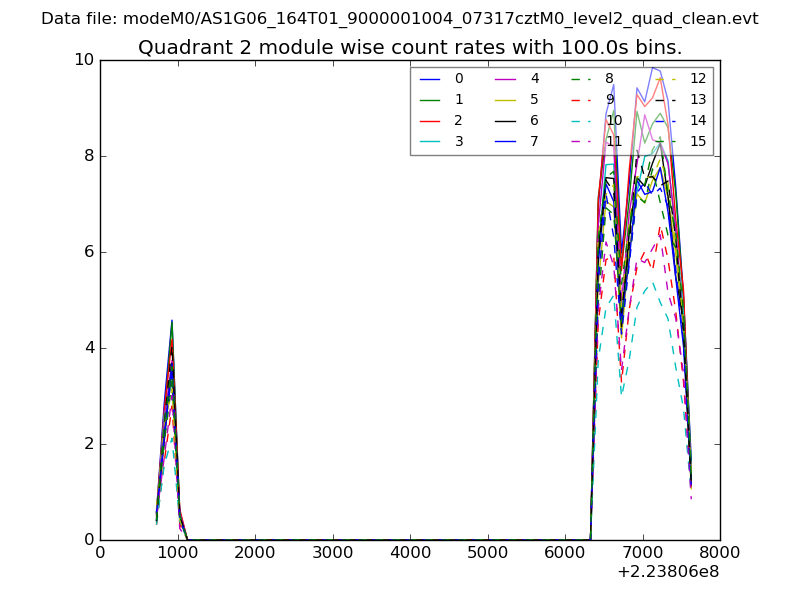
| Module-wise count rates for Quadrant B Data is divided into 100 sec bins |
 |
 |
| Module-wise count rates for Quadrant C Data is divided into 100 sec bins |
 |
 |
| Module-wise count rates for Quadrant D Data is divided into 100 sec bins |
 |
 |
| Parameter | Plot |
|---|---|
| CZT HV Monitor | 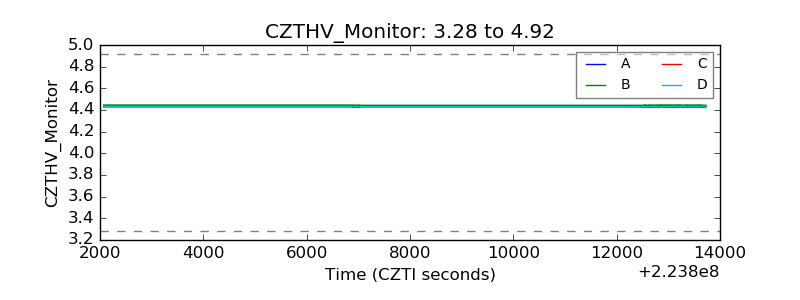 |
| D_VDD | 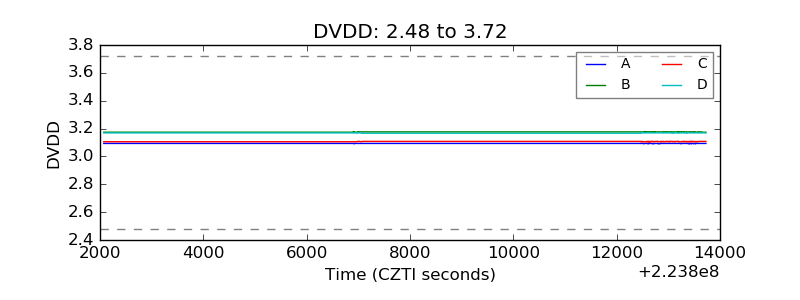 |
| Temperature 1 | 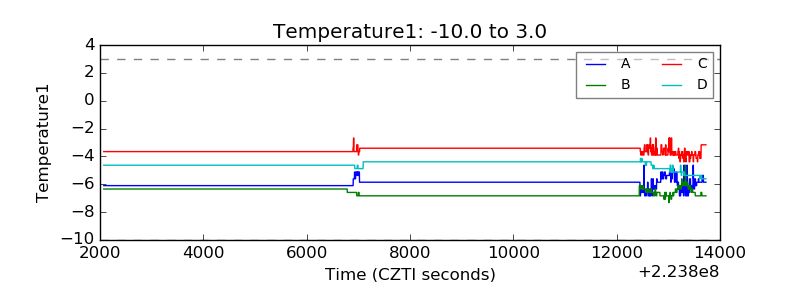 |
| Veto HV Monitor |  |
| Veto LLD | 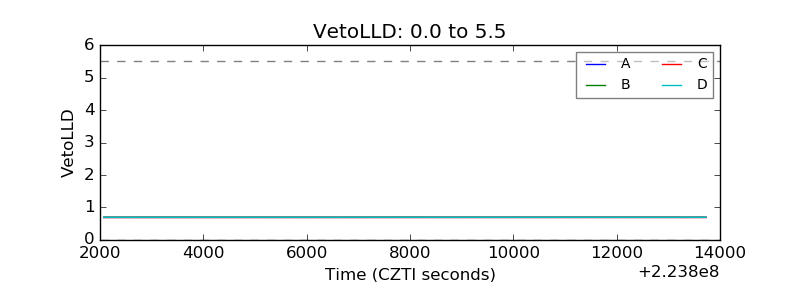 |
| Alpha Counter | 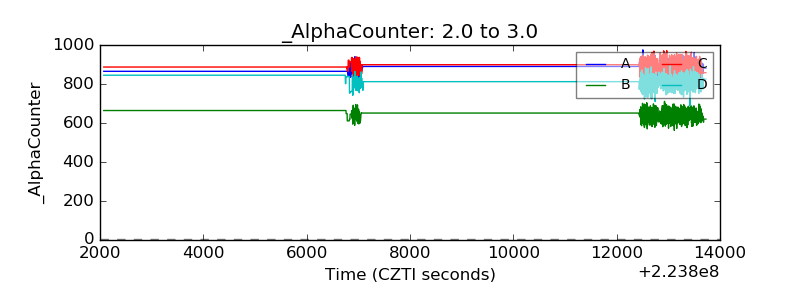 |
| _CPM_Rate | 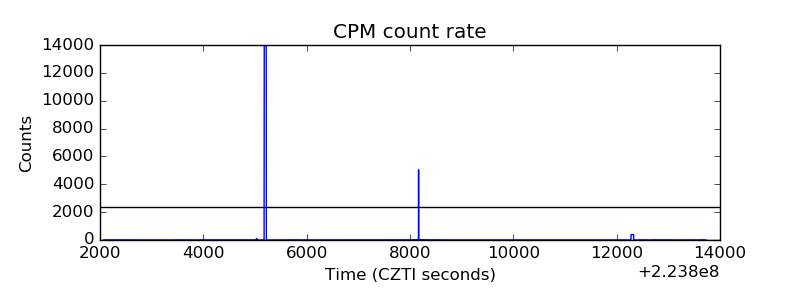 |
| CZT Counter | 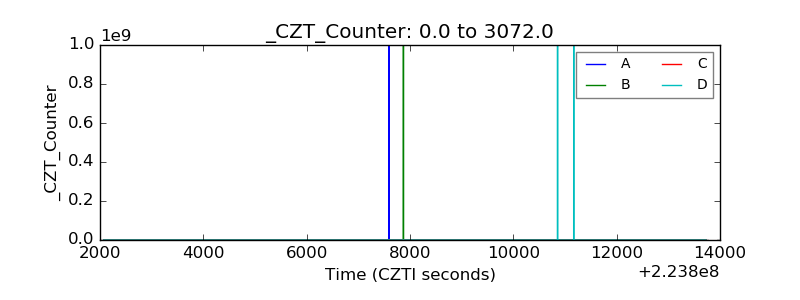 |
| +2.5 Volts monitor |  |
| +5 Volts monitor |  |
| _ROLL_ROT | 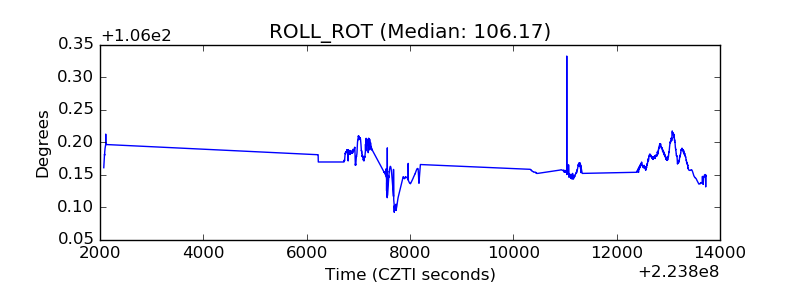 |
| _Roll_DEC | 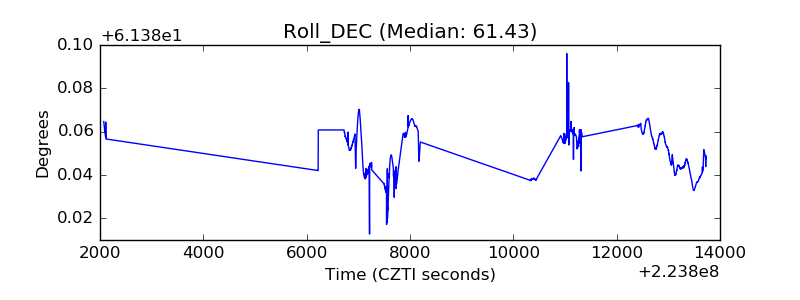 |
| _Roll_RA | 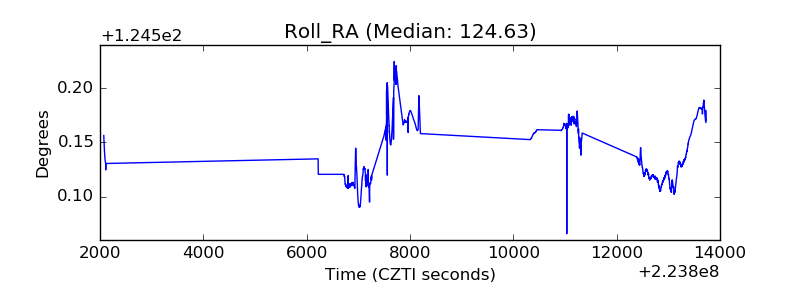 |
| Veto Counter | 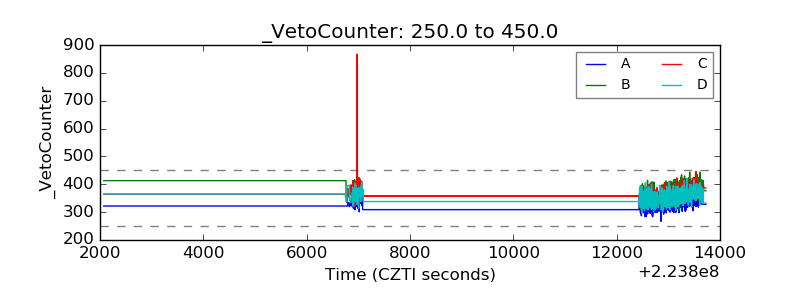 |