| Param | Original file | Final file |
|---|---|---|
| Filename | modeM0/AS1G06_164T01_9000001004_07318cztM0_level2.evt | modeM0/AS1G06_164T01_9000001004_07318cztM0_level2_quad_clean.evt |
| Size (bytes) | 688,731,840 | 157,055,040 |
| Size | 656.8 MB | 149.8 MB |
| Events in quadrant A | 5,062,210 | 1,015,017 |
| Events in quadrant B | 5,226,400 | 1,012,287 |
| Events in quadrant C | 4,834,111 | 996,656 |
| Events in quadrant D | 4,980,788 | 962,791 |
| Mode SS | |||
|---|---|---|---|
| Quadrant | BADHDUFLAG | Total packets | Discarded packets |
| A | 0 | 226 | 0 |
| B | 0 | 226 | 0 |
| C | 0 | 226 | 0 |
| D | 0 | 226 | 0 |
| Mode M9 | |||
|---|---|---|---|
| Quadrant | BADHDUFLAG | Total packets | Discarded packets |
| A | 0 | 12 | 0 |
| B | 0 | 12 | 0 |
| C | 0 | 12 | 0 |
| D | 0 | 12 | 0 |
| Mode M0 | |||
|---|---|---|---|
| Quadrant | BADHDUFLAG | Total packets | Discarded packets |
| A | 0 | 22822 | 2 |
| B | 0 | 23030 | 2 |
| C | 0 | 22471 | 2 |
| D | 0 | 22902 | 2 |
| Quadrant | Total seconds | Saturated seconds | Saturation percentage |
|---|---|---|---|
| A | 11124 | 134 | 1.204603% |
| B | 11124 | 150 | 1.348436% |
| C | 11124 | 99 | 0.889968% |
| D | 11124 | 121 | 1.087738% |
Noise dominated data is calculated using 1-second bins in cleaned event files. If a bin has >2000 counts, and if more than 50% of those come from <1% of pixels, then it is considered to be noise-dominated and hence unusable.
| Quadrant | # 1 sec bins | Bins with >0 counts | Bins with >2000 counts | High rate bins dominated by noise | Noise dominated (total time) | Noise dominated (detector-on time) | Marked lightcurve |
|---|---|---|---|---|---|---|---|
| A | 12269 | 11125 | 0 | 0 | 0.00% | 0.00% | 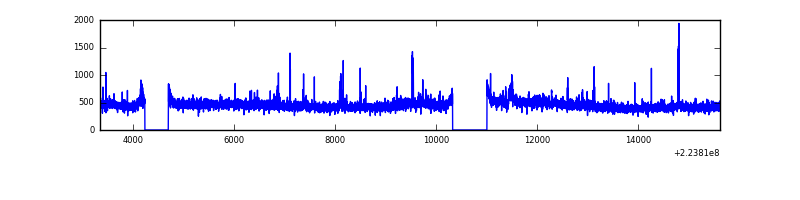 |
| B | 12269 | 11125 | 6 | 6 | 0.05% | 0.05% | 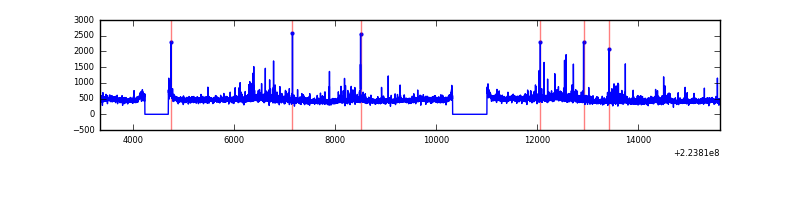 |
| C | 12269 | 11125 | 0 | 0 | 0.00% | 0.00% |  |
| D | 12269 | 11125 | 9 | 9 | 0.07% | 0.08% | 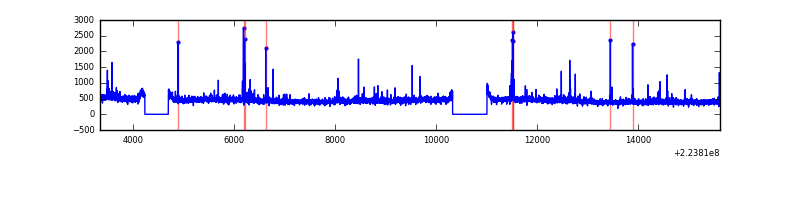 |
Top three noisy pixels from each quadrant. If the there are fewer than three noisy pixels in the level2.evt file, extra rows are filled as -1
| Pixel properties | Quadrant properties | ||||||
|---|---|---|---|---|---|---|---|
| Quadrant | DetID | PixID | Counts | Sigma | Mean | Median | Sigma |
| A | 15 | 234 | 98606 | 383.27 | 1252 | 1221 | 254.1 |
| A | 8 | 15 | 85699 | 332.47 | 1252 | 1221 | 254.1 |
| A | 13 | 248 | 23482 | 87.61 | 1252 | 1221 | 254.1 |
| B | 0 | 214 | 151773 | 632.85 | 1258 | 1228 | 237.9 |
| B | 11 | 51 | 125233 | 521.28 | 1258 | 1228 | 237.9 |
| B | 4 | 81 | 51776 | 212.49 | 1258 | 1228 | 237.9 |
| C | 9 | 68 | 55399 | 191.52 | 1218 | 1224 | 282.9 |
| C | 8 | 128 | 13006 | 41.65 | 1218 | 1224 | 282.9 |
| C | 13 | 61 | 9281 | 28.48 | 1218 | 1224 | 282.9 |
| D | 1 | 20 | 230006 | 775.64 | 1212 | 1169 | 295.0 |
| D | 12 | 233 | 46582 | 153.93 | 1212 | 1169 | 295.0 |
| D | 2 | 14 | 43673 | 144.07 | 1212 | 1169 | 295.0 |
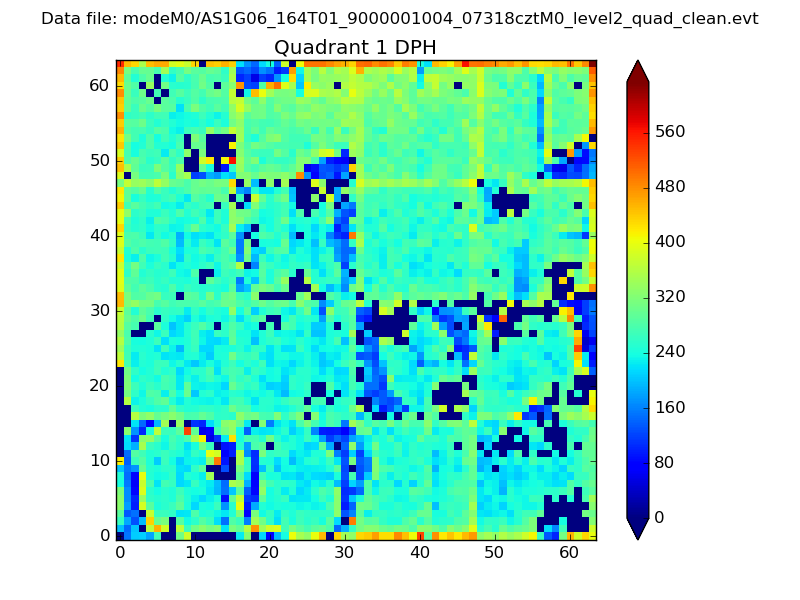
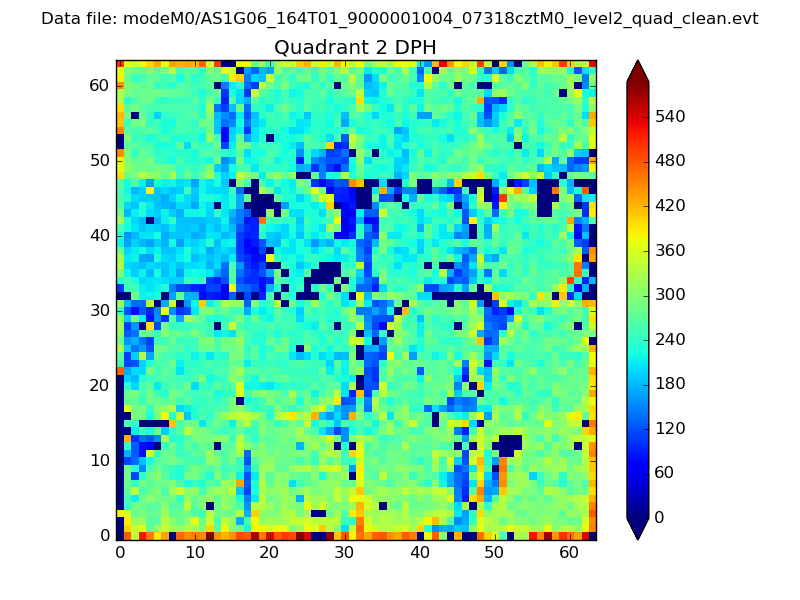
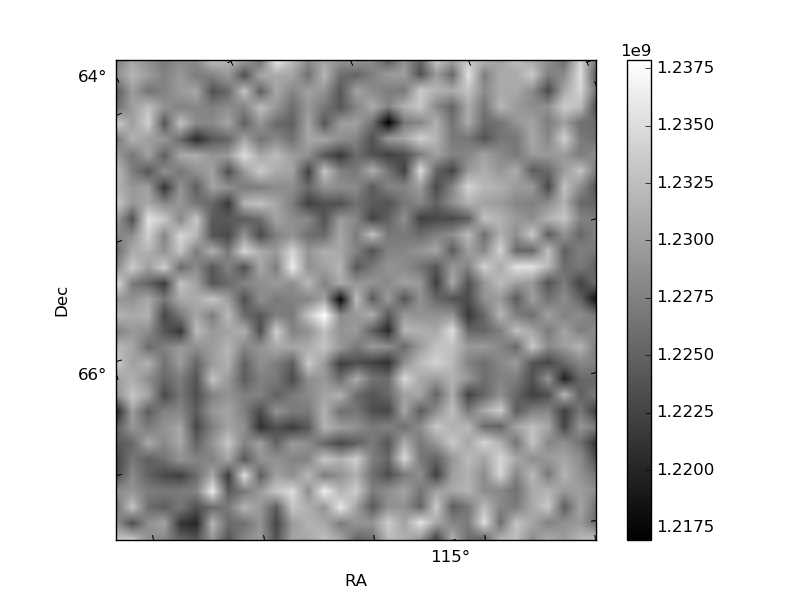
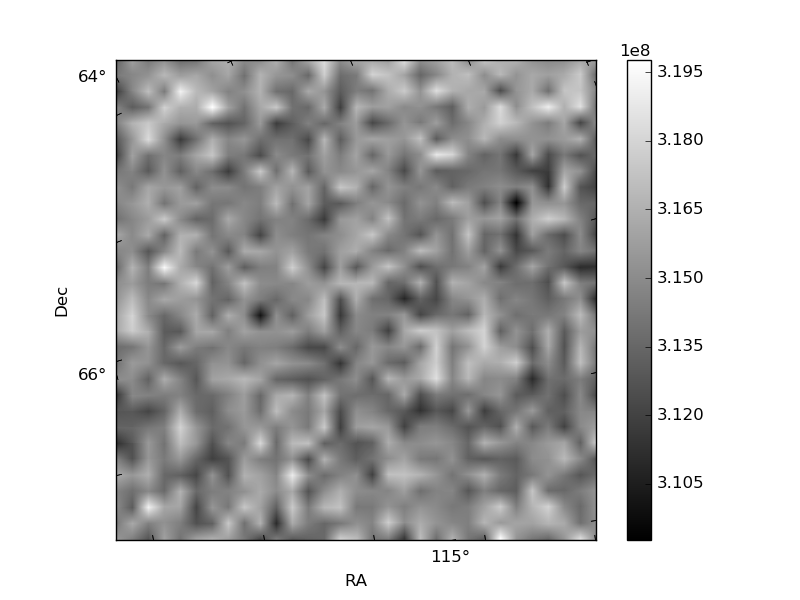
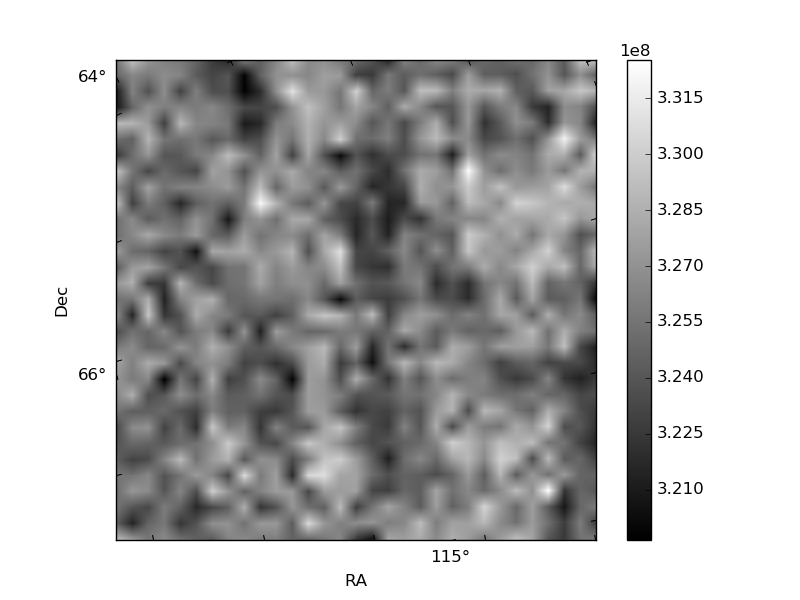
Histogram calculated using DETX and DETY for each event in the final _common_clean file
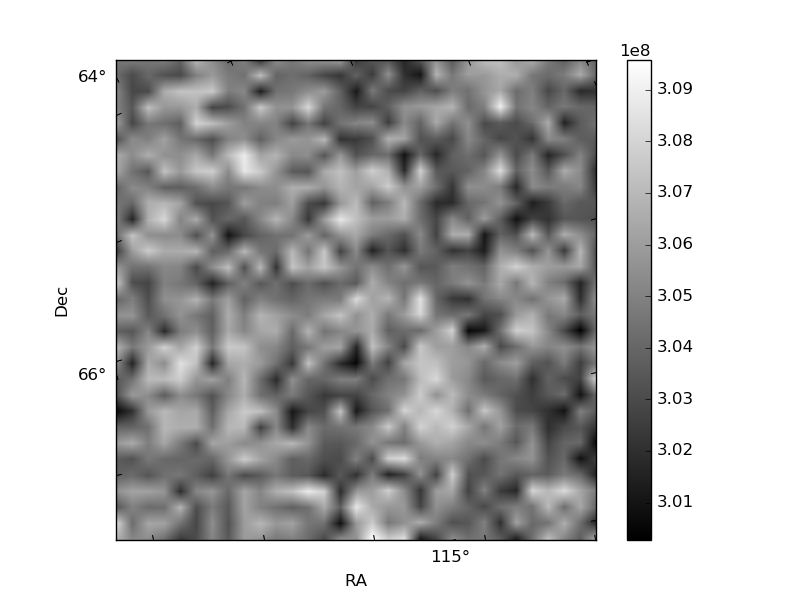
| Quadrant A | 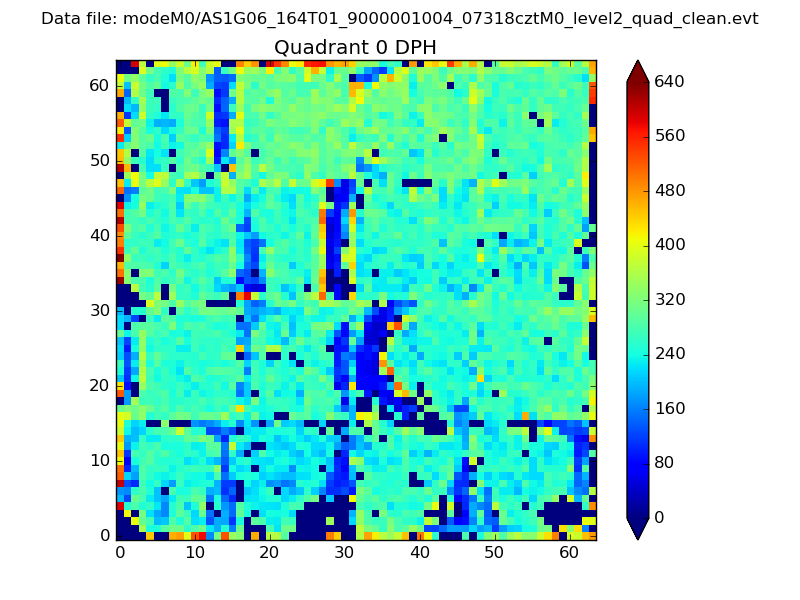 |
 |
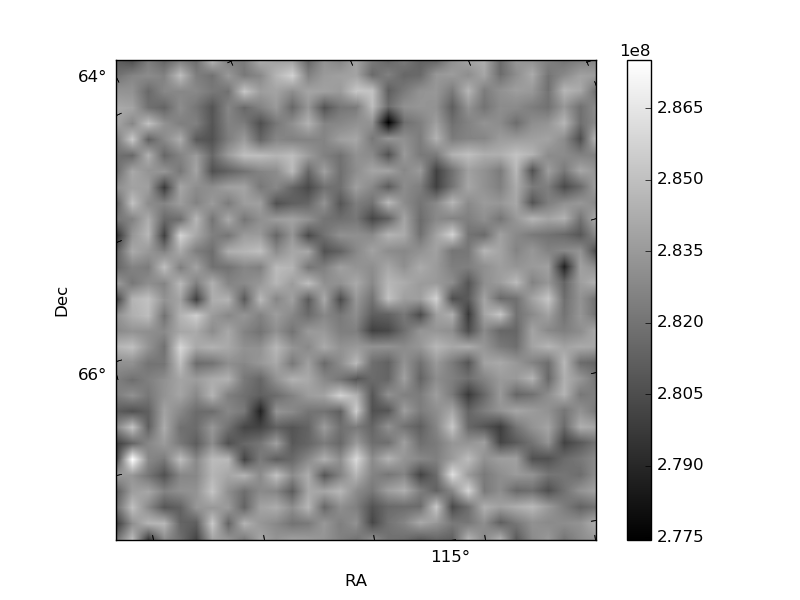
Quadrant B |
|---|---|---|---|
| Quadrant D | 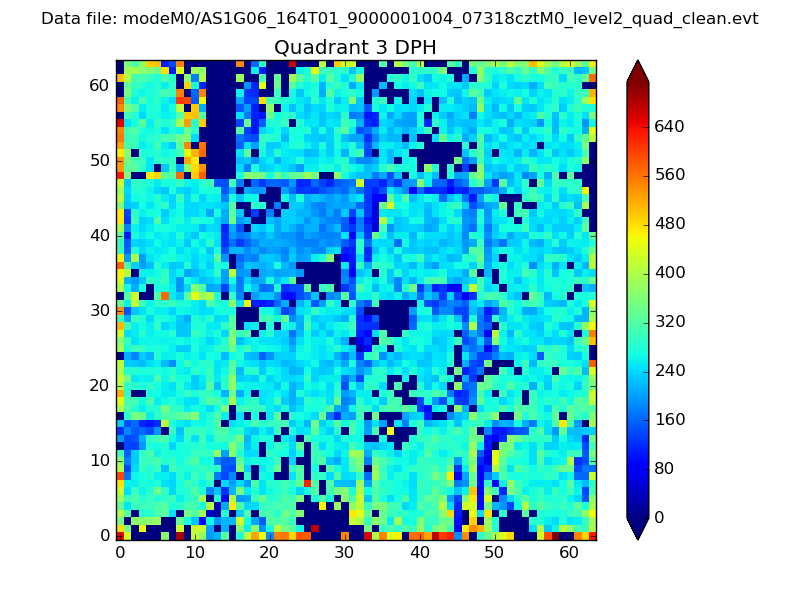 |
 |
Quadrant C |
| Plot type | Count rate plots | Images |
|---|---|---|
| Comparison with Poisson distribution Blue bars denote a histogram of data divided into 1 sec bins. Red curve is a Poisson curve with rate = median count rate of data. |
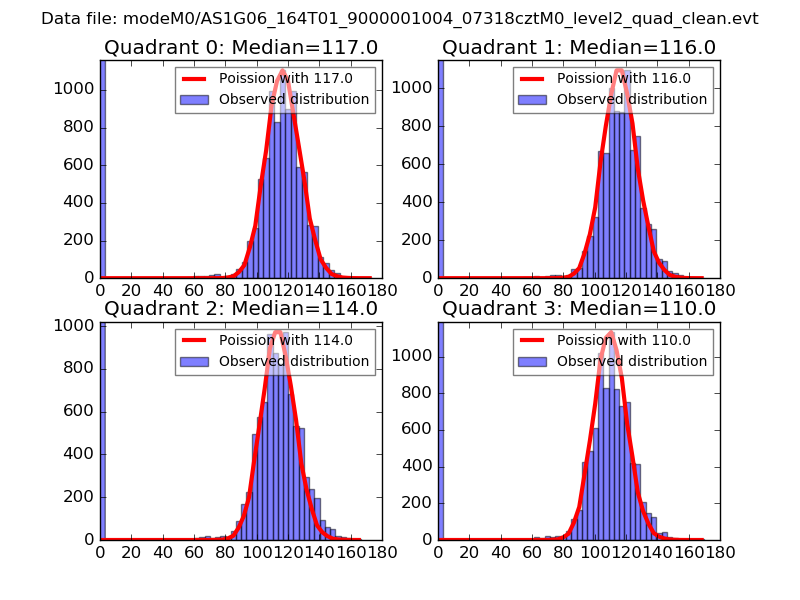 |
 |
| Quadrant-wise count rates Data is divided into 100 sec bins |
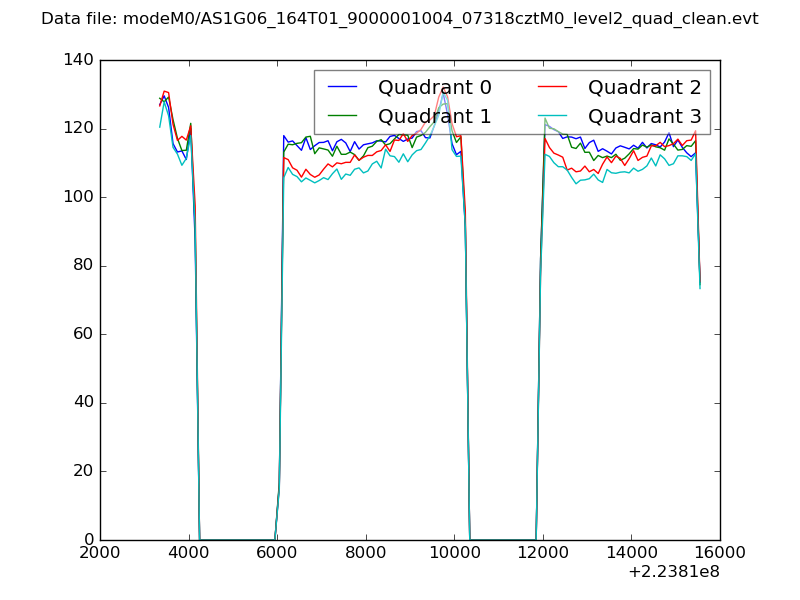 |
|
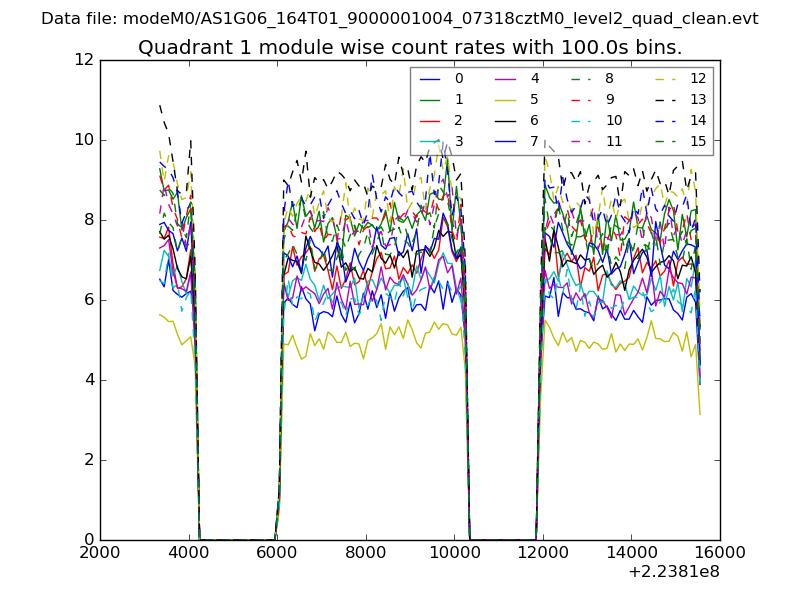
| Module-wise count rates for Quadrant A Data is divided into 100 sec bins |
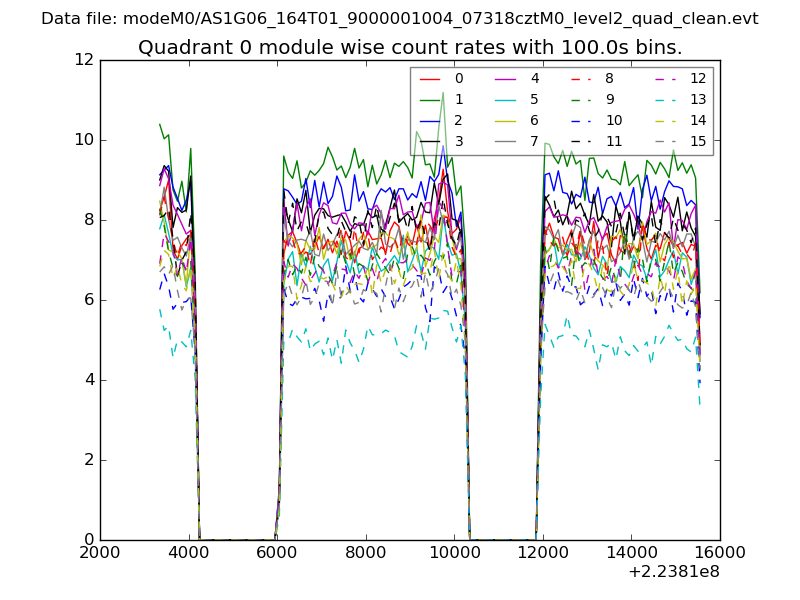 |
 |
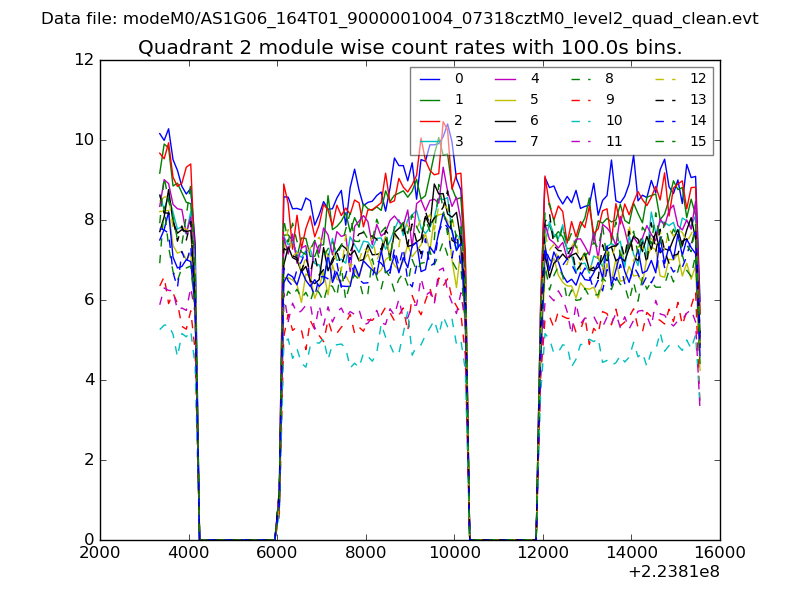
| Module-wise count rates for Quadrant B Data is divided into 100 sec bins |
 |
 |
| Module-wise count rates for Quadrant C Data is divided into 100 sec bins |
 |
 |
| Module-wise count rates for Quadrant D Data is divided into 100 sec bins |
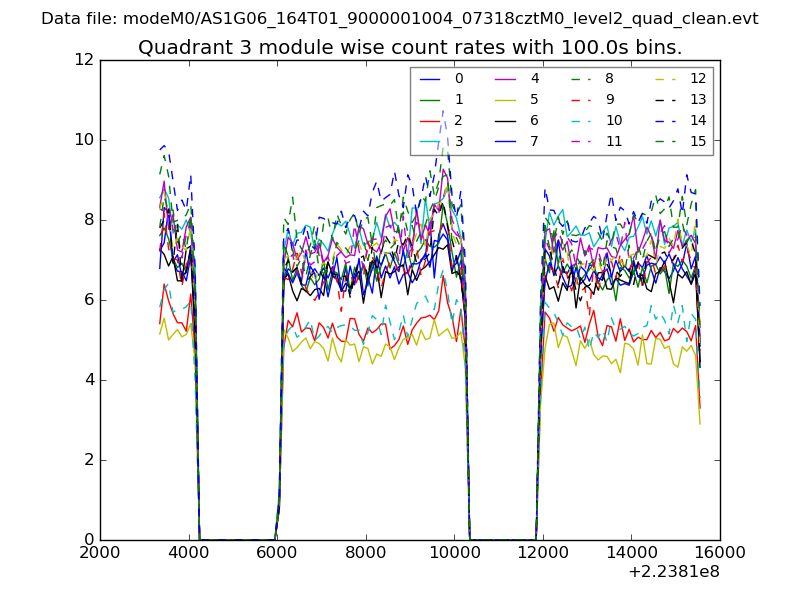 |
 |
| Parameter | Plot |
|---|---|
| CZT HV Monitor | 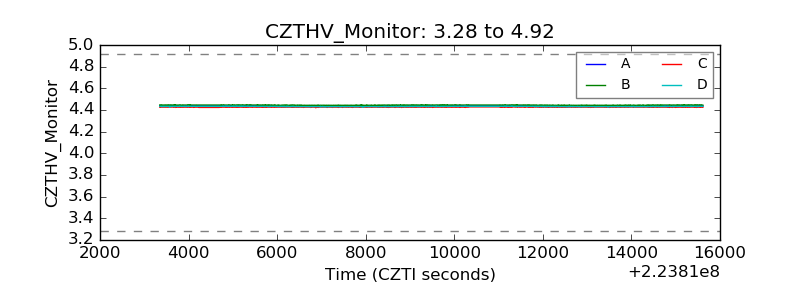 |
| D_VDD | 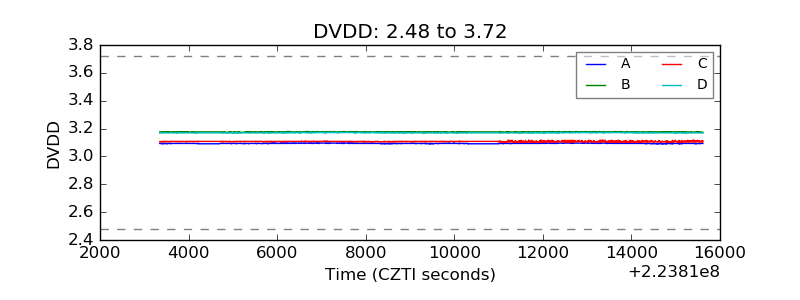 |
| Temperature 1 | 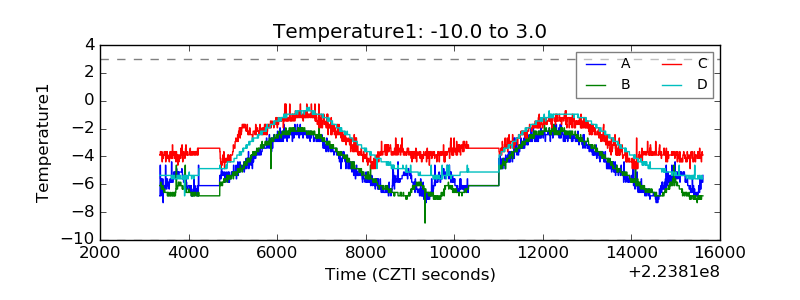 |
| Veto HV Monitor | 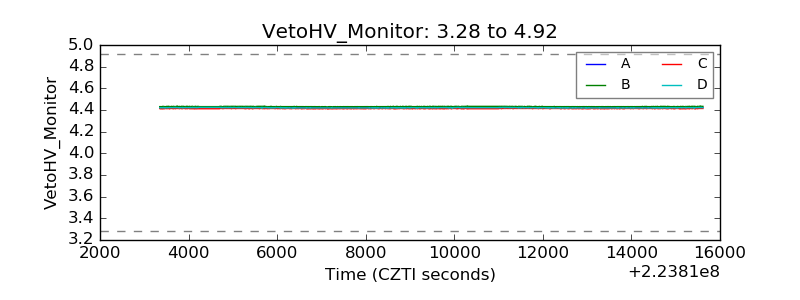 |
| Veto LLD | 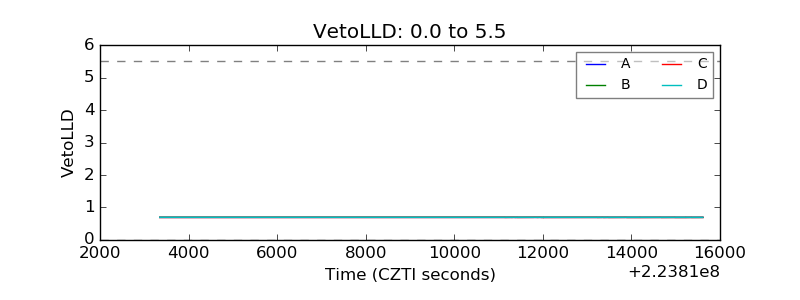 |
| Alpha Counter | 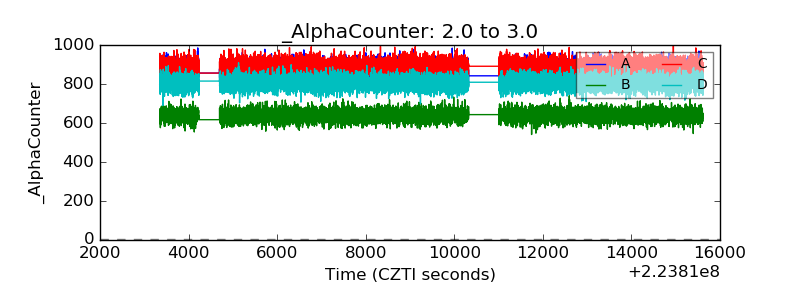 |
| _CPM_Rate | 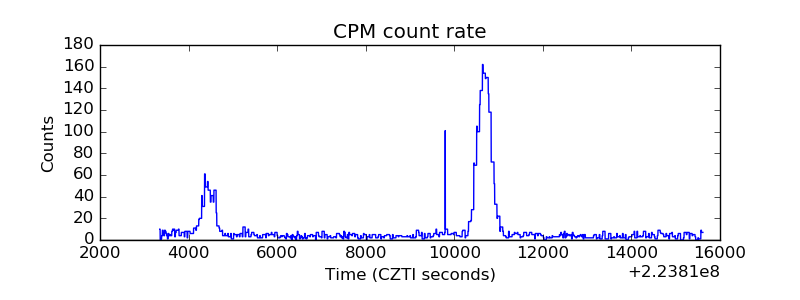 |
| CZT Counter | 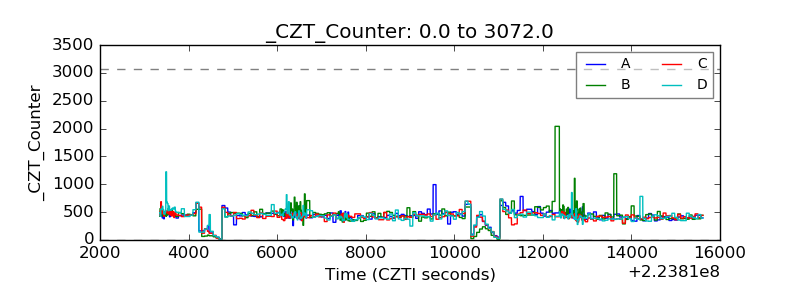 |
| +2.5 Volts monitor |  |
| +5 Volts monitor |  |
| _ROLL_ROT | 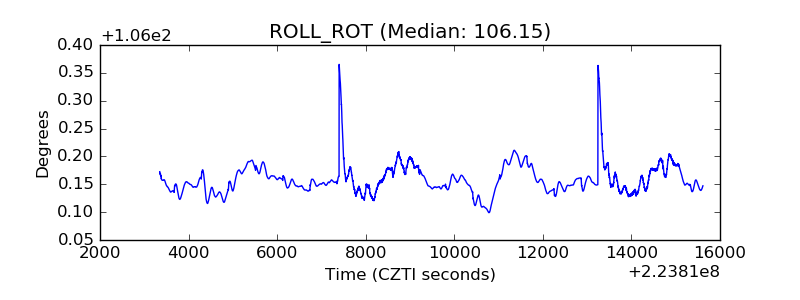 |
| _Roll_DEC | 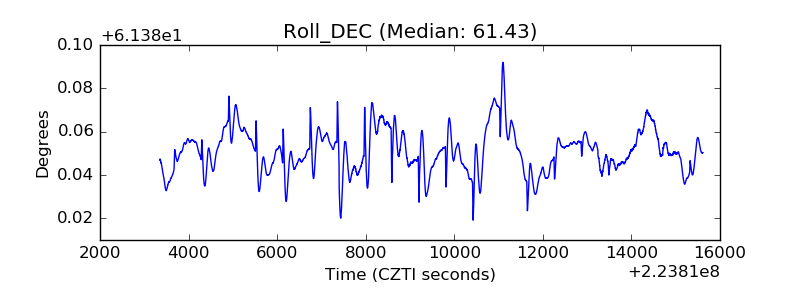 |
| _Roll_RA | 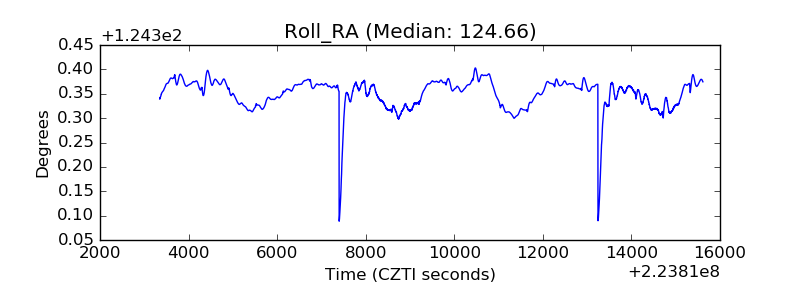 |
| Veto Counter | 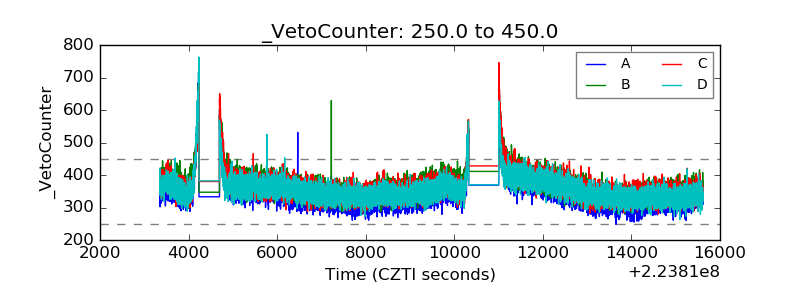 |