| Param | Original file | Final file |
|---|---|---|
| Filename | modeM0/AS1G06_164T01_9000001004_07322cztM0_level2.evt | modeM0/AS1G06_164T01_9000001004_07322cztM0_level2_quad_clean.evt |
| Size (bytes) | 251,772,480 | 40,118,400 |
| Size | 240.1 MB | 38.3 MB |
| Events in quadrant A | 1,943,808 | 245,618 |
| Events in quadrant B | 1,712,093 | 246,339 |
| Events in quadrant C | 1,517,043 | 235,971 |
| Events in quadrant D | 2,199,957 | 225,728 |
| Mode SS | |||
|---|---|---|---|
| Quadrant | BADHDUFLAG | Total packets | Discarded packets |
| A | 0 | 74 | 0 |
| B | 0 | 74 | 0 |
| C | 0 | 74 | 0 |
| D | 0 | 74 | 0 |
| Mode M0 | |||
|---|---|---|---|
| Quadrant | BADHDUFLAG | Total packets | Discarded packets |
| A | 0 | 8366 | 1 |
| B | 0 | 7674 | 0 |
| C | 0 | 7374 | 0 |
| D | 0 | 9086 | 0 |
| Quadrant | Total seconds | Saturated seconds | Saturation percentage |
|---|---|---|---|
| A | 3684 | 47 | 1.275787% |
| B | 3684 | 7 | 0.190011% |
| C | 3684 | 0 | 0.000000% |
| D | 3684 | 25 | 0.678610% |
Noise dominated data is calculated using 1-second bins in cleaned event files. If a bin has >2000 counts, and if more than 50% of those come from <1% of pixels, then it is considered to be noise-dominated and hence unusable.
| Quadrant | # 1 sec bins | Bins with >0 counts | Bins with >2000 counts | High rate bins dominated by noise | Noise dominated (total time) | Noise dominated (detector-on time) | Marked lightcurve |
|---|---|---|---|---|---|---|---|
| A | 3684 | 3684 | 31 | 31 | 0.84% | 0.84% | 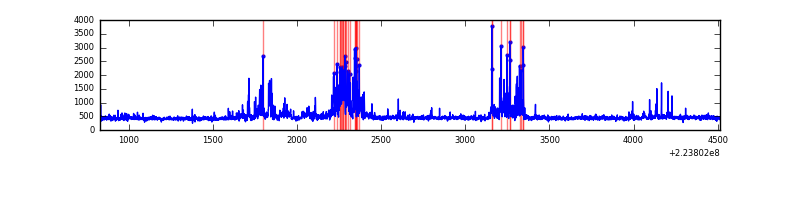 |
| B | 3684 | 3684 | 6 | 6 | 0.16% | 0.16% |  |
| C | 3684 | 3684 | 0 | 0 | 0.00% | 0.00% | 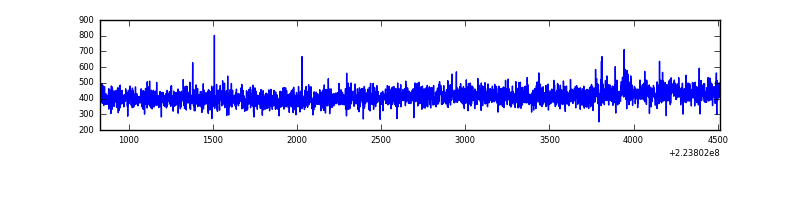 |
| D | 3684 | 3684 | 20 | 20 | 0.54% | 0.54% | 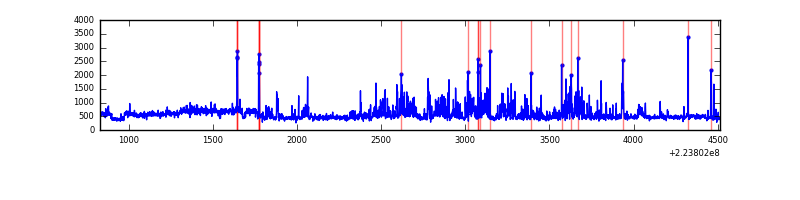 |
Top three noisy pixels from each quadrant. If the there are fewer than three noisy pixels in the level2.evt file, extra rows are filled as -1
| Pixel properties | Quadrant properties | ||||||
|---|---|---|---|---|---|---|---|
| Quadrant | DetID | PixID | Counts | Sigma | Mean | Median | Sigma |
| A | 8 | 15 | 366338 | 4418.25 | 402 | 393 | 82.8 |
| A | 3 | 1 | 13976 | 163.99 | 402 | 393 | 82.8 |
| A | 13 | 248 | 11627 | 135.63 | 402 | 393 | 82.8 |
| B | 0 | 214 | 60927 | 777.13 | 402 | 391 | 77.9 |
| B | 11 | 51 | 60197 | 767.76 | 402 | 391 | 77.9 |
| B | 4 | 81 | 11685 | 144.99 | 402 | 391 | 77.9 |
| C | 13 | 61 | 3004 | 29.09 | 387 | 388 | 89.9 |
| C | 12 | 4 | 2052 | 18.51 | 387 | 388 | 89.9 |
| C | 14 | 205 | 1146 | 8.43 | 387 | 388 | 89.9 |
| D | 2 | 216 | 358583 | 3709.04 | 388 | 375 | 96.6 |
| D | 1 | 20 | 278765 | 2882.57 | 388 | 375 | 96.6 |
| D | 12 | 233 | 39110 | 401.08 | 388 | 375 | 96.6 |
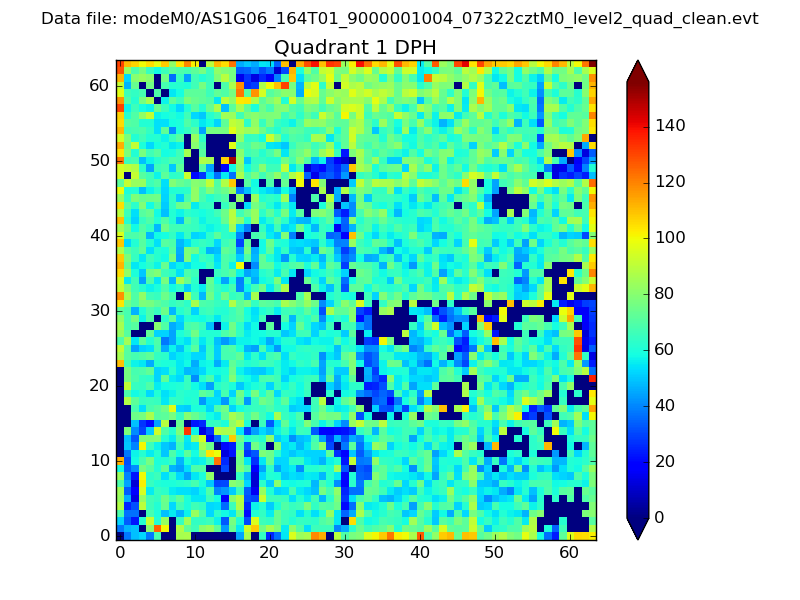
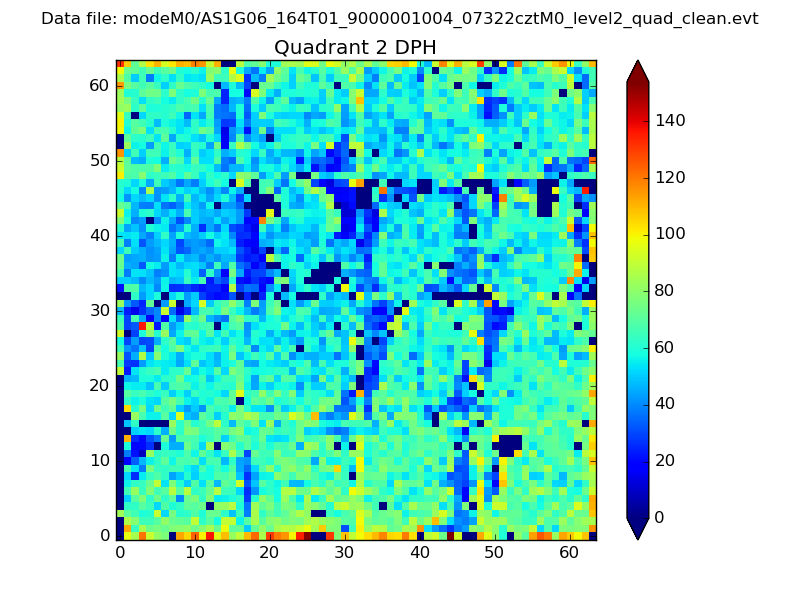
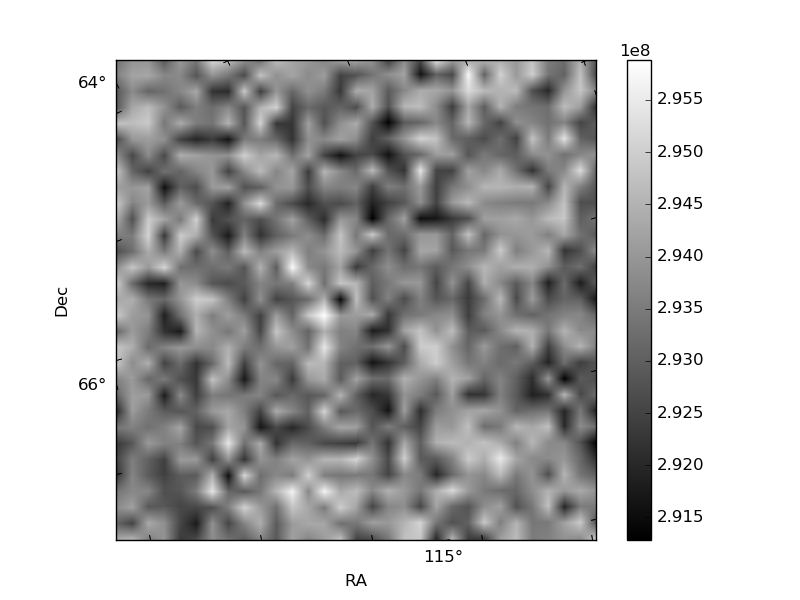
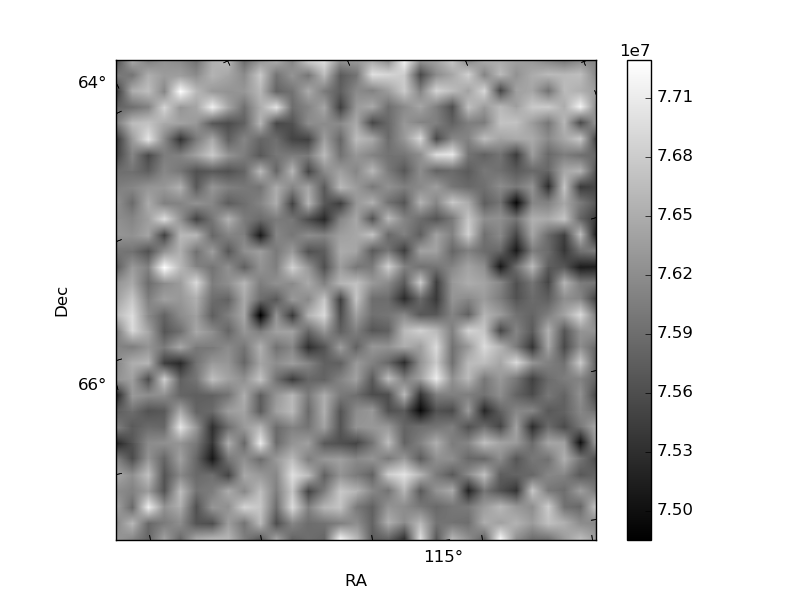
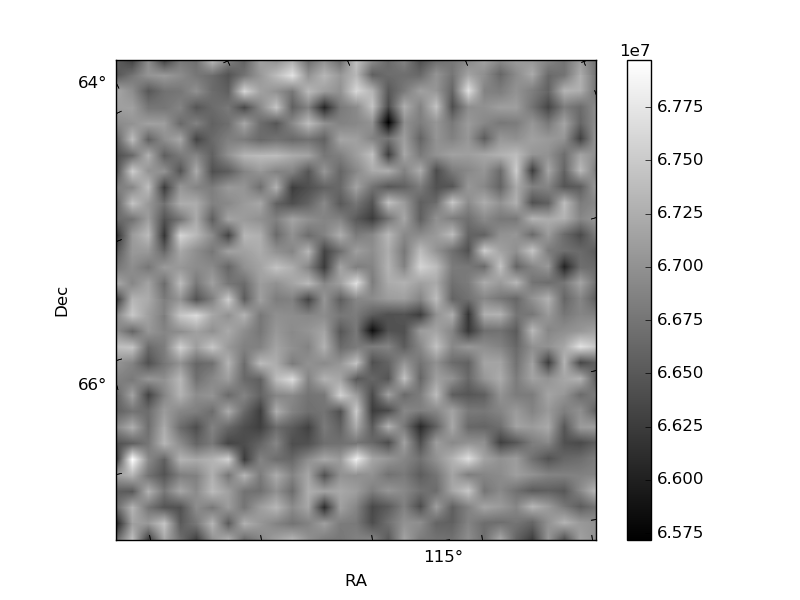
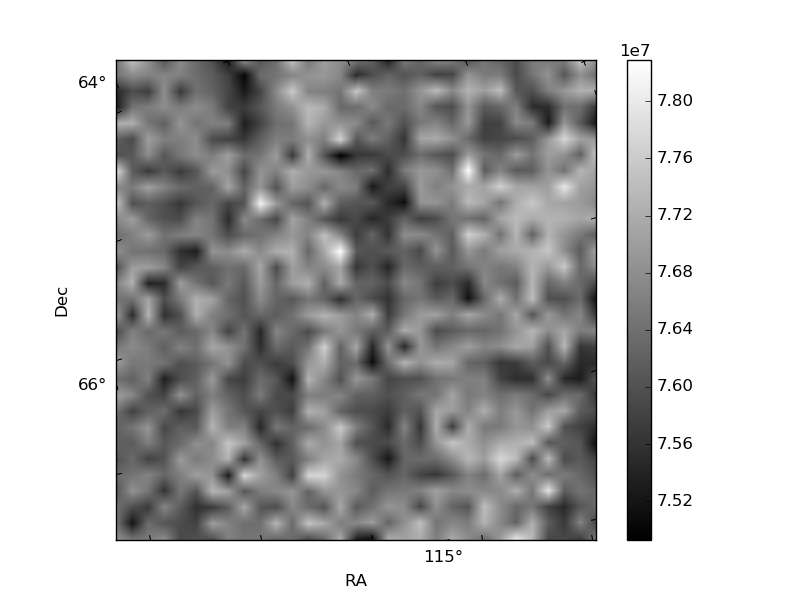
Histogram calculated using DETX and DETY for each event in the final _common_clean file
| Quadrant A | 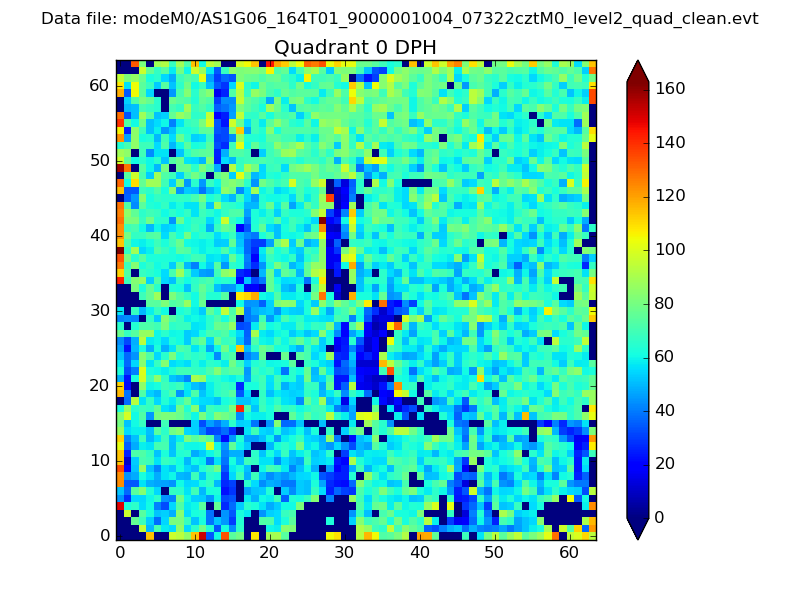 |
 |
Quadrant B |
|---|---|---|---|
| Quadrant D | 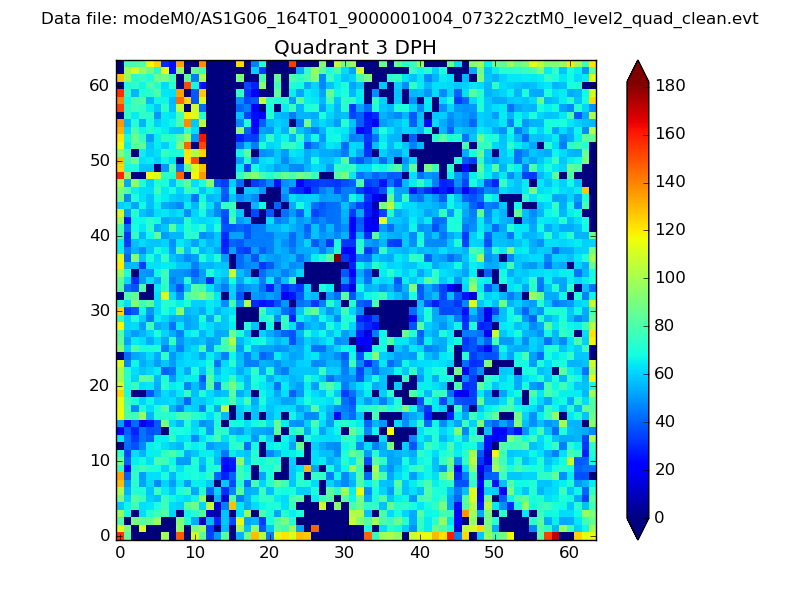 |
 |
Quadrant C |
| Plot type | Count rate plots | Images |
|---|---|---|
| Comparison with Poisson distribution Blue bars denote a histogram of data divided into 1 sec bins. Red curve is a Poisson curve with rate = median count rate of data. |
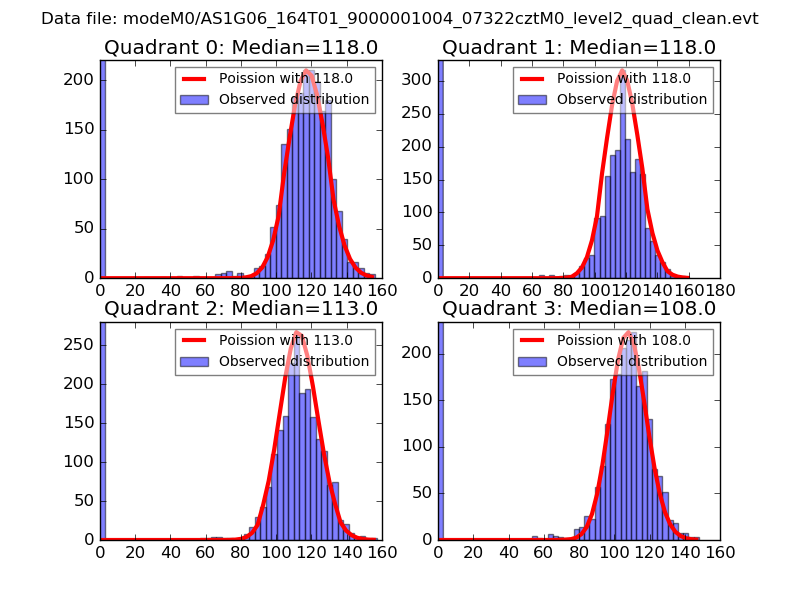 |
 |
| Quadrant-wise count rates Data is divided into 100 sec bins |
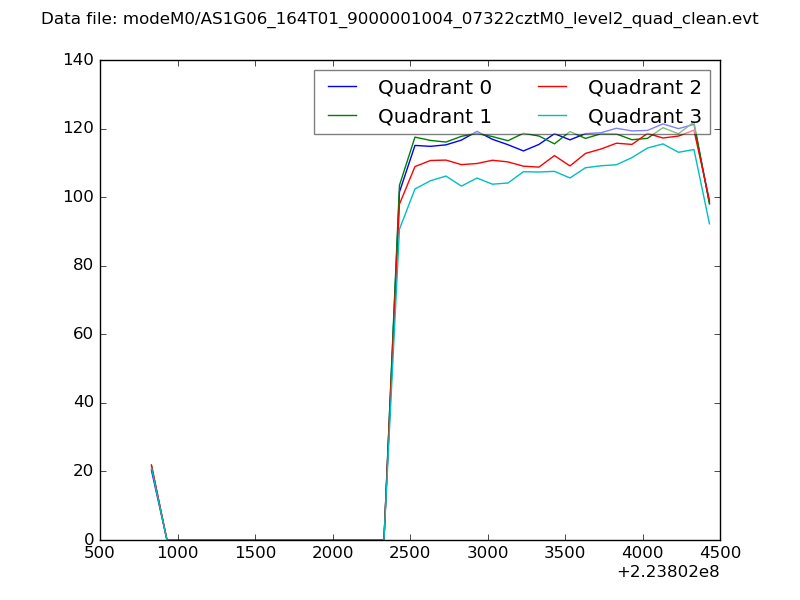 |
|
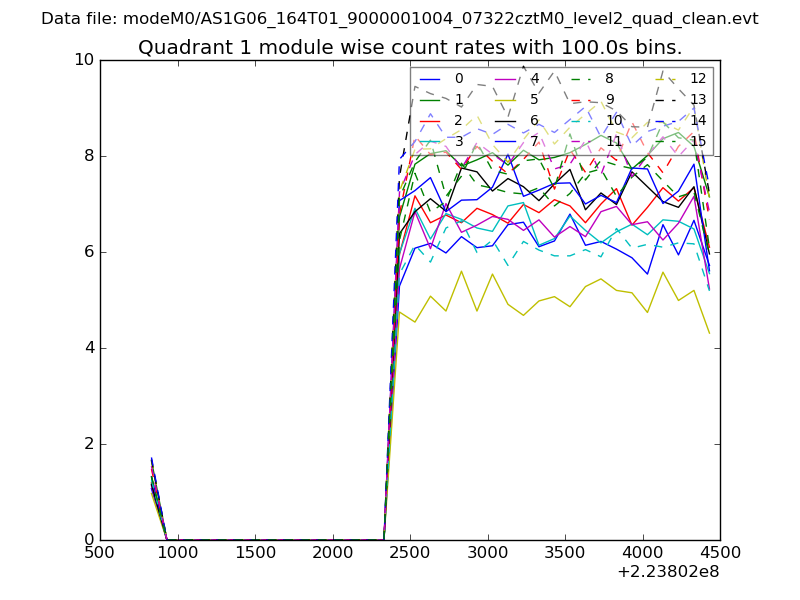
| Module-wise count rates for Quadrant A Data is divided into 100 sec bins |
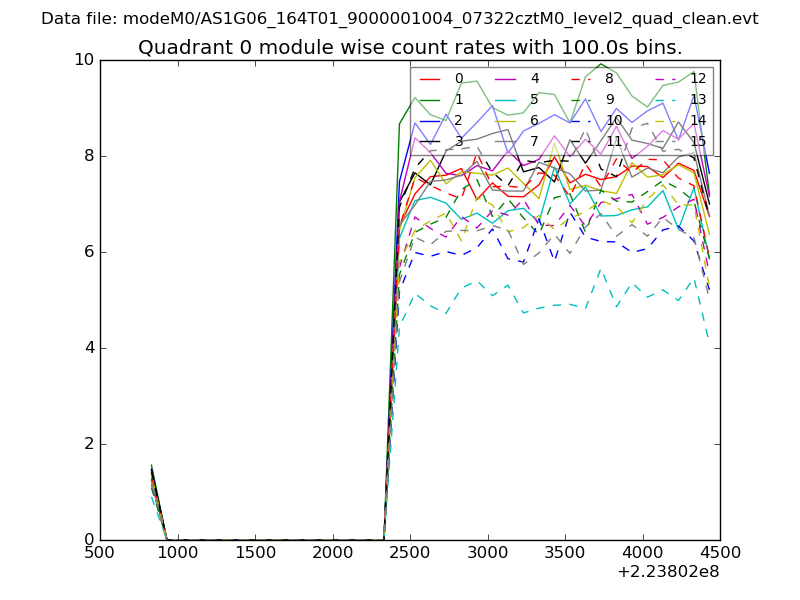 |
 |
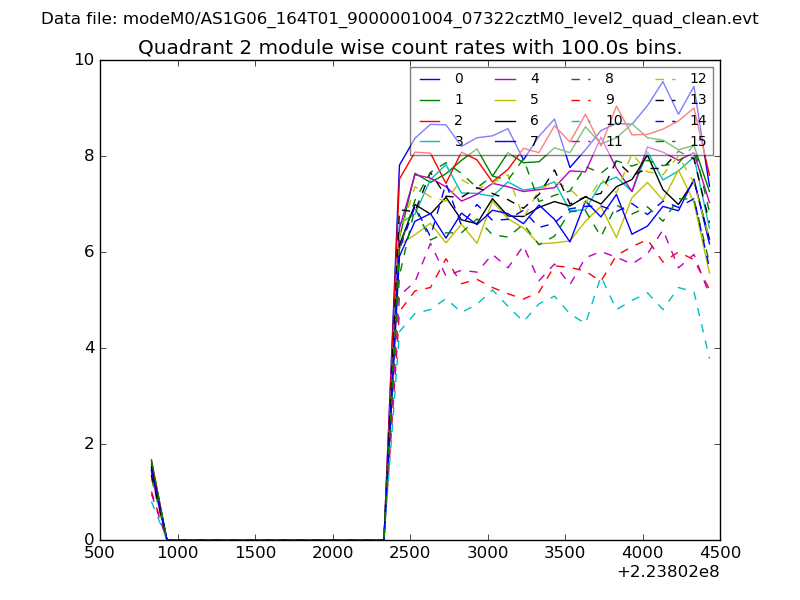
| Module-wise count rates for Quadrant B Data is divided into 100 sec bins |
 |
 |
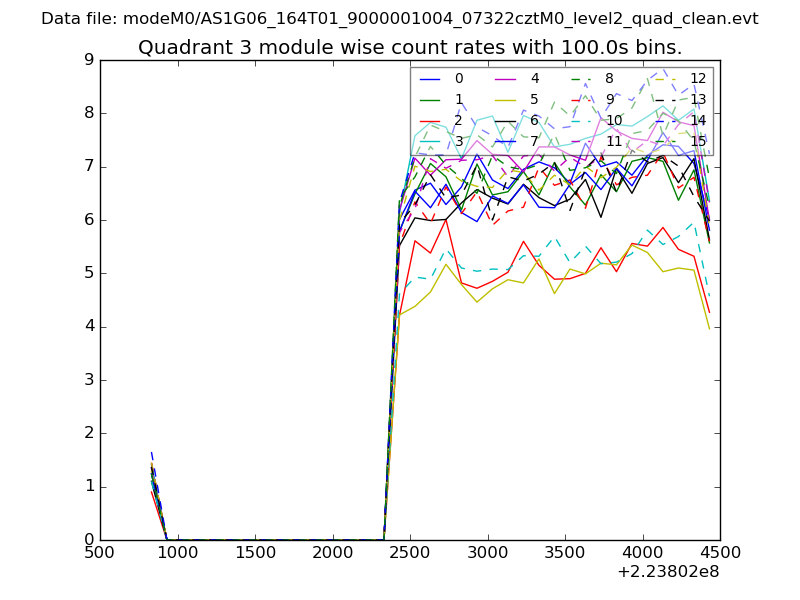
| Module-wise count rates for Quadrant C Data is divided into 100 sec bins |
 |
 |
| Module-wise count rates for Quadrant D Data is divided into 100 sec bins |
 |
 |
| Parameter | Plot |
|---|---|
| CZT HV Monitor | 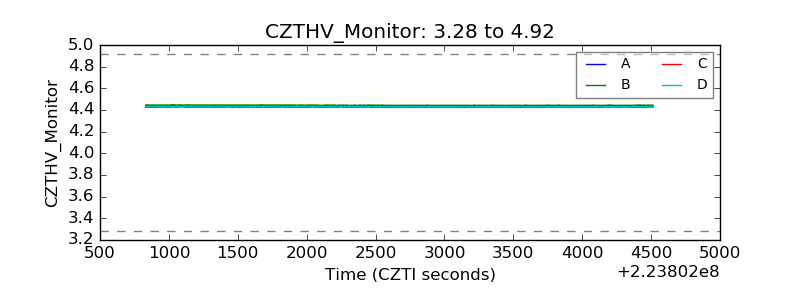 |
| D_VDD |  |
| Temperature 1 | 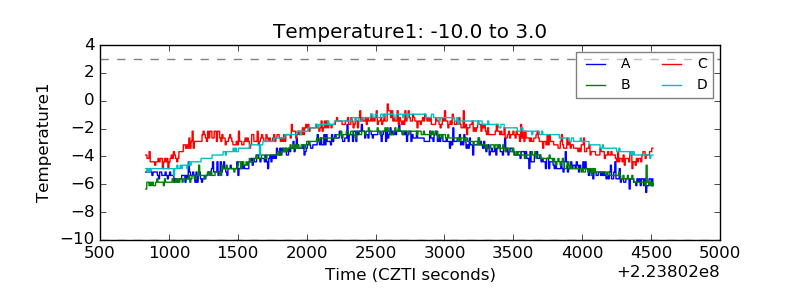 |
| Veto HV Monitor |  |
| Veto LLD | 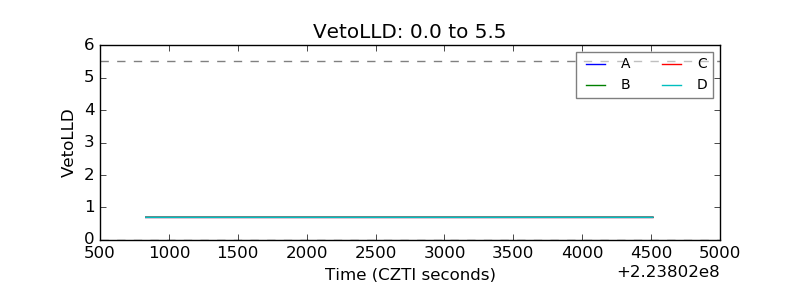 |
| Alpha Counter | 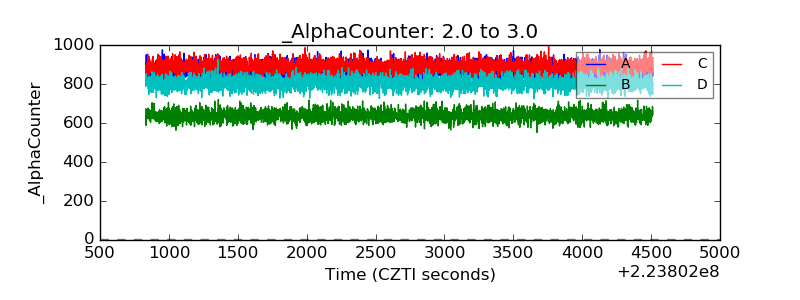 |
| _CPM_Rate |  |
| CZT Counter | 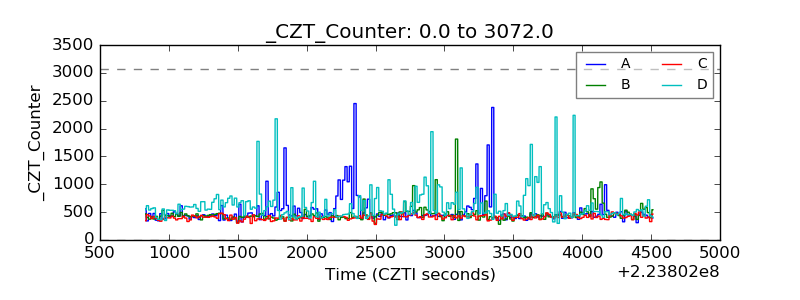 |
| +2.5 Volts monitor |  |
| +5 Volts monitor |  |
| _ROLL_ROT | 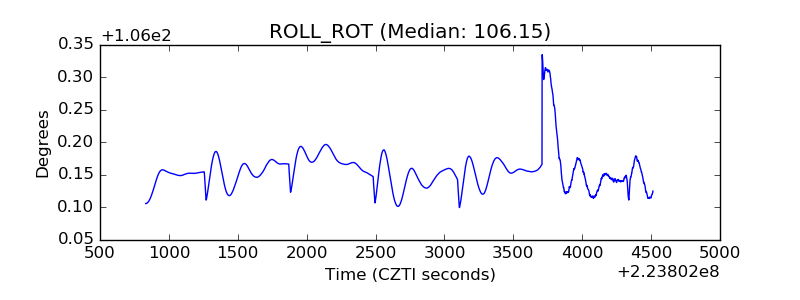 |
| _Roll_DEC | 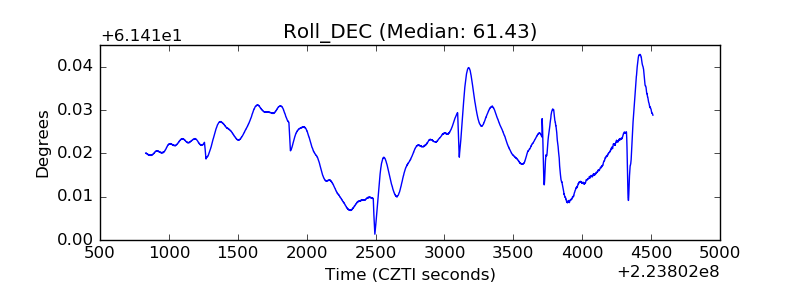 |
| _Roll_RA | 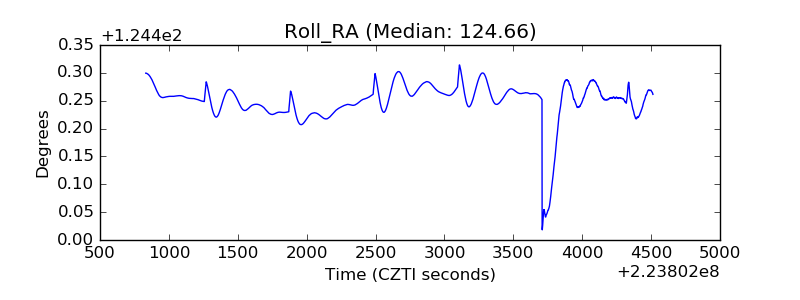 |
| Veto Counter | 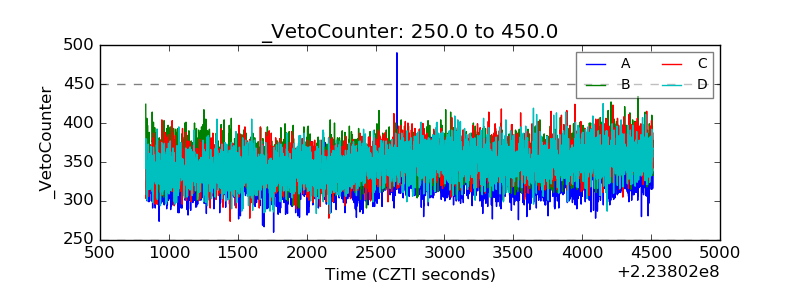 |