| Param | Original file | Final file |
|---|---|---|
| Filename | modeM0/AS1G06_164T01_9000001004_07323cztM0_level2.evt | modeM0/AS1G06_164T01_9000001004_07323cztM0_level2_quad_clean.evt |
| Size (bytes) | 1,372,475,520 | 288,048,960 |
| Size | 1.3 GB | 274.7 MB |
| Events in quadrant A | 10,297,858 | 1,842,958 |
| Events in quadrant B | 10,068,812 | 1,851,479 |
| Events in quadrant C | 9,203,646 | 1,815,340 |
| Events in quadrant D | 10,548,288 | 1,742,464 |
| Mode SS | |||
|---|---|---|---|
| Quadrant | BADHDUFLAG | Total packets | Discarded packets |
| A | 0 | 434 | 0 |
| B | 0 | 434 | 0 |
| C | 0 | 434 | 0 |
| D | 0 | 434 | 0 |
| Mode M9 | |||
|---|---|---|---|
| Quadrant | BADHDUFLAG | Total packets | Discarded packets |
| A | 0 | 14 | 0 |
| B | 0 | 14 | 0 |
| C | 0 | 14 | 0 |
| D | 0 | 14 | 0 |
| Mode M0 | |||
|---|---|---|---|
| Quadrant | BADHDUFLAG | Total packets | Discarded packets |
| A | 0 | 45642 | 4 |
| B | 0 | 44423 | 4 |
| C | 0 | 43168 | 4 |
| D | 0 | 46566 | 4 |
| Quadrant | Total seconds | Saturated seconds | Saturation percentage |
|---|---|---|---|
| A | 21381 | 476 | 2.226276% |
| B | 21381 | 290 | 1.356344% |
| C | 21381 | 183 | 0.855900% |
| D | 21381 | 262 | 1.225387% |
Noise dominated data is calculated using 1-second bins in cleaned event files. If a bin has >2000 counts, and if more than 50% of those come from <1% of pixels, then it is considered to be noise-dominated and hence unusable.
| Quadrant | # 1 sec bins | Bins with >0 counts | Bins with >2000 counts | High rate bins dominated by noise | Noise dominated (total time) | Noise dominated (detector-on time) | Marked lightcurve |
|---|---|---|---|---|---|---|---|
| A | 22786 | 21382 | 107 | 107 | 0.47% | 0.50% | 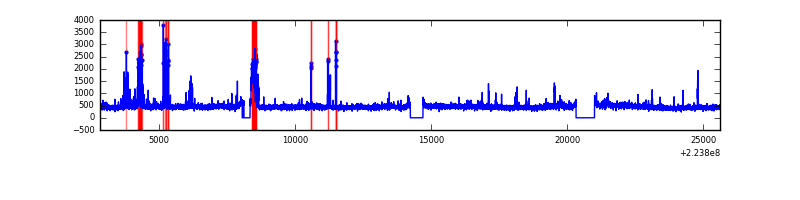 |
| B | 22786 | 21383 | 17 | 17 | 0.07% | 0.08% | 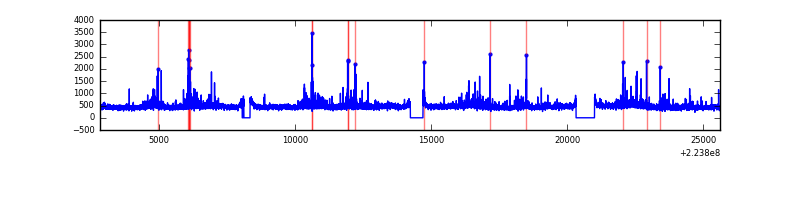 |
| C | 22786 | 21383 | 0 | 0 | 0.00% | 0.00% | 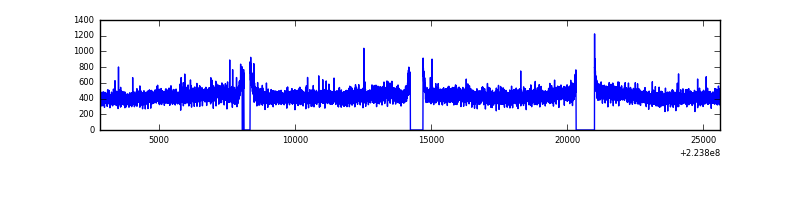 |
| D | 22786 | 21383 | 55 | 55 | 0.24% | 0.26% |  |
Top three noisy pixels from each quadrant. If the there are fewer than three noisy pixels in the level2.evt file, extra rows are filled as -1
| Pixel properties | Quadrant properties | ||||||
|---|---|---|---|---|---|---|---|
| Quadrant | DetID | PixID | Counts | Sigma | Mean | Median | Sigma |
| A | 8 | 15 | 476870 | 985.68 | 2389 | 2334 | 481.4 |
| A | 15 | 234 | 447833 | 925.37 | 2389 | 2334 | 481.4 |
| A | 13 | 248 | 83641 | 168.89 | 2389 | 2334 | 481.4 |
| B | 0 | 214 | 298462 | 652.65 | 2411 | 2352 | 453.7 |
| B | 11 | 51 | 285544 | 624.18 | 2411 | 2352 | 453.7 |
| B | 4 | 81 | 80546 | 172.35 | 2411 | 2352 | 453.7 |
| C | 9 | 68 | 63289 | 113.34 | 2335 | 2342 | 537.8 |
| C | 13 | 61 | 17935 | 29.0 | 2335 | 2342 | 537.8 |
| C | 8 | 128 | 14344 | 22.32 | 2335 | 2342 | 537.8 |
| D | 2 | 216 | 696758 | 1236.3 | 2321 | 2246 | 561.8 |
| D | 1 | 20 | 677558 | 1202.12 | 2321 | 2246 | 561.8 |
| D | 12 | 233 | 145511 | 255.02 | 2321 | 2246 | 561.8 |
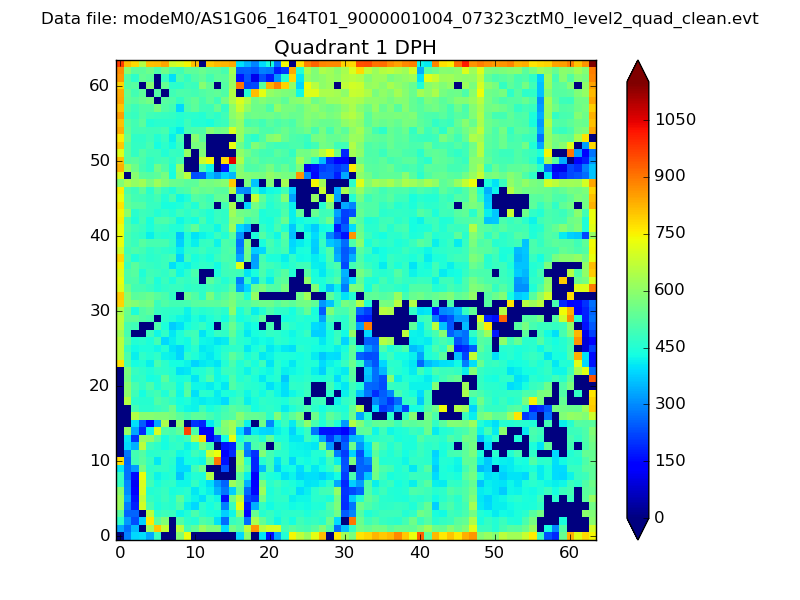
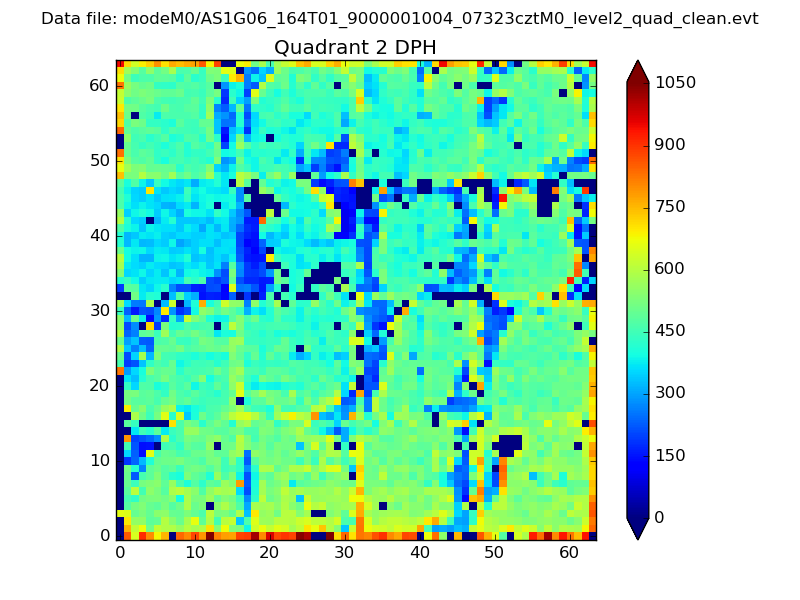
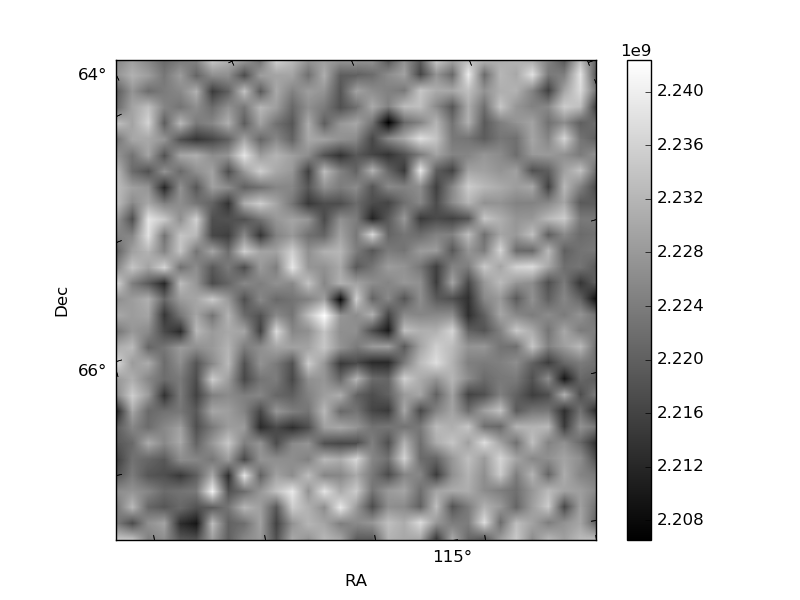
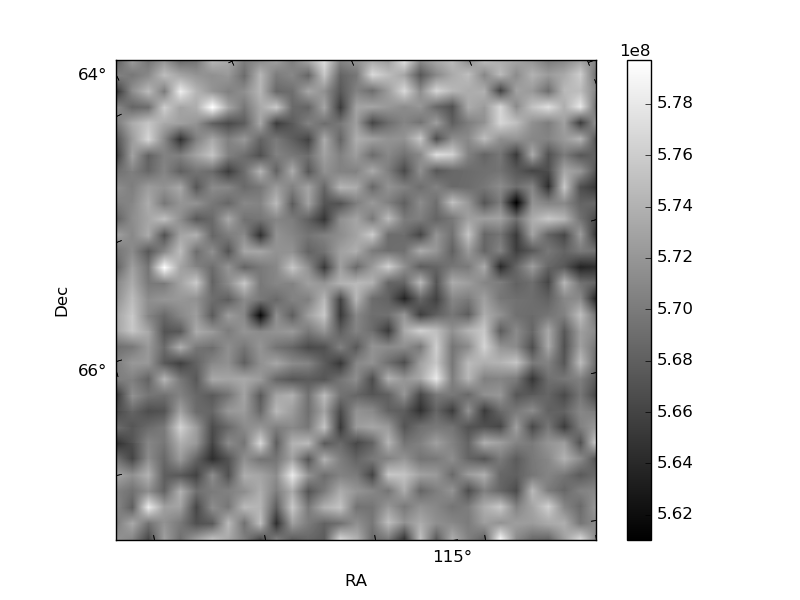
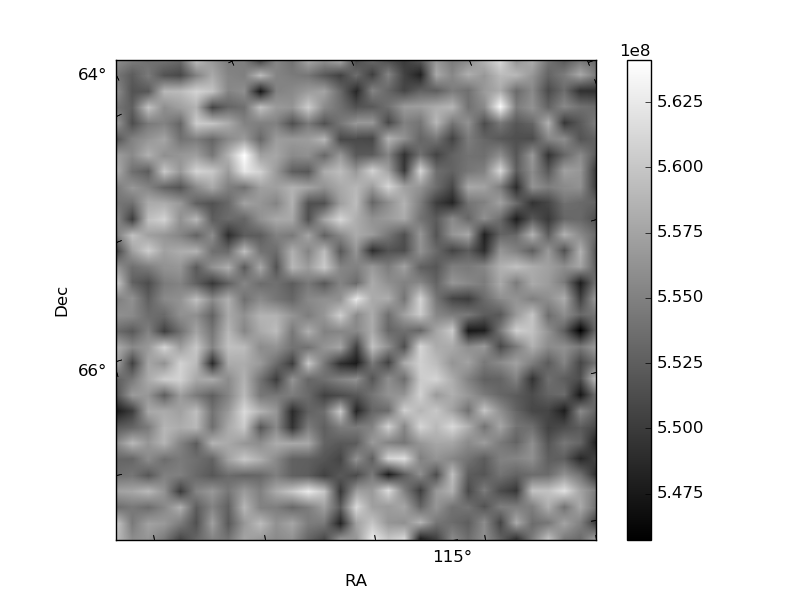
Histogram calculated using DETX and DETY for each event in the final _common_clean file
| Quadrant A | 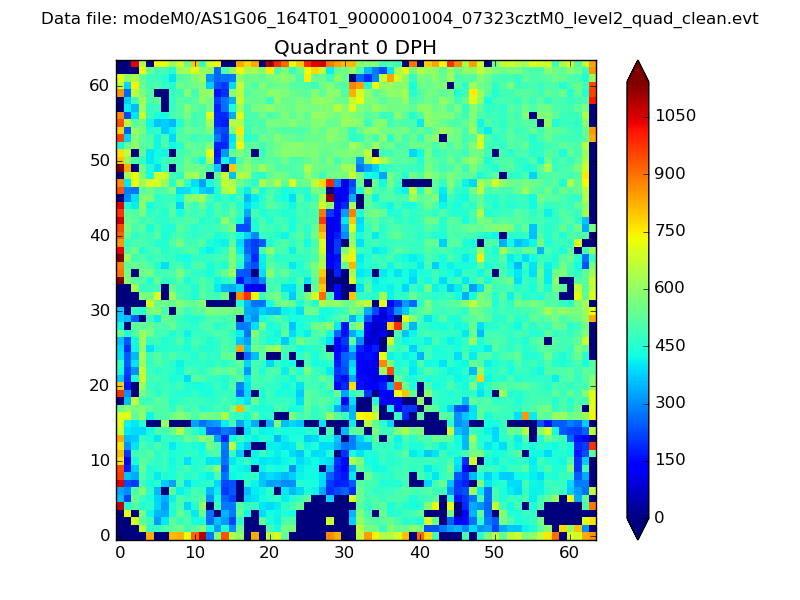 |
 |
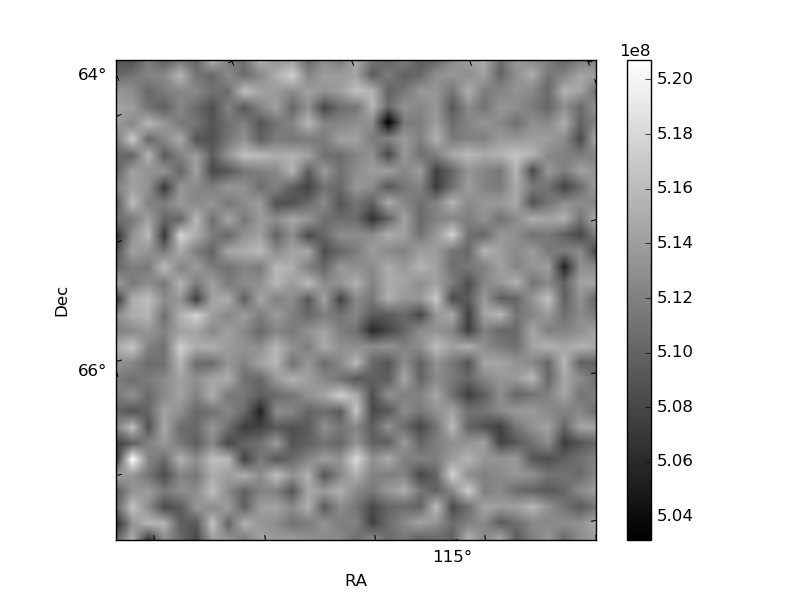
Quadrant B |
|---|---|---|---|
| Quadrant D | 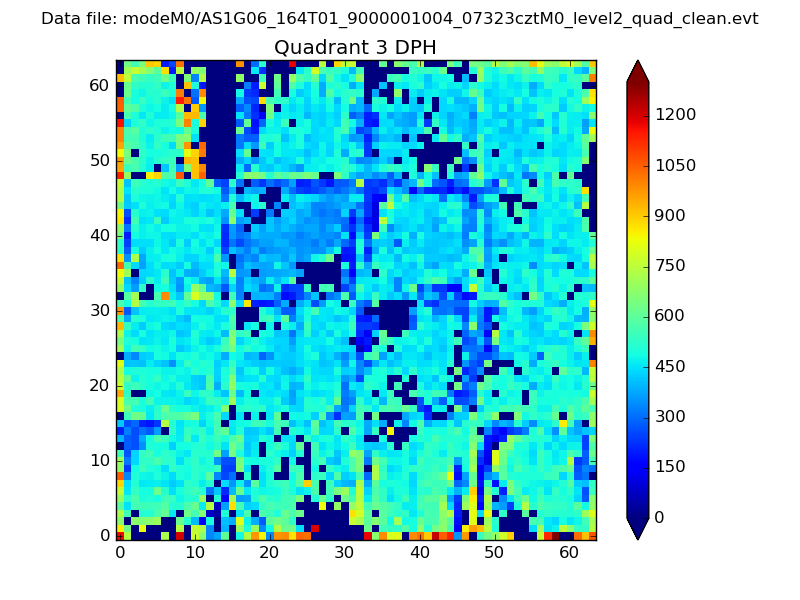 |
 |
Quadrant C |
| Plot type | Count rate plots | Images |
|---|---|---|
| Comparison with Poisson distribution Blue bars denote a histogram of data divided into 1 sec bins. Red curve is a Poisson curve with rate = median count rate of data. |
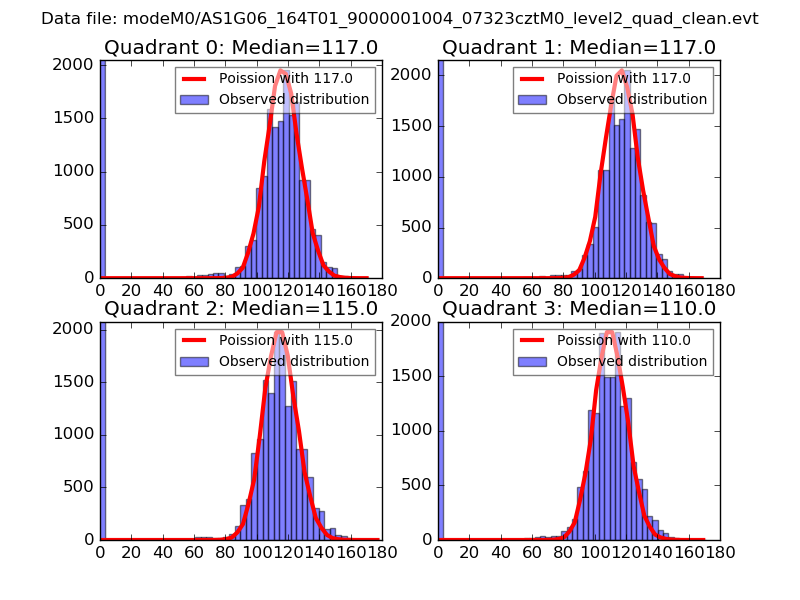 |
 |
| Quadrant-wise count rates Data is divided into 100 sec bins |
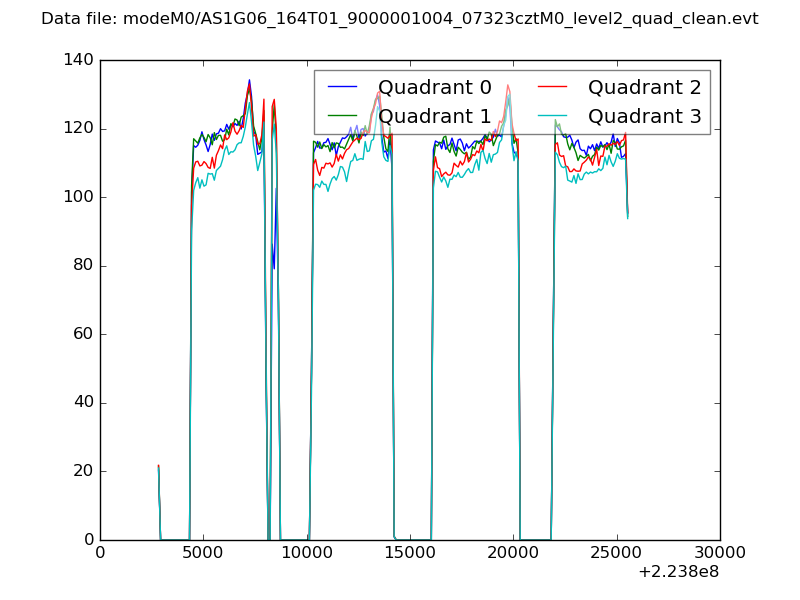 |
|
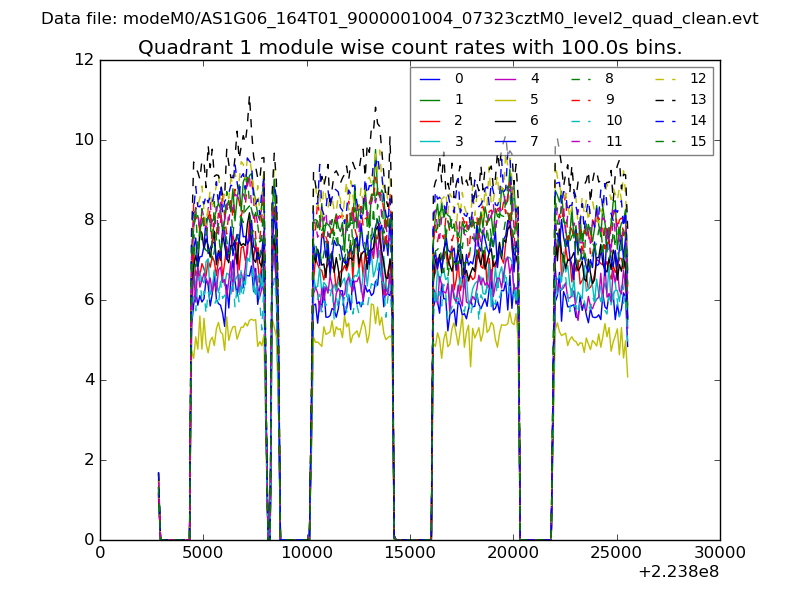
| Module-wise count rates for Quadrant A Data is divided into 100 sec bins |
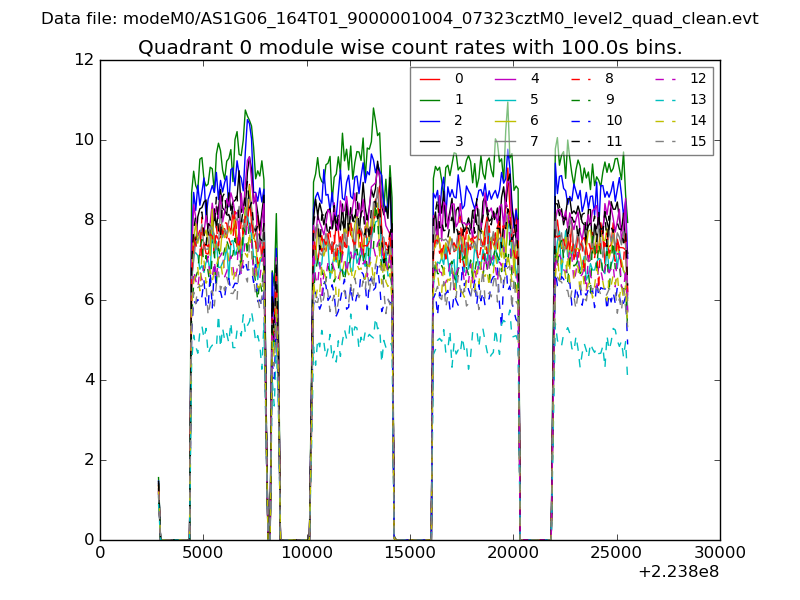 |
 |
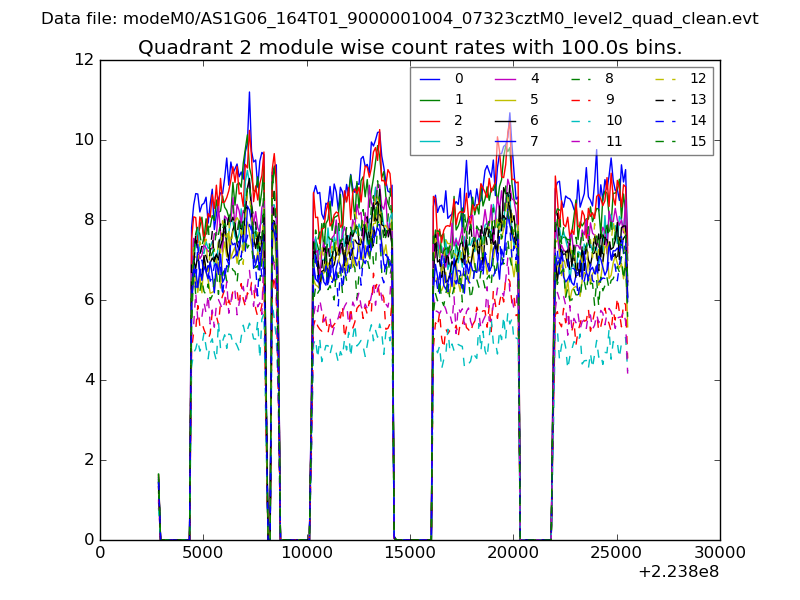
| Module-wise count rates for Quadrant B Data is divided into 100 sec bins |
 |
 |
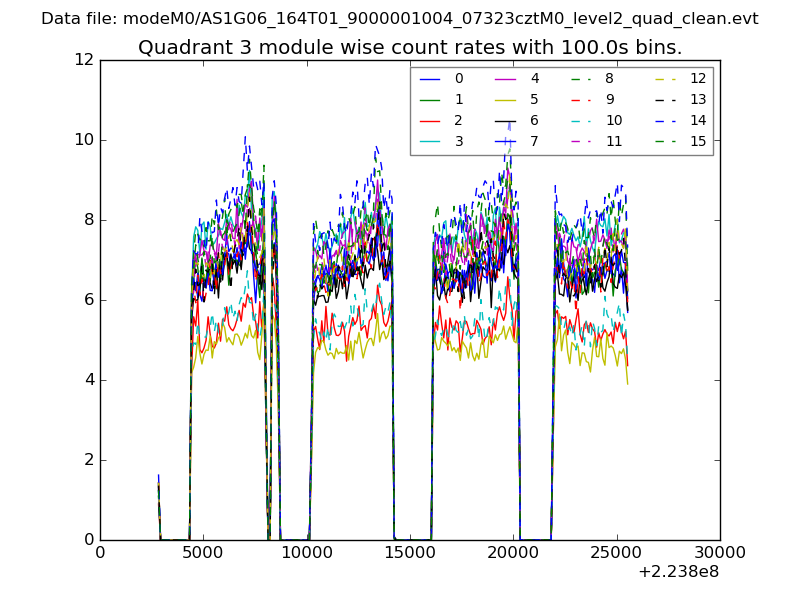
| Module-wise count rates for Quadrant C Data is divided into 100 sec bins |
 |
 |
| Module-wise count rates for Quadrant D Data is divided into 100 sec bins |
 |
 |
| Parameter | Plot |
|---|---|
| CZT HV Monitor | 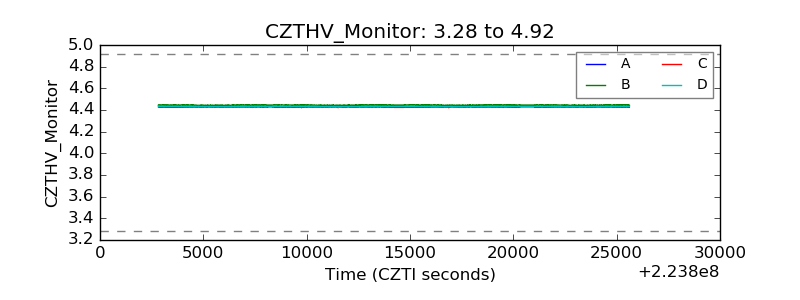 |
| D_VDD | 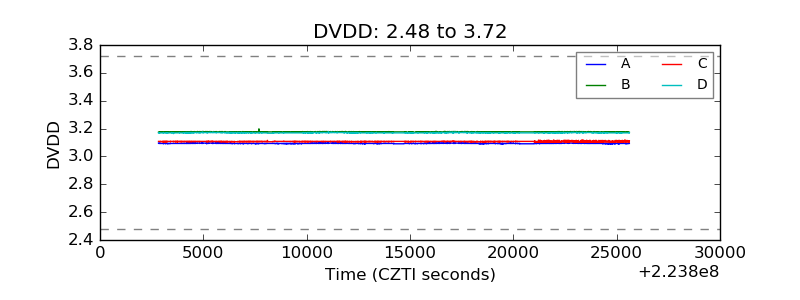 |
| Temperature 1 | 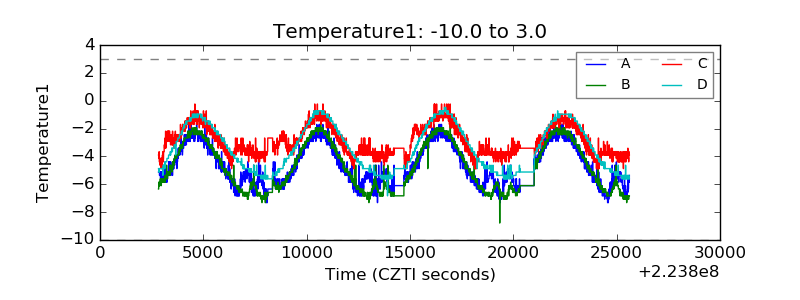 |
| Veto HV Monitor |  |
| Veto LLD | 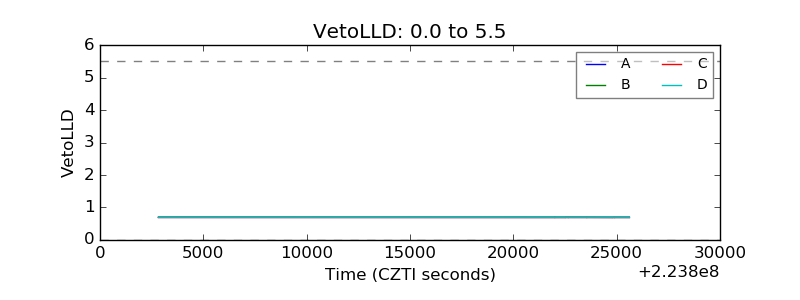 |
| Alpha Counter | 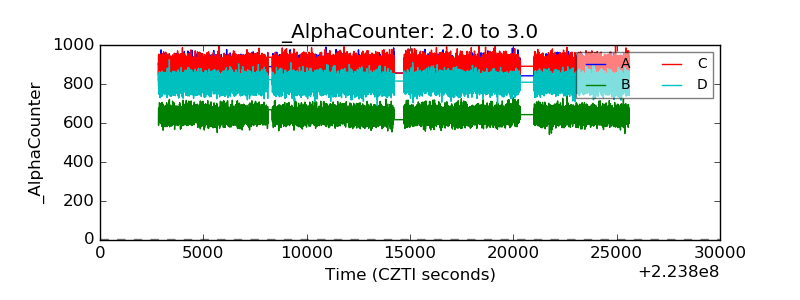 |
| _CPM_Rate | 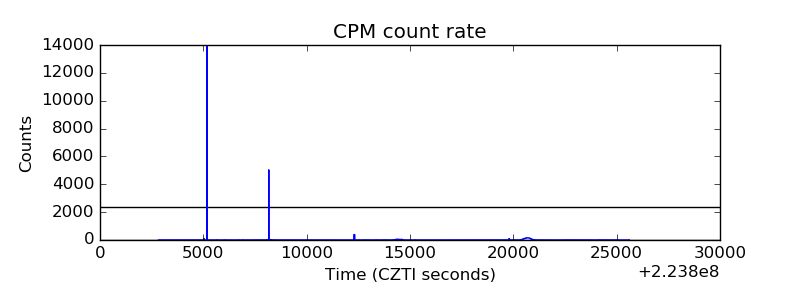 |
| CZT Counter | 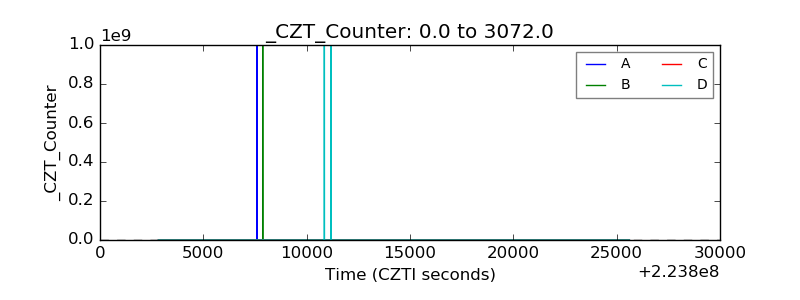 |
| +2.5 Volts monitor |  |
| +5 Volts monitor |  |
| _ROLL_ROT | 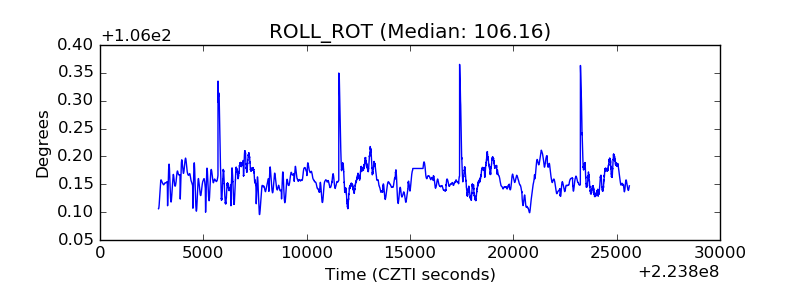 |
| _Roll_DEC | 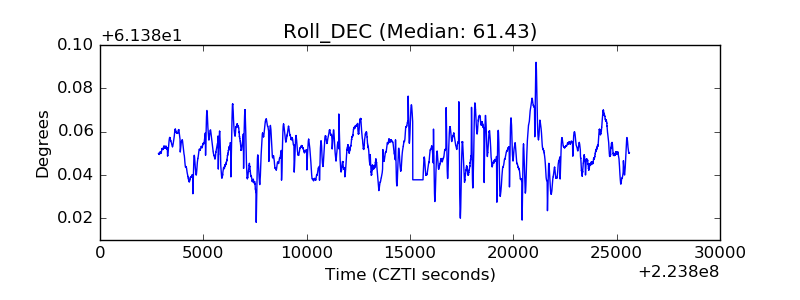 |
| _Roll_RA |  |
| Veto Counter | 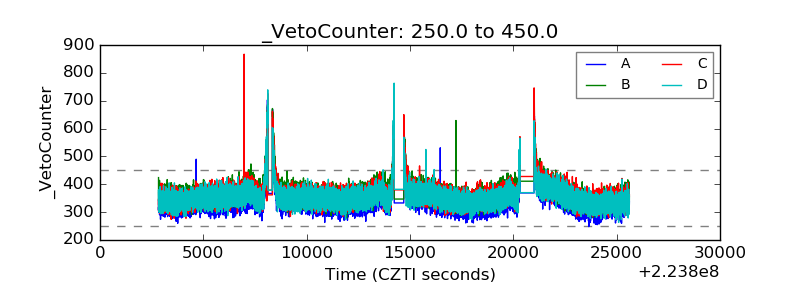 |