| Param | Original file | Final file |
|---|---|---|
| Filename | modeM0/AS1G06_164T01_9000001004_07324cztM0_level2.evt | modeM0/AS1G06_164T01_9000001004_07324cztM0_level2_quad_clean.evt |
| Size (bytes) | 1,560,467,520 | 334,082,880 |
| Size | 1.5 GB | 318.6 MB |
| Events in quadrant A | 11,627,398 | 2,150,146 |
| Events in quadrant B | 11,337,687 | 2,162,046 |
| Events in quadrant C | 10,445,855 | 2,128,595 |
| Events in quadrant D | 12,231,047 | 2,033,353 |
| Mode SS | |||
|---|---|---|---|
| Quadrant | BADHDUFLAG | Total packets | Discarded packets |
| A | 0 | 484 | 0 |
| B | 0 | 484 | 0 |
| C | 0 | 484 | 0 |
| D | 0 | 484 | 0 |
| Mode M9 | |||
|---|---|---|---|
| Quadrant | BADHDUFLAG | Total packets | Discarded packets |
| A | 0 | 14 | 0 |
| B | 0 | 14 | 0 |
| C | 0 | 14 | 0 |
| D | 0 | 14 | 0 |
| Mode M0 | |||
|---|---|---|---|
| Quadrant | BADHDUFLAG | Total packets | Discarded packets |
| A | 0 | 51338 | 4 |
| B | 0 | 49885 | 4 |
| C | 0 | 48581 | 4 |
| D | 0 | 53384 | 4 |
| Quadrant | Total seconds | Saturated seconds | Saturation percentage |
|---|---|---|---|
| A | 23901 | 691 | 2.891092% |
| B | 23901 | 519 | 2.171457% |
| C | 23901 | 313 | 1.309569% |
| D | 23901 | 451 | 1.886950% |
Noise dominated data is calculated using 1-second bins in cleaned event files. If a bin has >2000 counts, and if more than 50% of those come from <1% of pixels, then it is considered to be noise-dominated and hence unusable.
| Quadrant | # 1 sec bins | Bins with >0 counts | Bins with >2000 counts | High rate bins dominated by noise | Noise dominated (total time) | Noise dominated (detector-on time) | Marked lightcurve |
|---|---|---|---|---|---|---|---|
| A | 25306 | 23902 | 108 | 108 | 0.43% | 0.45% | 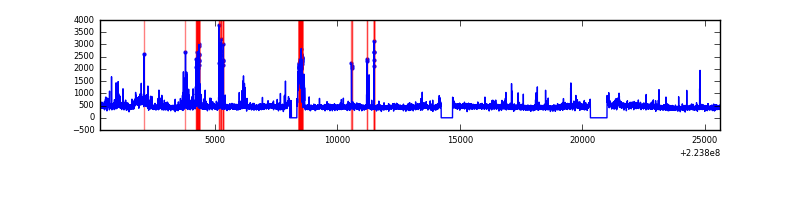 |
| B | 25306 | 23903 | 18 | 18 | 0.07% | 0.08% | 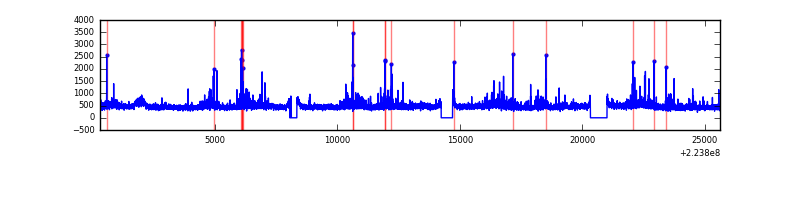 |
| C | 25306 | 23903 | 0 | 0 | 0.00% | 0.00% | 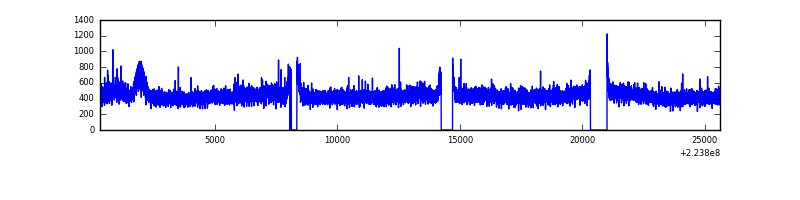 |
| D | 25306 | 23903 | 73 | 73 | 0.29% | 0.31% | 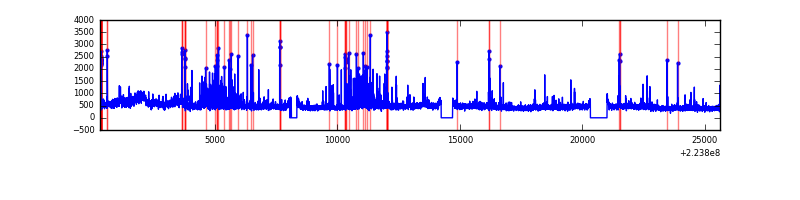 |
Top three noisy pixels from each quadrant. If the there are fewer than three noisy pixels in the level2.evt file, extra rows are filled as -1
| Pixel properties | Quadrant properties | ||||||
|---|---|---|---|---|---|---|---|
| Quadrant | DetID | PixID | Counts | Sigma | Mean | Median | Sigma |
| A | 8 | 15 | 606323 | 1112.04 | 2698 | 2635 | 542.9 |
| A | 15 | 234 | 452948 | 829.51 | 2698 | 2635 | 542.9 |
| A | 13 | 248 | 84138 | 150.13 | 2698 | 2635 | 542.9 |
| B | 11 | 51 | 318791 | 614.59 | 2729 | 2661 | 514.4 |
| B | 0 | 214 | 299929 | 577.92 | 2729 | 2661 | 514.4 |
| B | 4 | 81 | 83162 | 156.5 | 2729 | 2661 | 514.4 |
| C | 9 | 68 | 80231 | 127.26 | 2649 | 2651 | 609.6 |
| C | 13 | 61 | 20355 | 29.04 | 2649 | 2651 | 609.6 |
| C | 8 | 128 | 14655 | 19.69 | 2649 | 2651 | 609.6 |
| D | 1 | 20 | 1166207 | 1836.86 | 2622 | 2535 | 633.5 |
| D | 2 | 216 | 706544 | 1111.28 | 2622 | 2535 | 633.5 |
| D | 12 | 233 | 148651 | 230.64 | 2622 | 2535 | 633.5 |
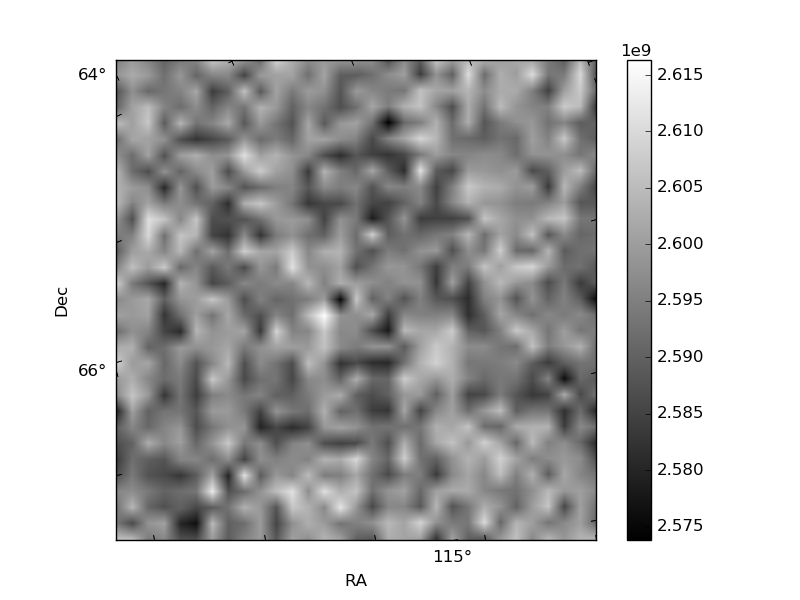
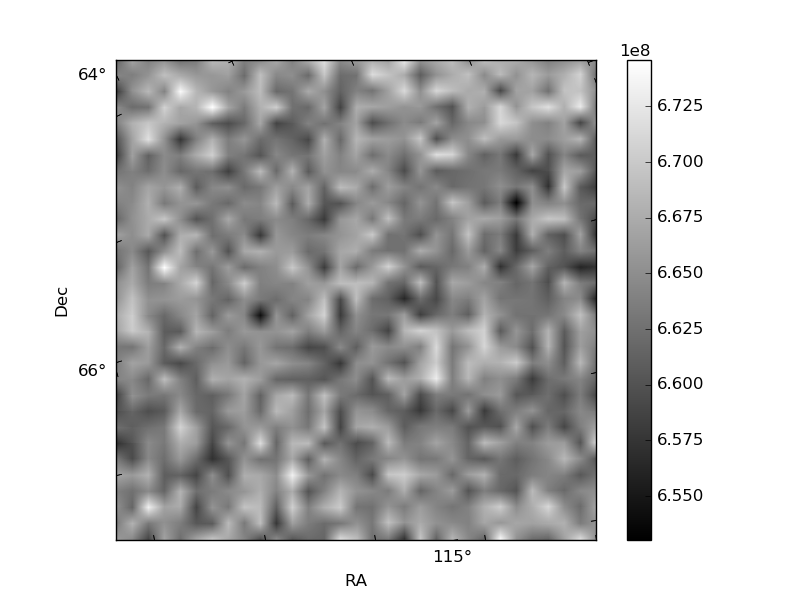
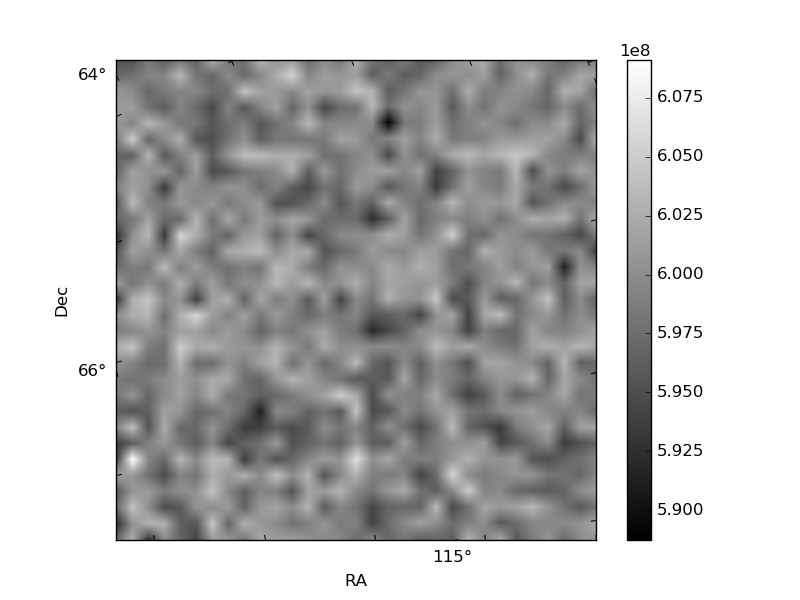
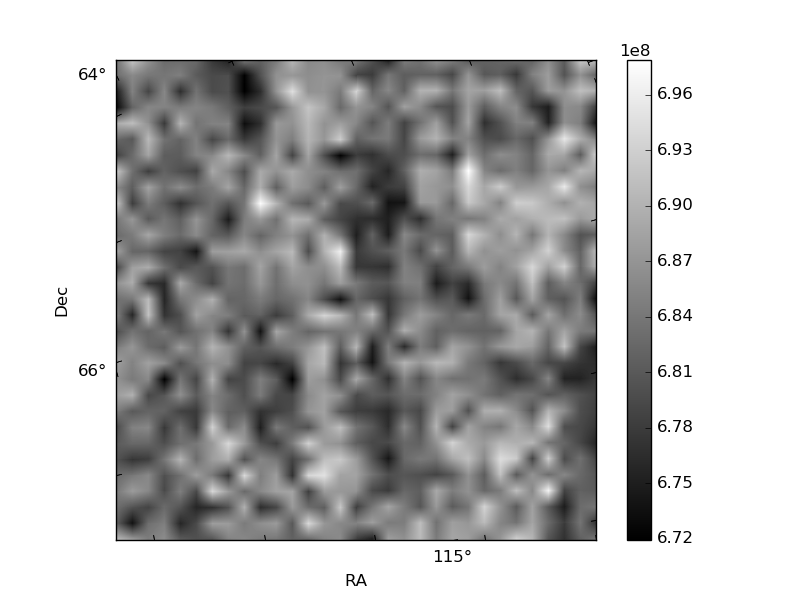
Histogram calculated using DETX and DETY for each event in the final _common_clean file
| Quadrant A | 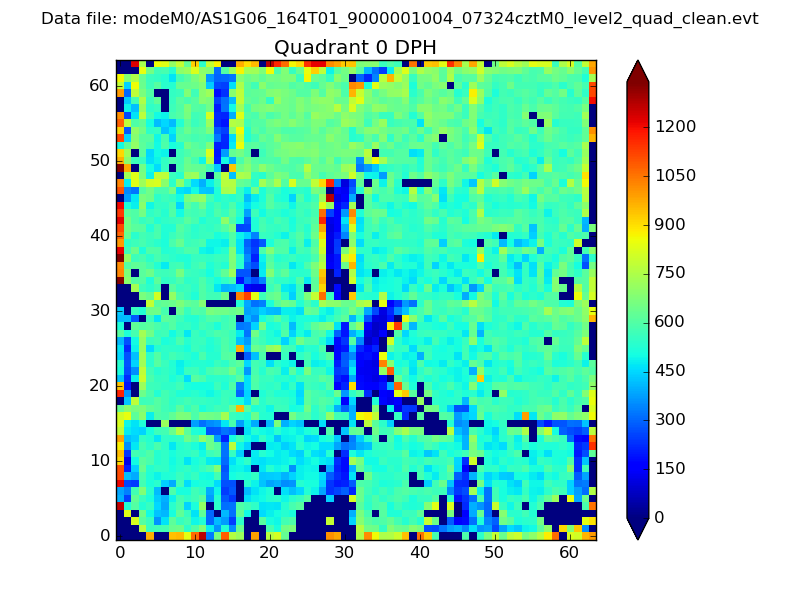 |
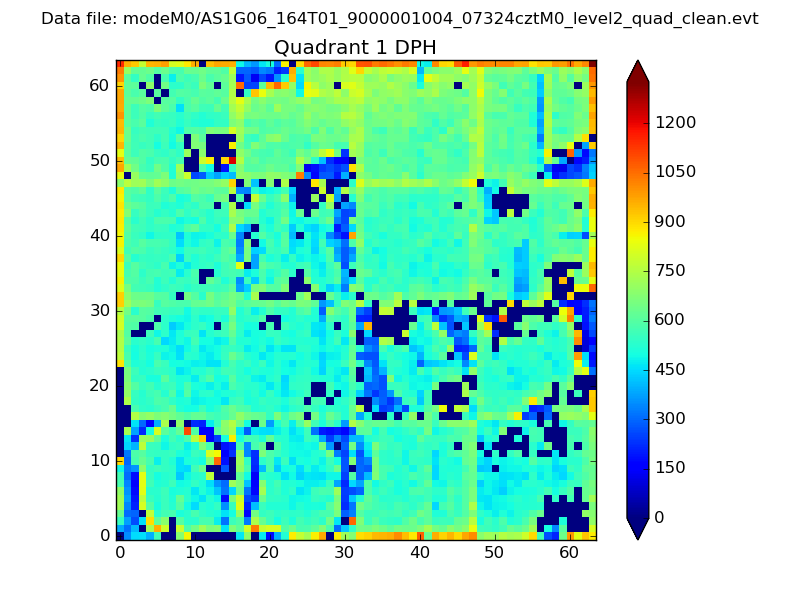 |
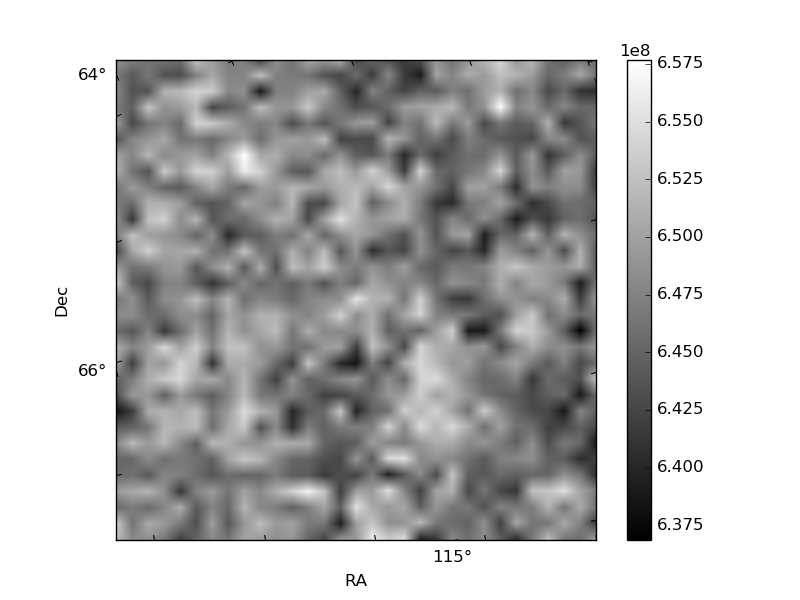
Quadrant B |
|---|---|---|---|
| Quadrant D | 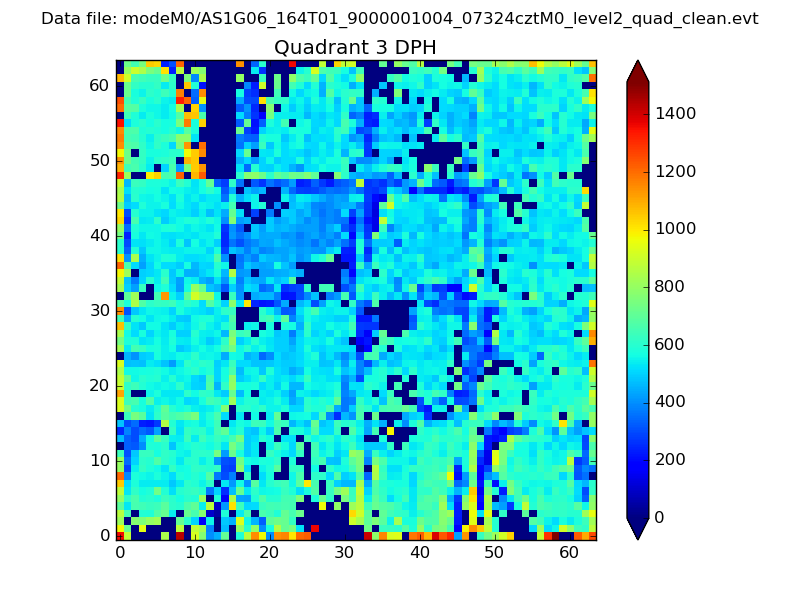 |
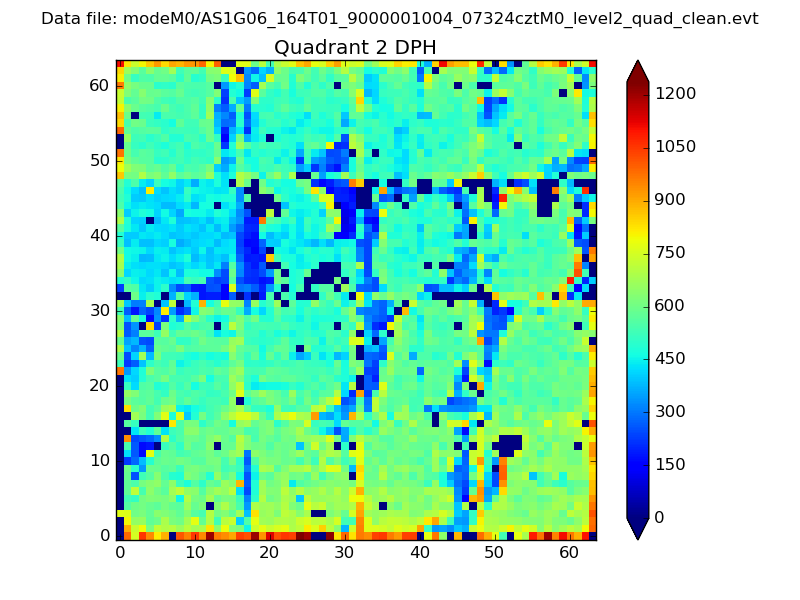 |
Quadrant C |
| Plot type | Count rate plots | Images |
|---|---|---|
| Comparison with Poisson distribution Blue bars denote a histogram of data divided into 1 sec bins. Red curve is a Poisson curve with rate = median count rate of data. |
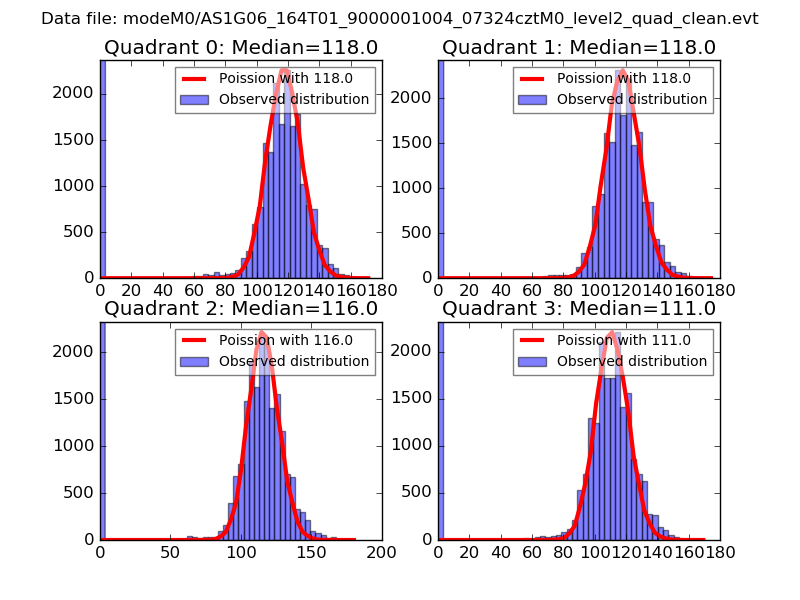 |
 |
| Quadrant-wise count rates Data is divided into 100 sec bins |
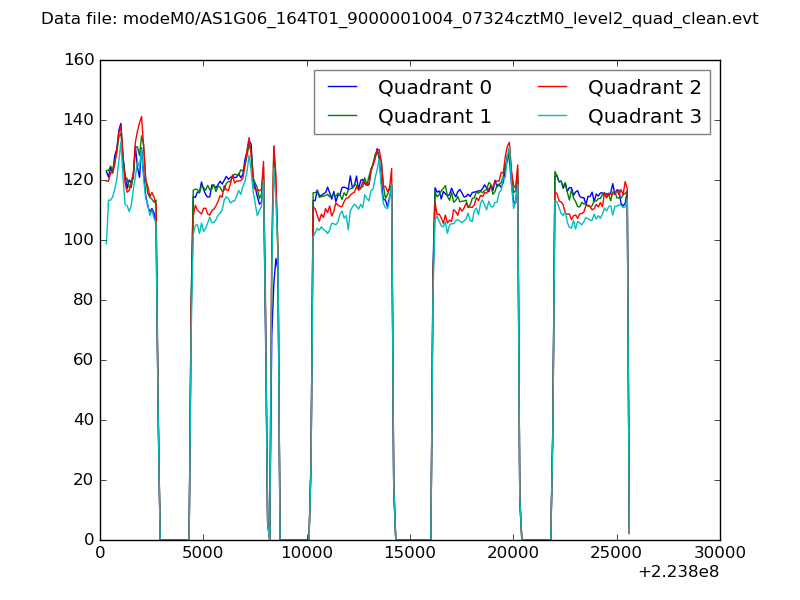 |
|
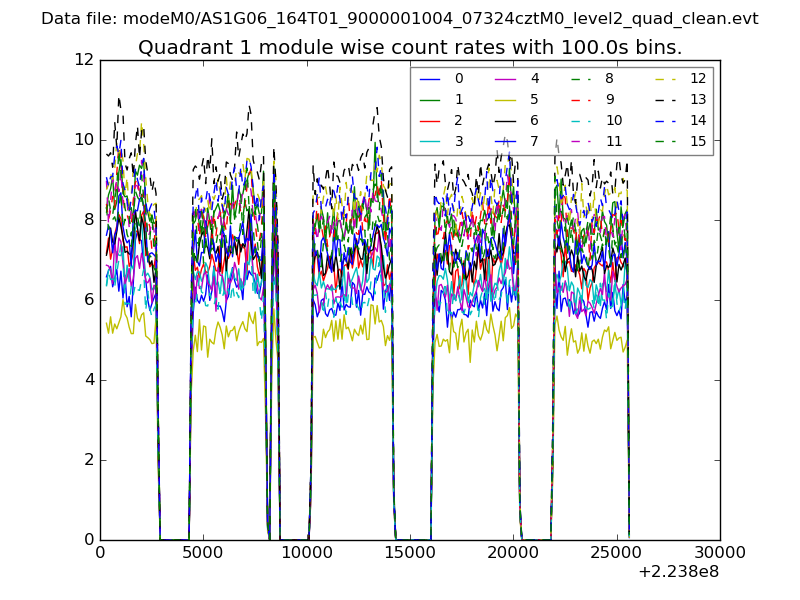
| Module-wise count rates for Quadrant A Data is divided into 100 sec bins |
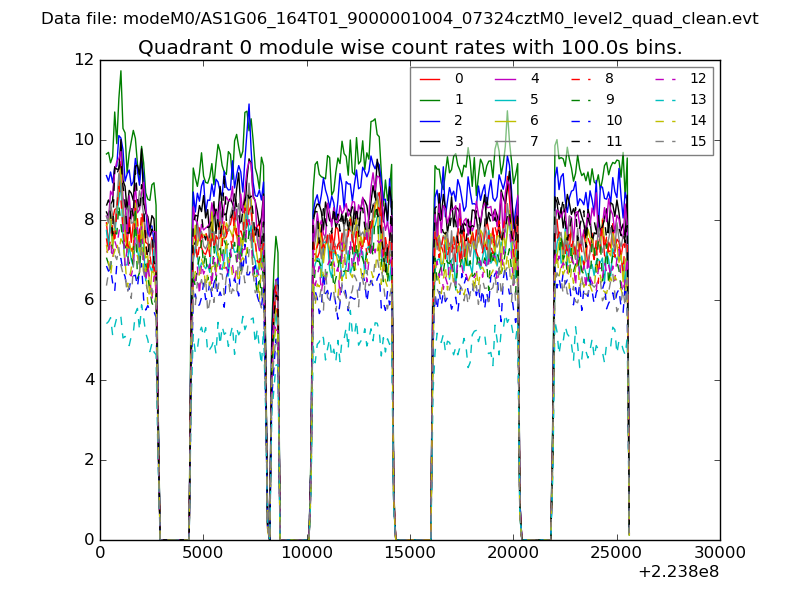 |
 |
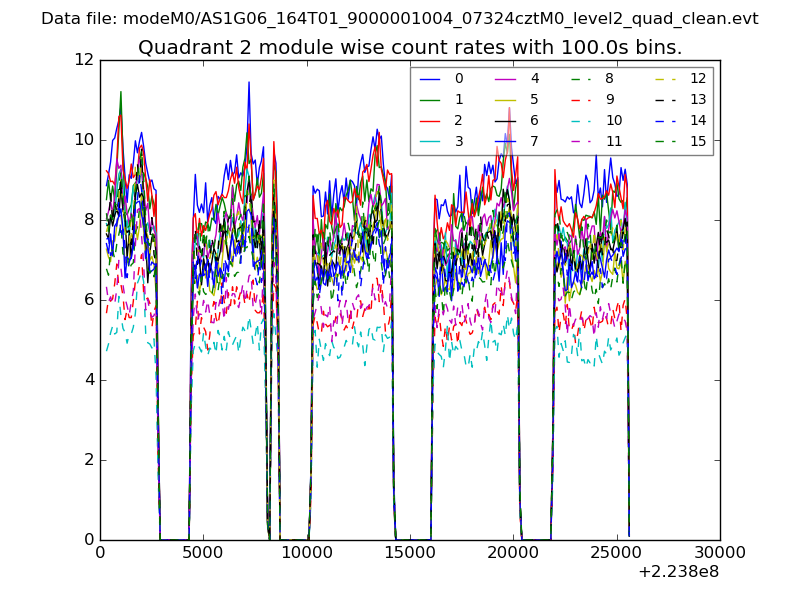
| Module-wise count rates for Quadrant B Data is divided into 100 sec bins |
 |
 |
| Module-wise count rates for Quadrant C Data is divided into 100 sec bins |
 |
 |
| Module-wise count rates for Quadrant D Data is divided into 100 sec bins |
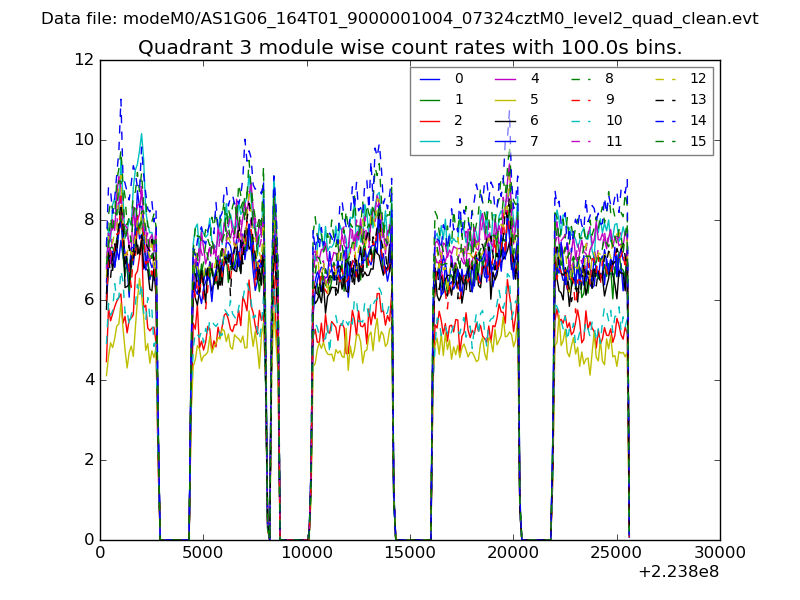 |
 |
| Parameter | Plot |
|---|---|
| CZT HV Monitor | 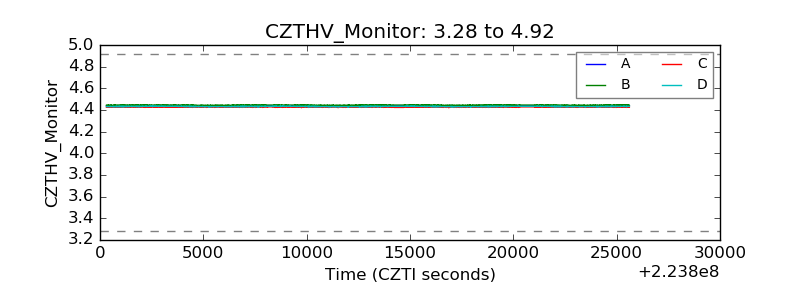 |
| D_VDD | 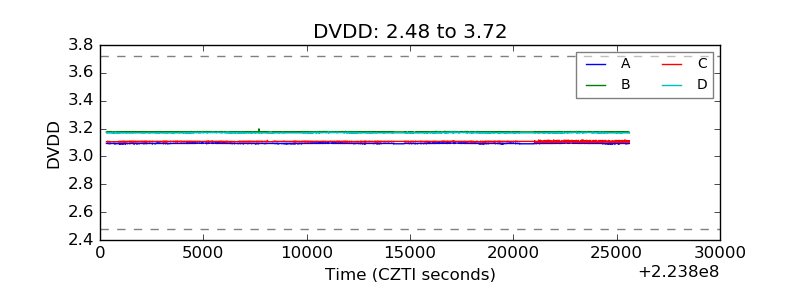 |
| Temperature 1 | 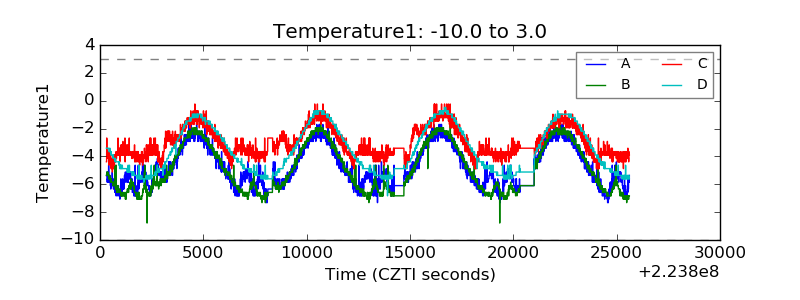 |
| Veto HV Monitor | 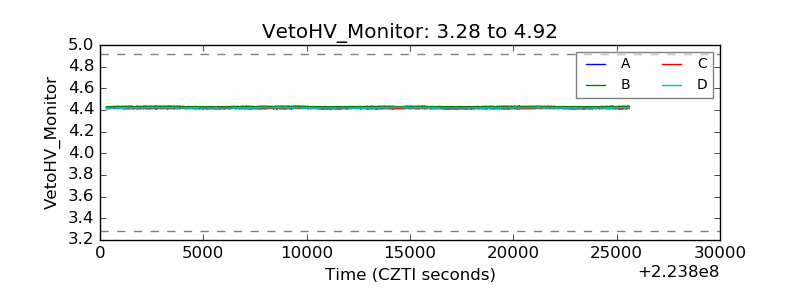 |
| Veto LLD | 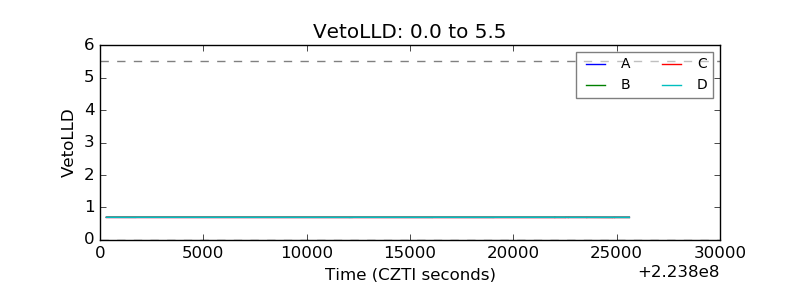 |
| Alpha Counter | 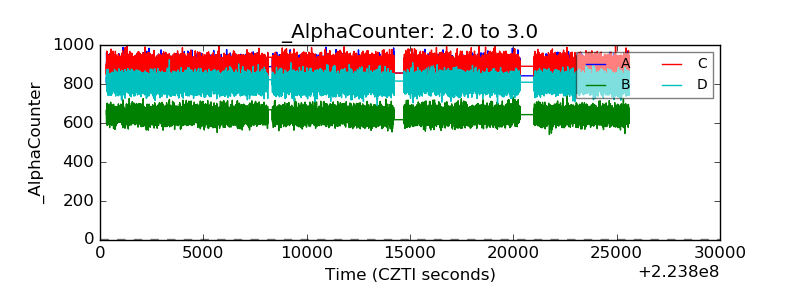 |
| _CPM_Rate | 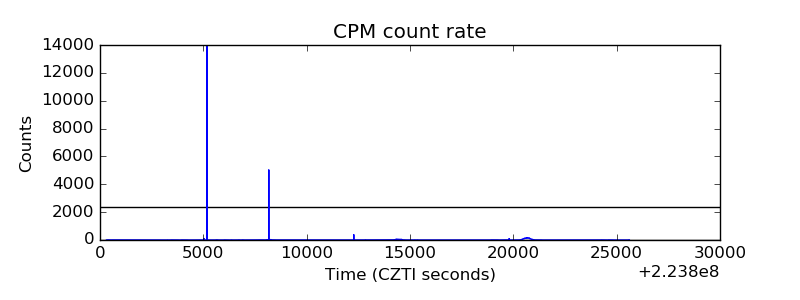 |
| CZT Counter | 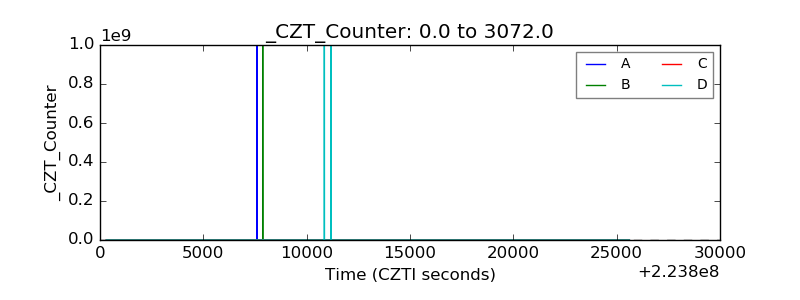 |
| +2.5 Volts monitor | 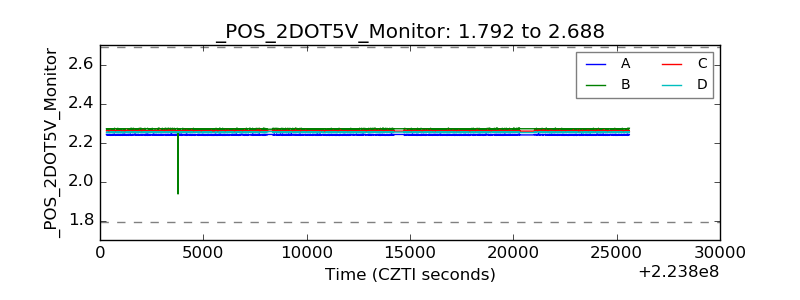 |
| +5 Volts monitor |  |
| _ROLL_ROT | 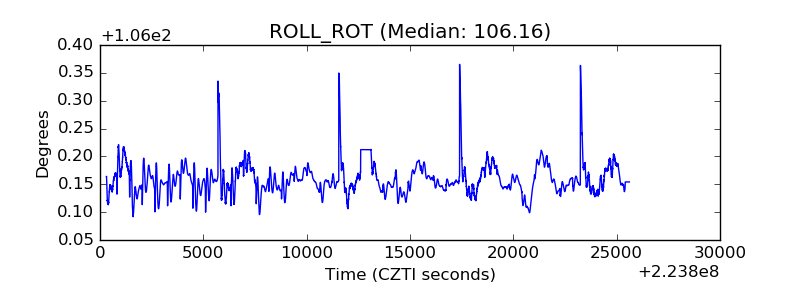 |
| _Roll_DEC | 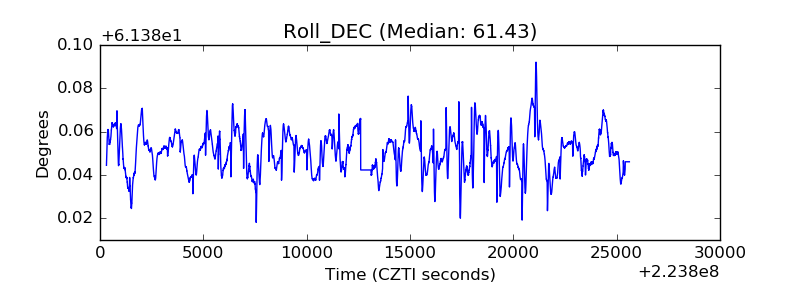 |
| _Roll_RA | 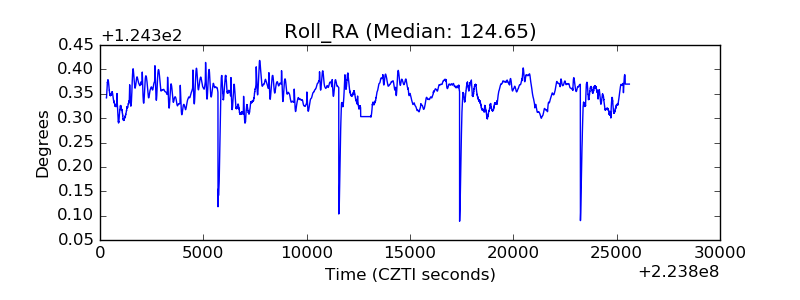 |
| Veto Counter | 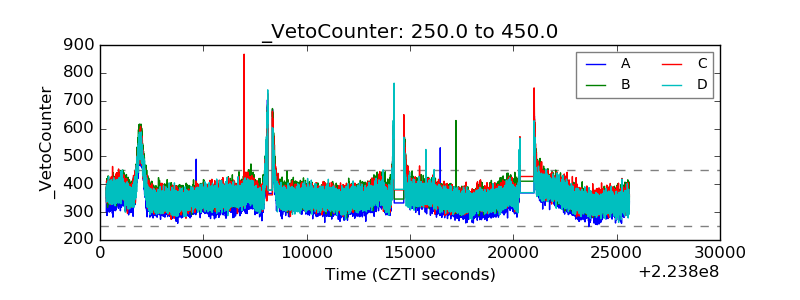 |