| Param | Original file | Final file |
|---|---|---|
| Filename | modeM0/AS1G06_157T02_9000001008_07338cztM0_level2.evt | modeM0/AS1G06_157T02_9000001008_07338cztM0_level2_quad_clean.evt |
| Size (bytes) | 434,237,760 | 102,090,240 |
| Size | 414.1 MB | 97.4 MB |
| Events in quadrant A | 3,081,497 | 664,670 |
| Events in quadrant B | 3,238,251 | 686,447 |
| Events in quadrant C | 2,996,414 | 670,180 |
| Events in quadrant D | 3,408,687 | 632,937 |
| Mode M0 | |||
|---|---|---|---|
| Quadrant | BADHDUFLAG | Total packets | Discarded packets |
| A | 0 | 13336 | 3 |
| B | 0 | 13892 | 2 |
| C | 0 | 13061 | 2 |
| D | 0 | 14531 | 2 |
| Mode SS | |||
|---|---|---|---|
| Quadrant | BADHDUFLAG | Total packets | Discarded packets |
| A | 0 | 126 | 0 |
| B | 0 | 126 | 0 |
| C | 0 | 126 | 0 |
| D | 0 | 126 | 0 |
| Mode M9 | |||
|---|---|---|---|
| Quadrant | BADHDUFLAG | Total packets | Discarded packets |
| A | 0 | 15 | 0 |
| B | 0 | 15 | 0 |
| C | 0 | 15 | 0 |
| D | 0 | 16 | 0 |
| Quadrant | Total seconds | Saturated seconds | Saturation percentage |
|---|---|---|---|
| A | 6275 | 60 | 0.956175% |
| B | 6275 | 73 | 1.163347% |
| C | 6275 | 40 | 0.637450% |
| D | 6275 | 82 | 1.306773% |
Noise dominated data is calculated using 1-second bins in cleaned event files. If a bin has >2000 counts, and if more than 50% of those come from <1% of pixels, then it is considered to be noise-dominated and hence unusable.
| Quadrant | # 1 sec bins | Bins with >0 counts | Bins with >2000 counts | High rate bins dominated by noise | Noise dominated (total time) | Noise dominated (detector-on time) | Marked lightcurve |
|---|---|---|---|---|---|---|---|
| A | 7605 | 6276 | 10 | 10 | 0.13% | 0.16% | 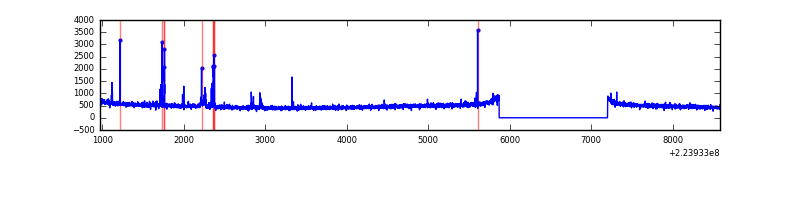 |
| B | 7605 | 6276 | 10 | 10 | 0.13% | 0.16% | 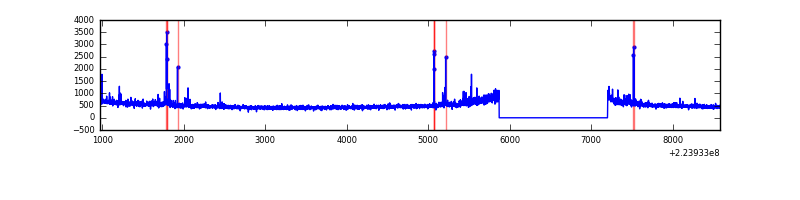 |
| C | 7605 | 6276 | 0 | 0 | 0.00% | 0.00% | 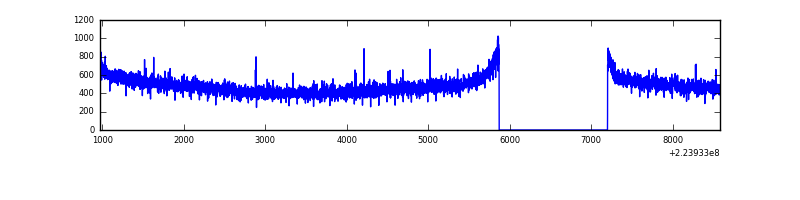 |
| D | 7605 | 6276 | 32 | 32 | 0.42% | 0.51% | 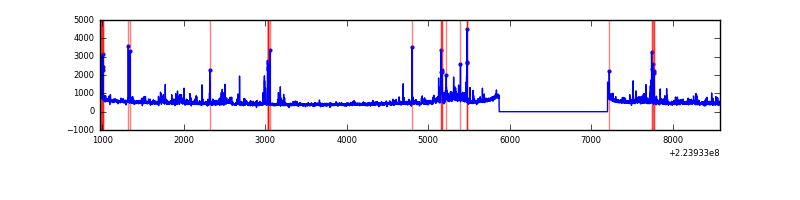 |
Top three noisy pixels from each quadrant. If the there are fewer than three noisy pixels in the level2.evt file, extra rows are filled as -1
| Pixel properties | Quadrant properties | ||||||
|---|---|---|---|---|---|---|---|
| Quadrant | DetID | PixID | Counts | Sigma | Mean | Median | Sigma |
| A | 15 | 234 | 110655 | 701.39 | 772 | 758 | 156.7 |
| A | 0 | 226 | 7512 | 43.11 | 772 | 758 | 156.7 |
| A | 12 | 194 | 6864 | 38.97 | 772 | 758 | 156.7 |
| B | 0 | 214 | 121941 | 819.85 | 788 | 771 | 147.8 |
| B | 11 | 51 | 24793 | 162.53 | 788 | 771 | 147.8 |
| B | 4 | 81 | 20489 | 133.41 | 788 | 771 | 147.8 |
| C | 9 | 68 | 25091 | 138.65 | 760 | 767 | 175.4 |
| C | 13 | 61 | 5991 | 29.78 | 760 | 767 | 175.4 |
| C | 8 | 222 | 3125 | 13.44 | 760 | 767 | 175.4 |
| D | 12 | 221 | 274566 | 1497.8 | 746 | 723 | 182.8 |
| D | 13 | 105 | 146018 | 794.7 | 746 | 723 | 182.8 |
| D | 2 | 14 | 62054 | 335.45 | 746 | 723 | 182.8 |
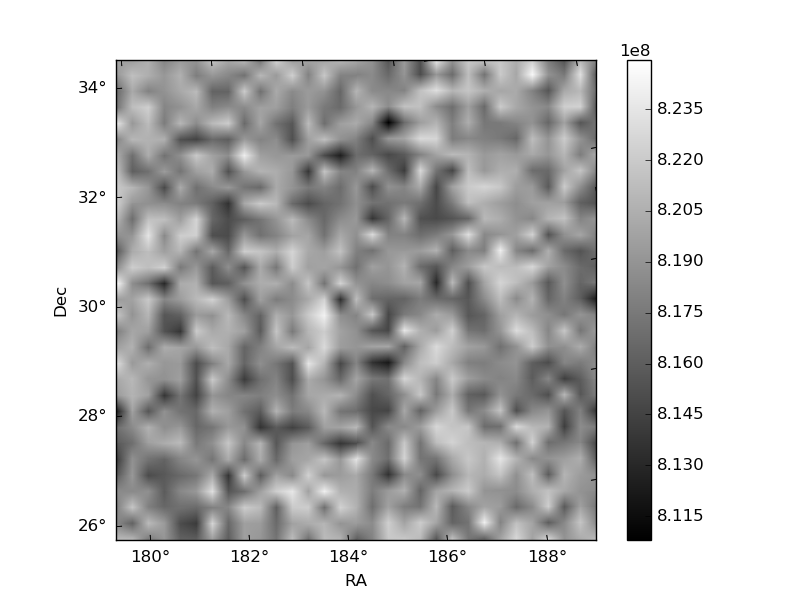
Histogram calculated using DETX and DETY for each event in the final _common_clean file
| Quadrant A | 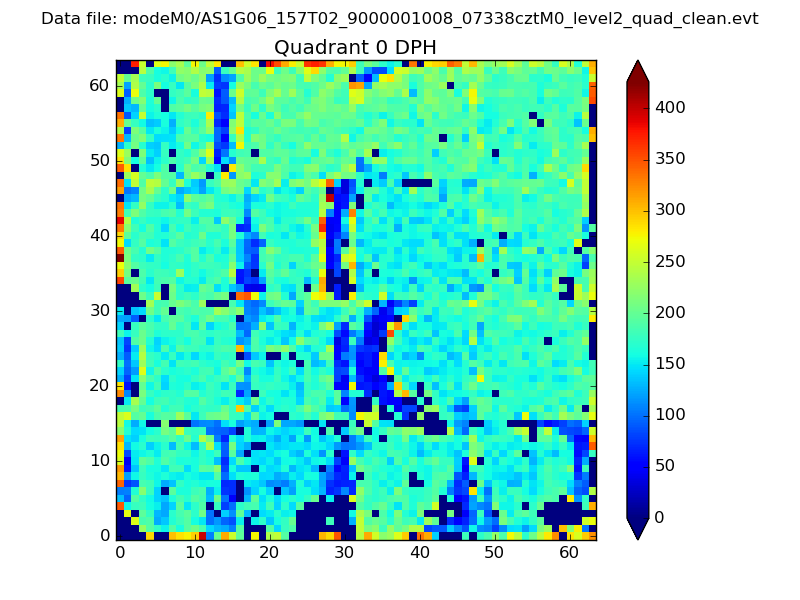 |
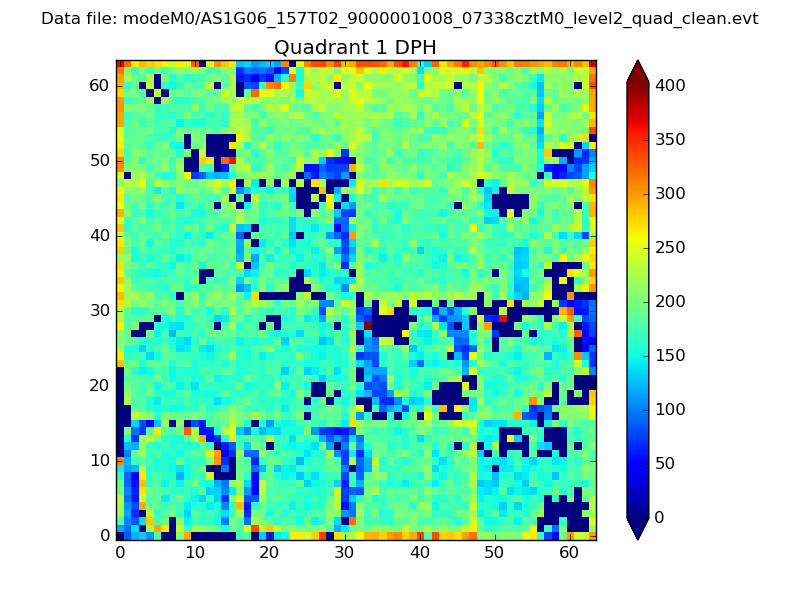 |
Quadrant B |
|---|---|---|---|
| Quadrant D | 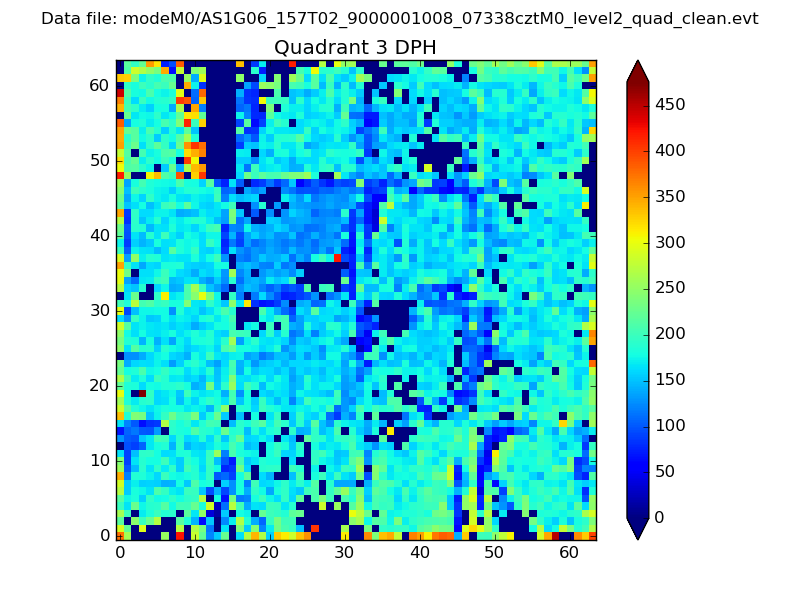 |
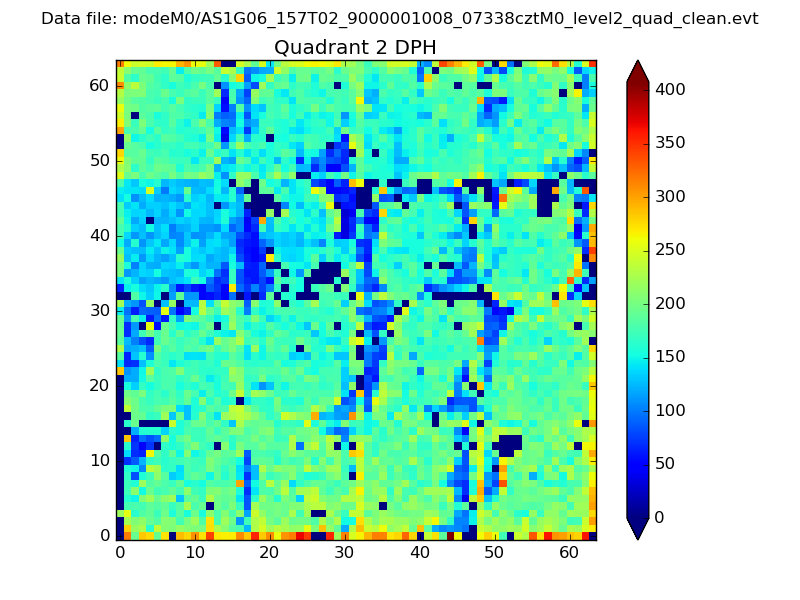 |
Quadrant C |
| Plot type | Count rate plots | Images |
|---|---|---|
| Comparison with Poisson distribution Blue bars denote a histogram of data divided into 1 sec bins. Red curve is a Poisson curve with rate = median count rate of data. |
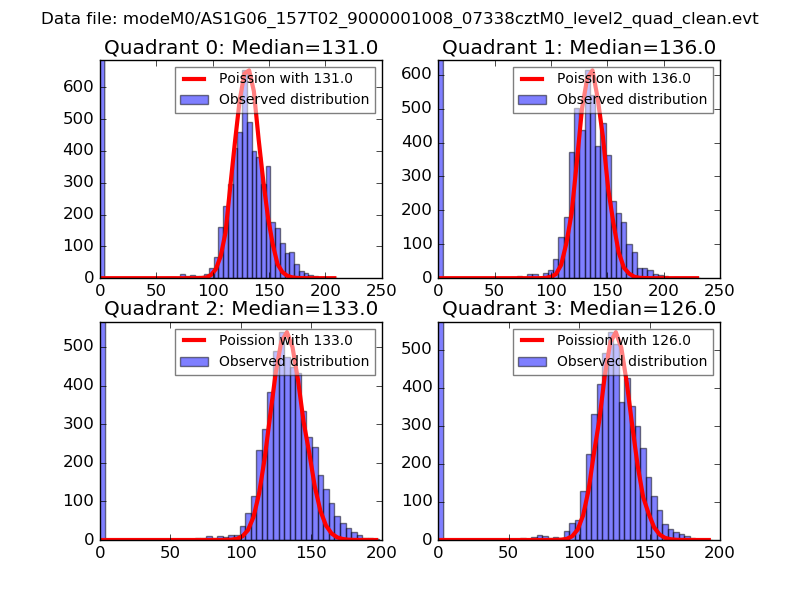 |
 |
| Quadrant-wise count rates Data is divided into 100 sec bins |
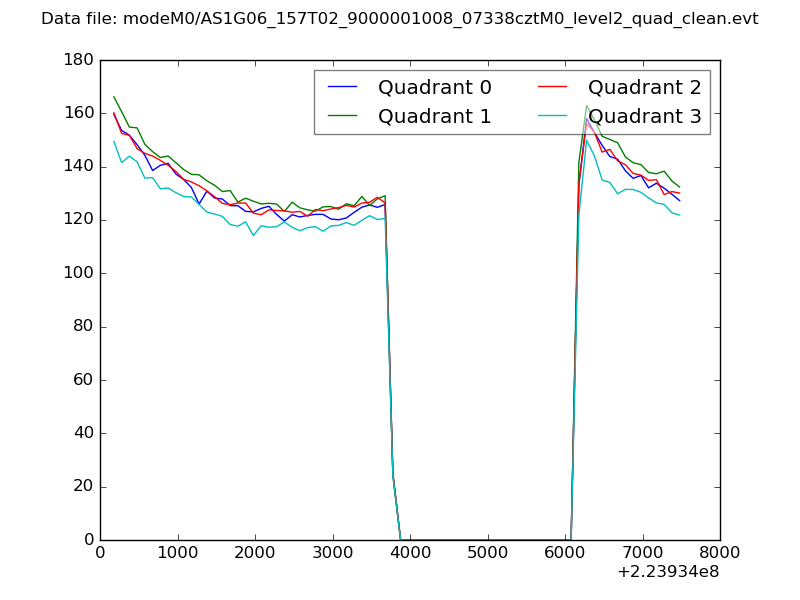 |
|
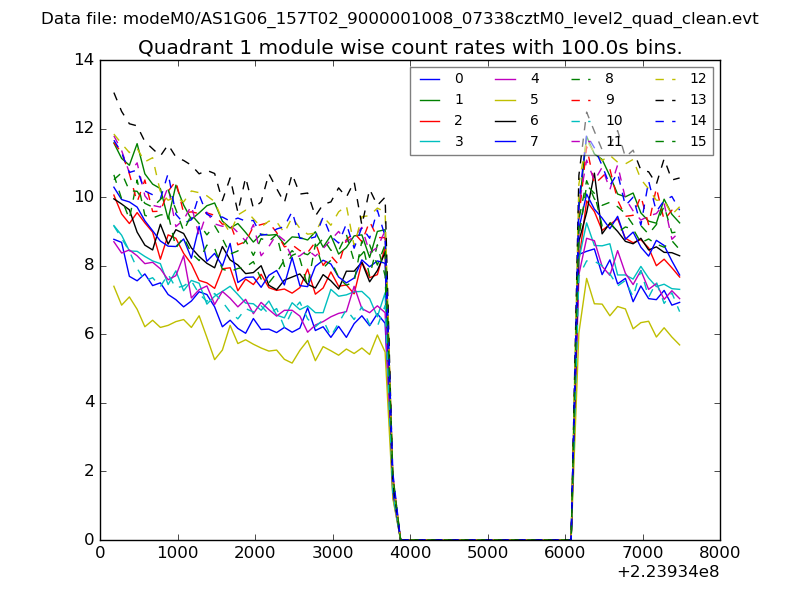
| Module-wise count rates for Quadrant A Data is divided into 100 sec bins |
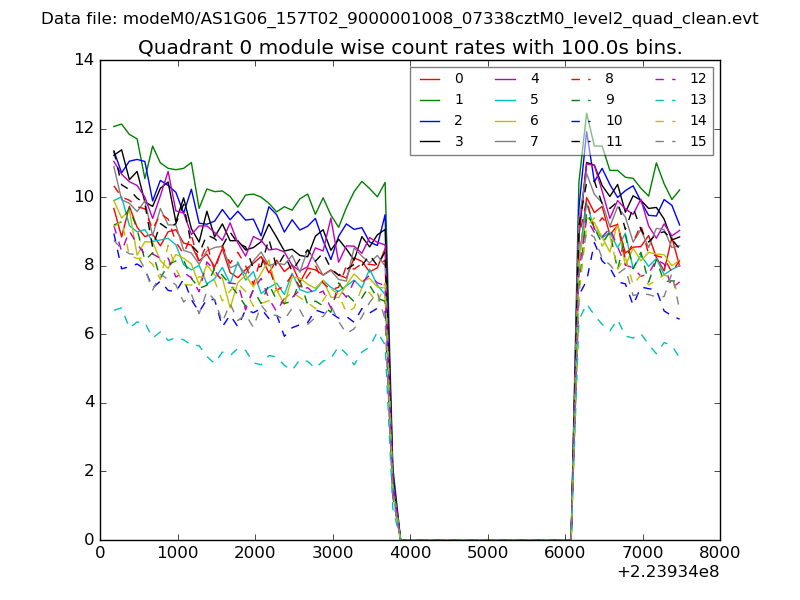 |
 |
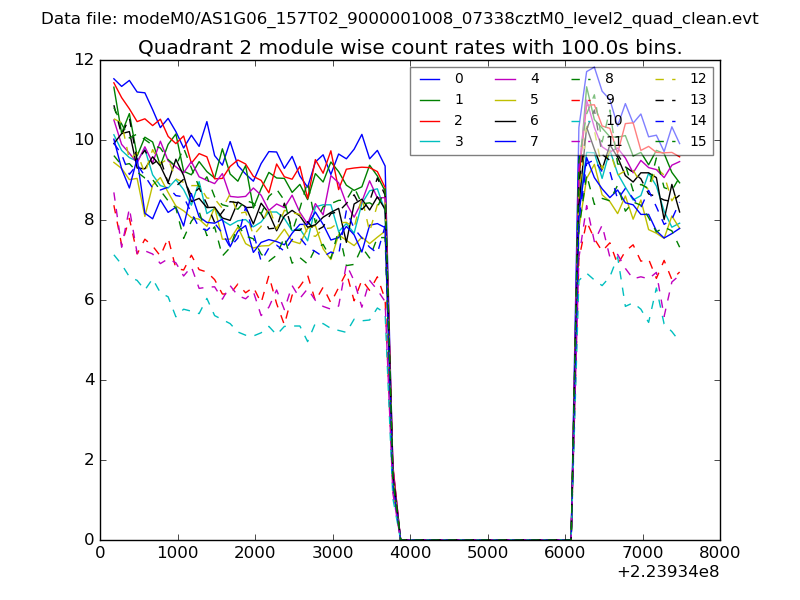
| Module-wise count rates for Quadrant B Data is divided into 100 sec bins |
 |
 |
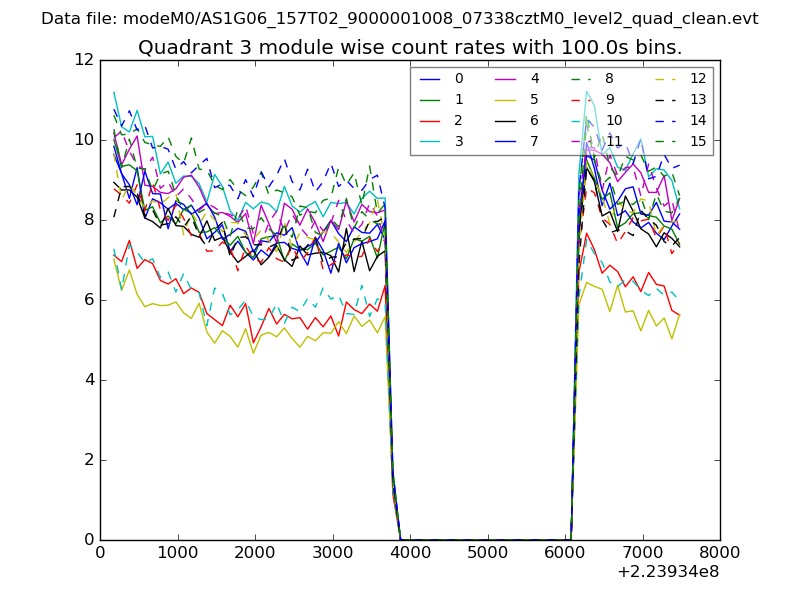
| Module-wise count rates for Quadrant C Data is divided into 100 sec bins |
 |
 |
| Module-wise count rates for Quadrant D Data is divided into 100 sec bins |
 |
 |
| Parameter | Plot |
|---|---|
| CZT HV Monitor | 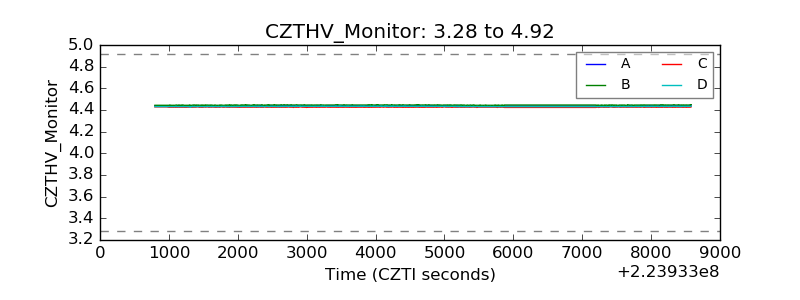 |
| D_VDD |  |
| Temperature 1 |  |
| Veto HV Monitor | 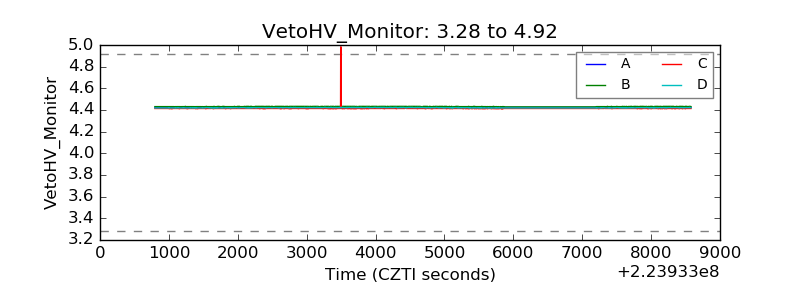 |
| Veto LLD | 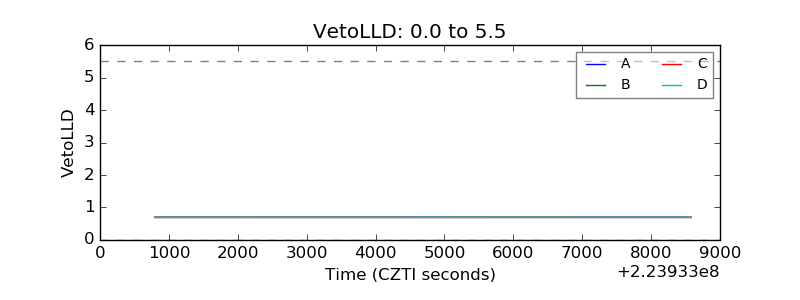 |
| Alpha Counter | 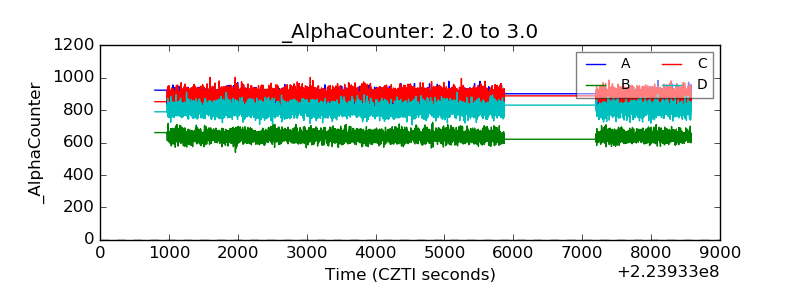 |
| _CPM_Rate | 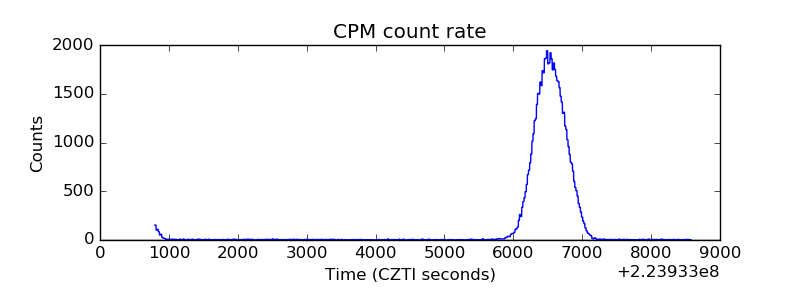 |
| CZT Counter | 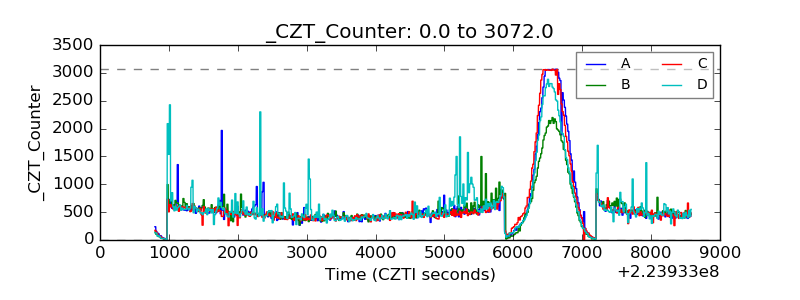 |
| +2.5 Volts monitor |  |
| +5 Volts monitor |  |
| _ROLL_ROT | 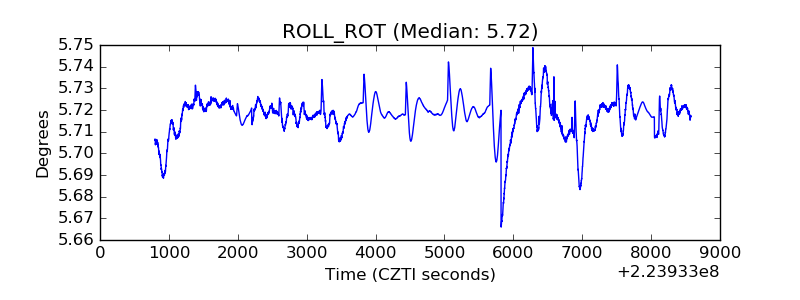 |
| _Roll_DEC | 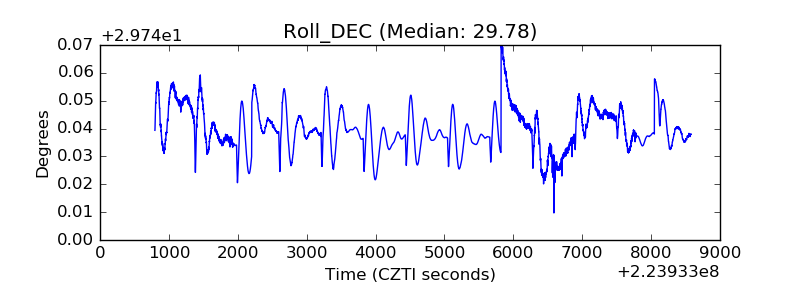 |
| _Roll_RA | 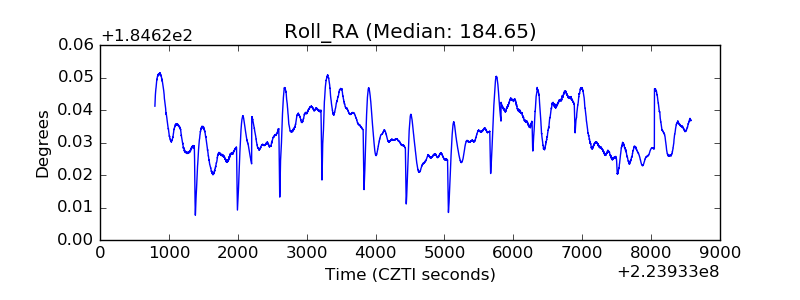 |
| Veto Counter | 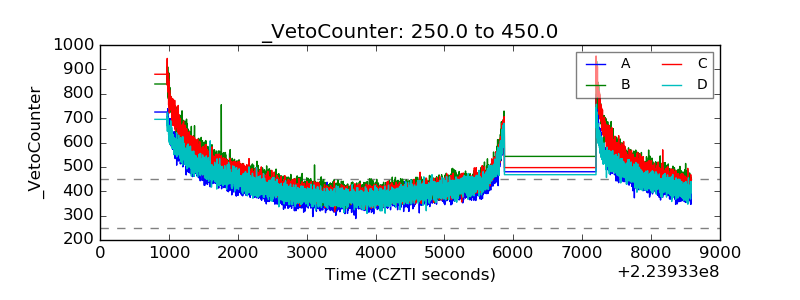 |