| Param | Original file | Final file |
|---|---|---|
| Filename | modeM0/AS1G06_157T02_9000001008_07340cztM0_level2.evt | modeM0/AS1G06_157T02_9000001008_07340cztM0_level2_quad_clean.evt |
| Size (bytes) | 481,121,280 | 93,533,760 |
| Size | 458.8 MB | 89.2 MB |
| Events in quadrant A | 3,338,861 | 582,999 |
| Events in quadrant B | 3,517,860 | 602,681 |
| Events in quadrant C | 3,378,393 | 589,636 |
| Events in quadrant D | 3,849,422 | 558,663 |
| Mode M0 | |||
|---|---|---|---|
| Quadrant | BADHDUFLAG | Total packets | Discarded packets |
| A | 0 | 15088 | 3 |
| B | 0 | 15445 | 2 |
| C | 0 | 15107 | 2 |
| D | 0 | 16533 | 2 |
| Mode SS | |||
|---|---|---|---|
| Quadrant | BADHDUFLAG | Total packets | Discarded packets |
| A | 0 | 148 | 0 |
| B | 0 | 148 | 0 |
| C | 0 | 148 | 0 |
| D | 0 | 148 | 0 |
| Mode M9 | |||
|---|---|---|---|
| Quadrant | BADHDUFLAG | Total packets | Discarded packets |
| A | 0 | 24 | 0 |
| B | 0 | 24 | 0 |
| C | 0 | 24 | 0 |
| D | 0 | 24 | 0 |
| Quadrant | Total seconds | Saturated seconds | Saturation percentage |
|---|---|---|---|
| A | 7156 | 83 | 1.159866% |
| B | 7156 | 96 | 1.341532% |
| C | 7156 | 48 | 0.670766% |
| D | 7156 | 99 | 1.383454% |
Noise dominated data is calculated using 1-second bins in cleaned event files. If a bin has >2000 counts, and if more than 50% of those come from <1% of pixels, then it is considered to be noise-dominated and hence unusable.
| Quadrant | # 1 sec bins | Bins with >0 counts | Bins with >2000 counts | High rate bins dominated by noise | Noise dominated (total time) | Noise dominated (detector-on time) | Marked lightcurve |
|---|---|---|---|---|---|---|---|
| A | 9516 | 7158 | 3 | 3 | 0.03% | 0.04% | 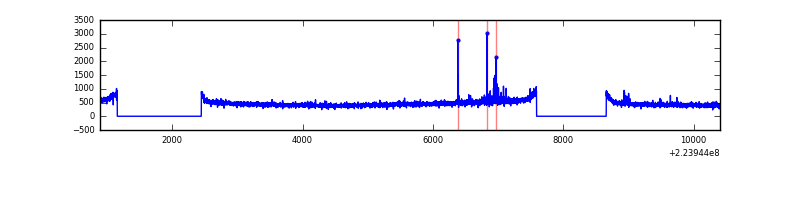 |
| B | 9516 | 7158 | 1 | 1 | 0.01% | 0.01% | 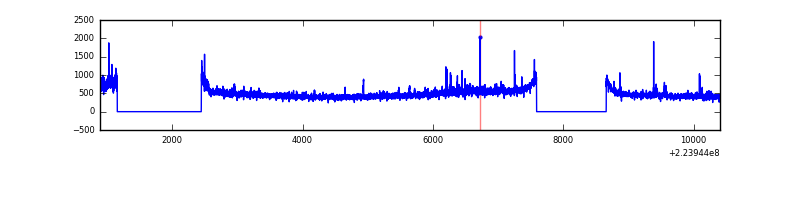 |
| C | 9516 | 7158 | 0 | 0 | 0.00% | 0.00% | 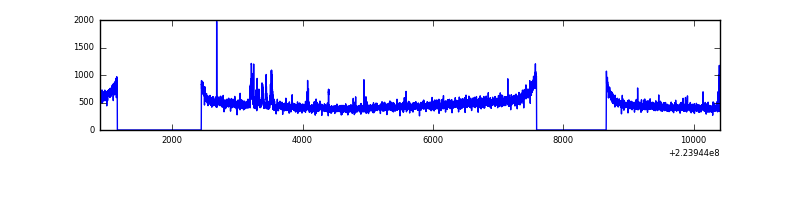 |
| D | 9516 | 7158 | 72 | 72 | 0.76% | 1.01% | 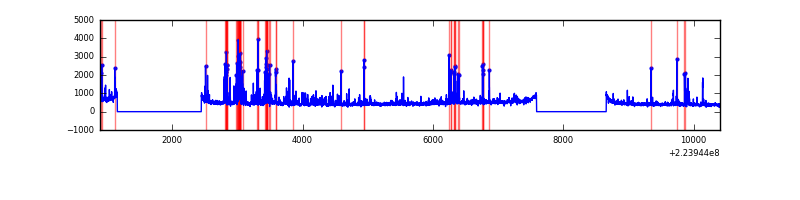 |
Top three noisy pixels from each quadrant. If the there are fewer than three noisy pixels in the level2.evt file, extra rows are filled as -1
| Pixel properties | Quadrant properties | ||||||
|---|---|---|---|---|---|---|---|
| Quadrant | DetID | PixID | Counts | Sigma | Mean | Median | Sigma |
| A | 14 | 111 | 45072 | 253.65 | 851 | 831 | 174.4 |
| A | 13 | 248 | 15119 | 81.92 | 851 | 831 | 174.4 |
| A | 0 | 226 | 8139 | 41.9 | 851 | 831 | 174.4 |
| B | 0 | 214 | 65360 | 387.11 | 868 | 846 | 166.7 |
| B | 4 | 81 | 32935 | 192.55 | 868 | 846 | 166.7 |
| B | 11 | 51 | 28263 | 164.51 | 868 | 846 | 166.7 |
| C | 9 | 68 | 105416 | 538.55 | 836 | 840 | 194.2 |
| C | 13 | 61 | 6515 | 29.23 | 836 | 840 | 194.2 |
| C | 10 | 22 | 6029 | 26.72 | 836 | 840 | 194.2 |
| D | 5 | 233 | 287372 | 1422.24 | 821 | 794 | 201.5 |
| D | 2 | 216 | 163847 | 809.21 | 821 | 794 | 201.5 |
| D | 12 | 233 | 115947 | 571.49 | 821 | 794 | 201.5 |
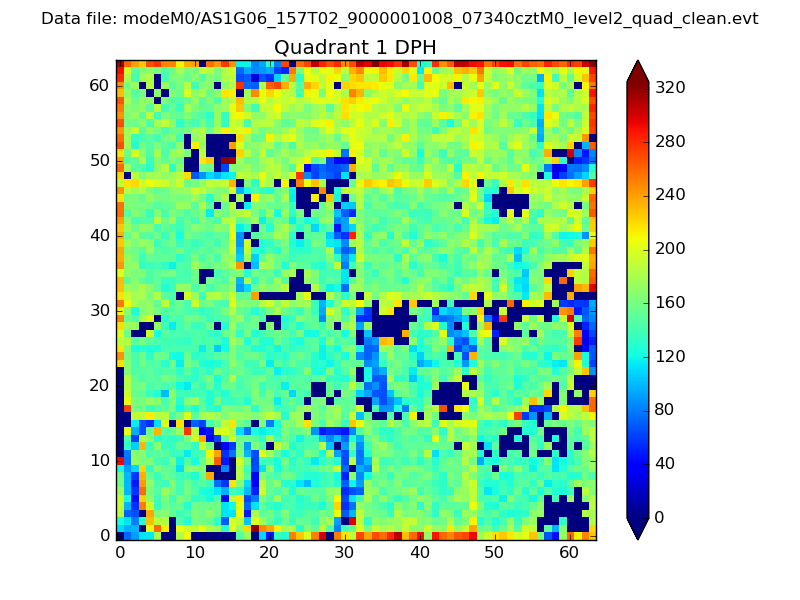
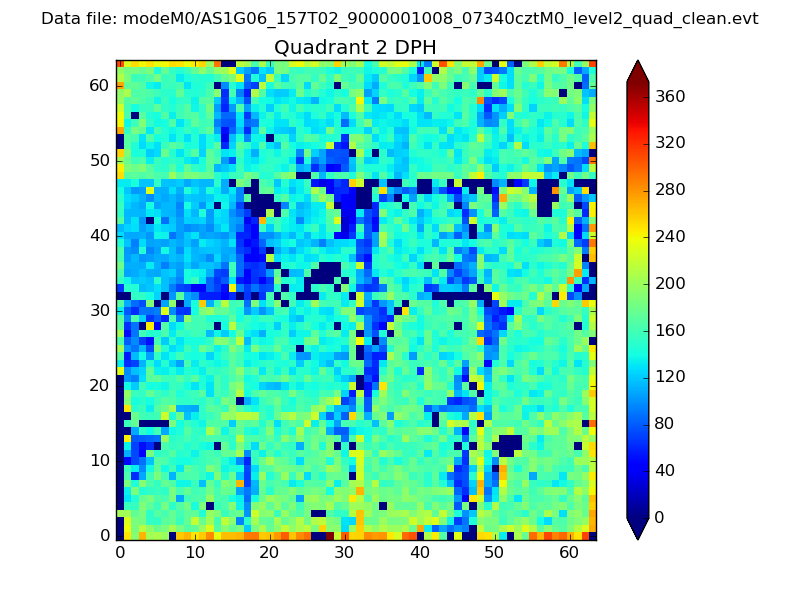
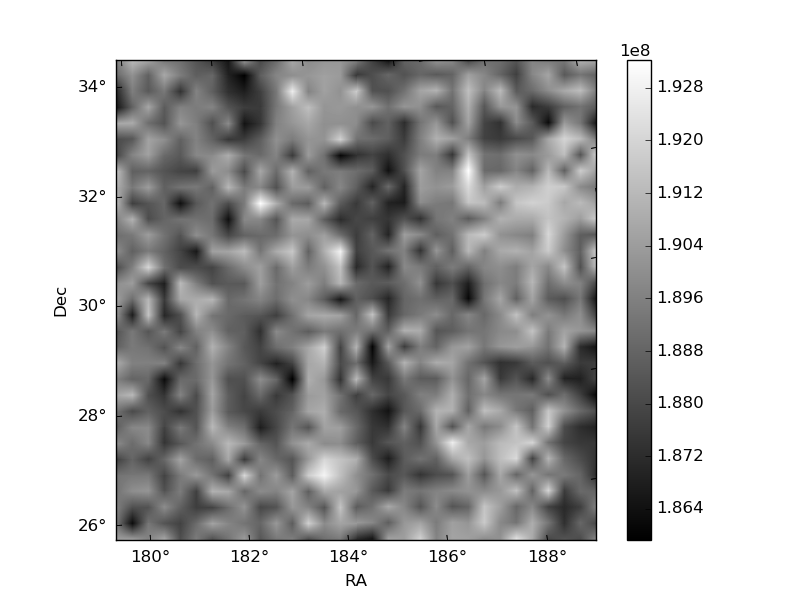
Histogram calculated using DETX and DETY for each event in the final _common_clean file
| Quadrant A |  |
 |
Quadrant B |
|---|---|---|---|
| Quadrant D |  |
 |
Quadrant C |
| Plot type | Count rate plots | Images |
|---|---|---|
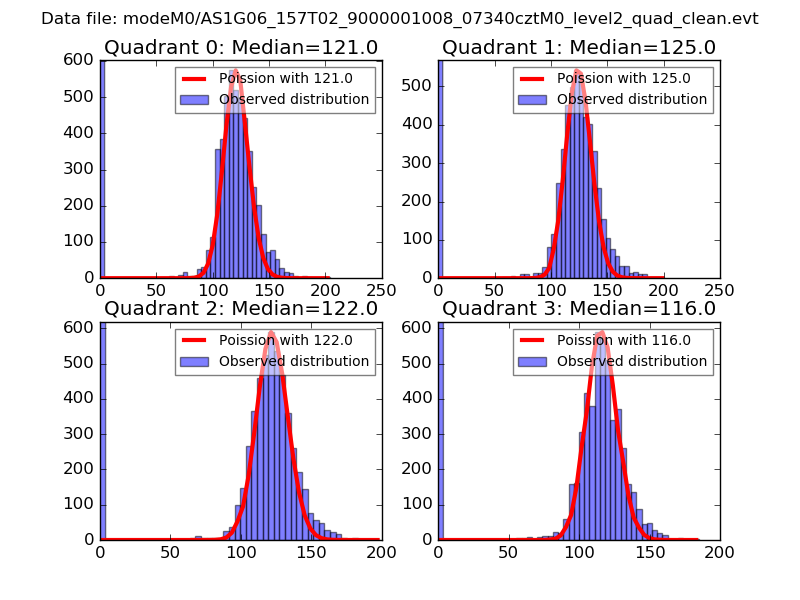
| Comparison with Poisson distribution Blue bars denote a histogram of data divided into 1 sec bins. Red curve is a Poisson curve with rate = median count rate of data. |
 |
 |
| Quadrant-wise count rates Data is divided into 100 sec bins |
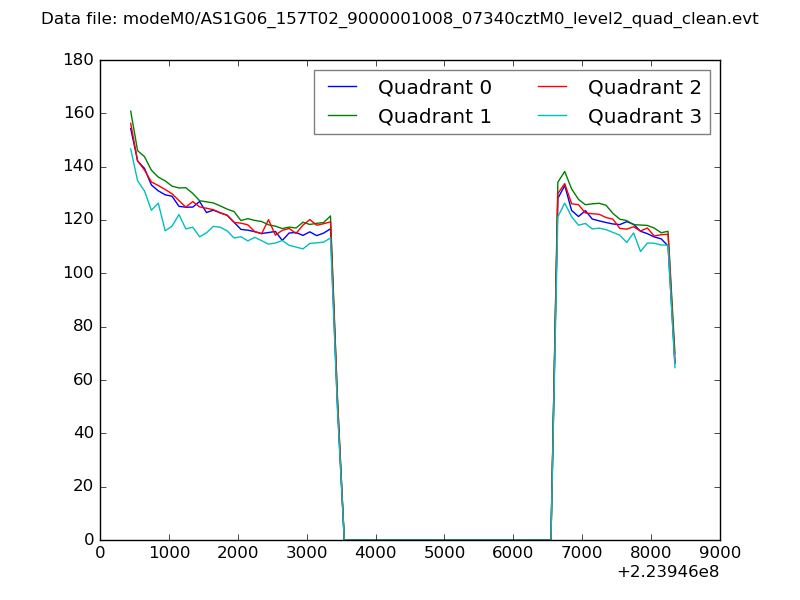 |
|
| Module-wise count rates for Quadrant A Data is divided into 100 sec bins |
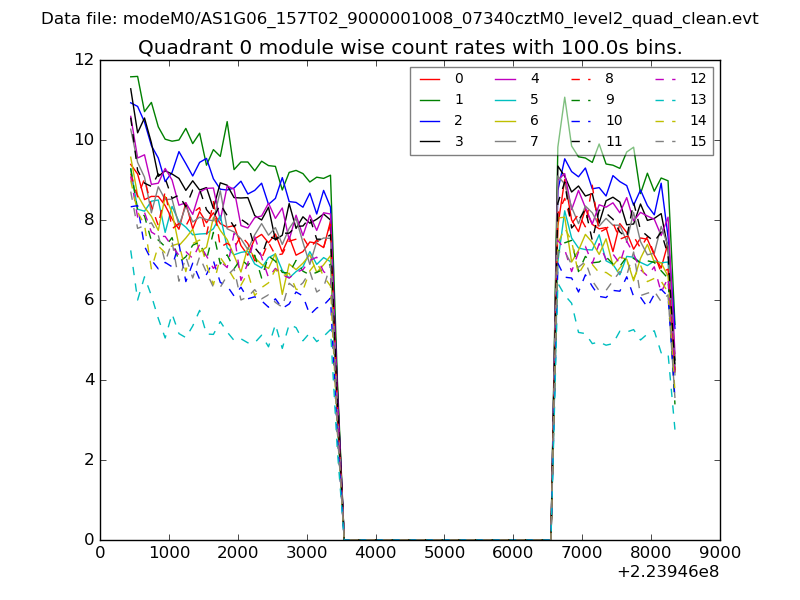 |
 |
| Module-wise count rates for Quadrant B Data is divided into 100 sec bins |
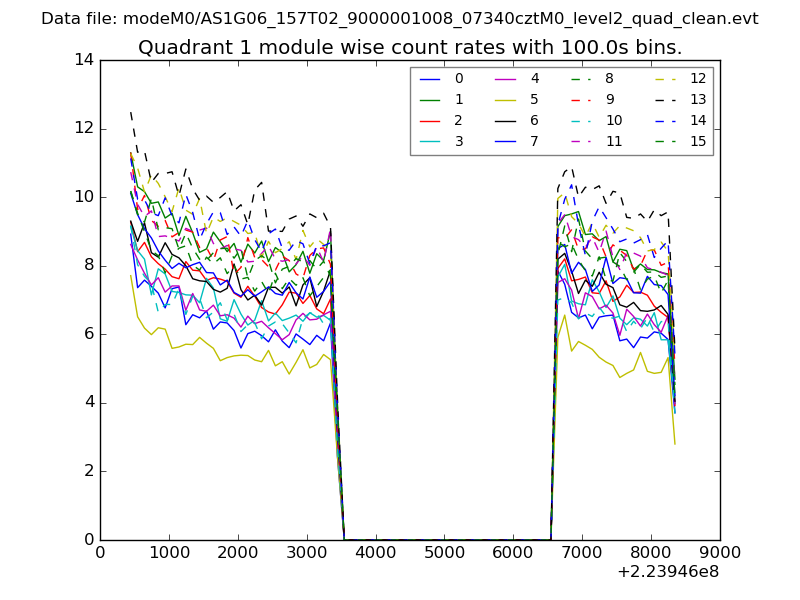 |
 |
| Module-wise count rates for Quadrant C Data is divided into 100 sec bins |
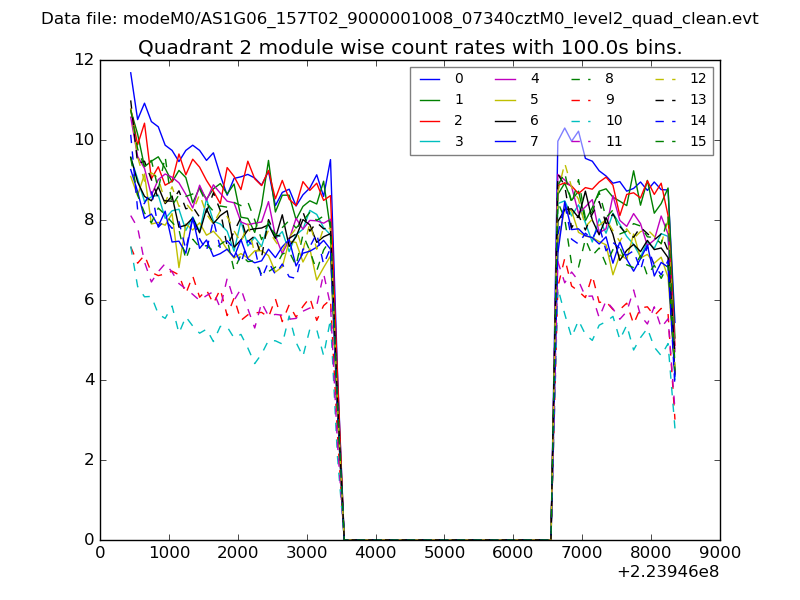 |
 |
| Module-wise count rates for Quadrant D Data is divided into 100 sec bins |
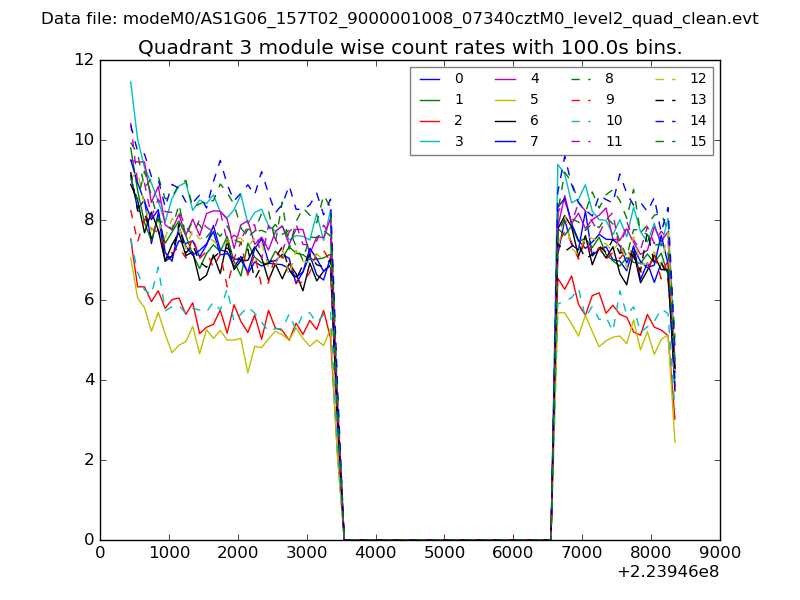 |
 |
| Parameter | Plot |
|---|---|
| CZT HV Monitor | 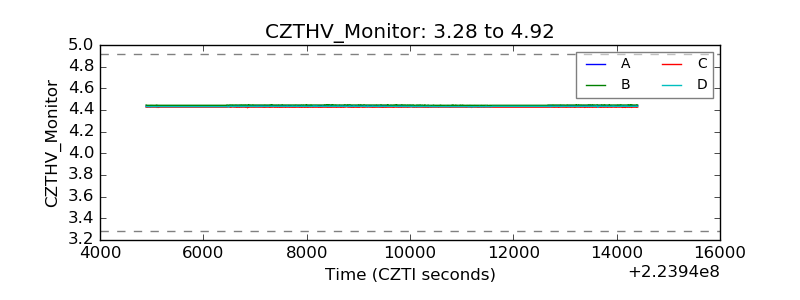 |
| D_VDD | 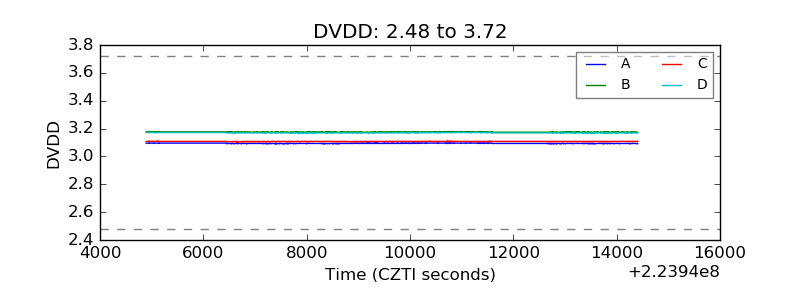 |
| Temperature 1 | 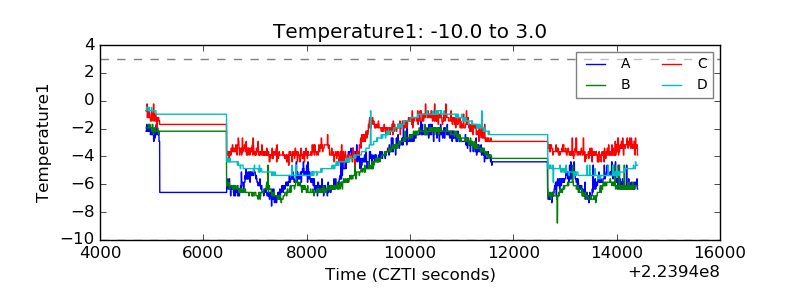 |
| Veto HV Monitor | 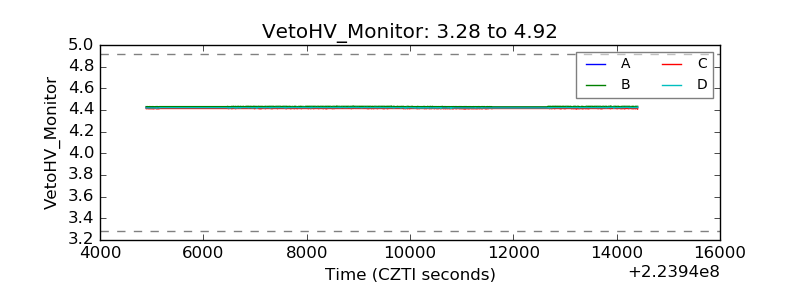 |
| Veto LLD | 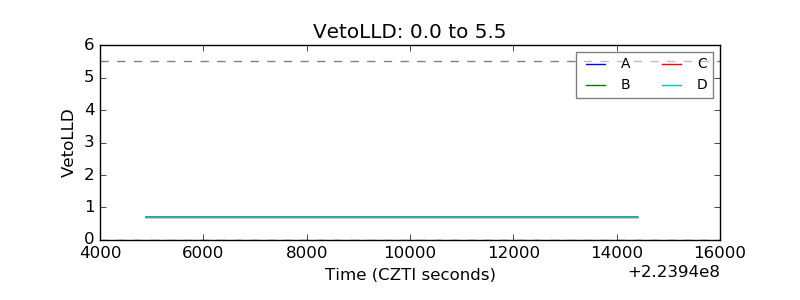 |
| Alpha Counter | 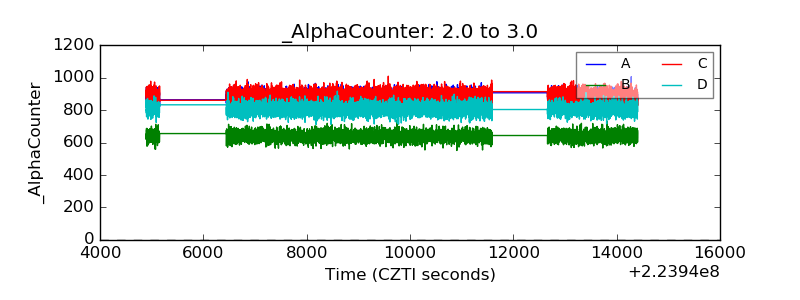 |
| _CPM_Rate | 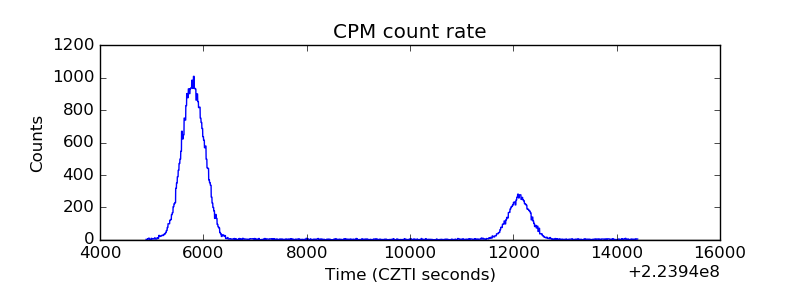 |
| CZT Counter |  |
| +2.5 Volts monitor |  |
| +5 Volts monitor |  |
| _ROLL_ROT | 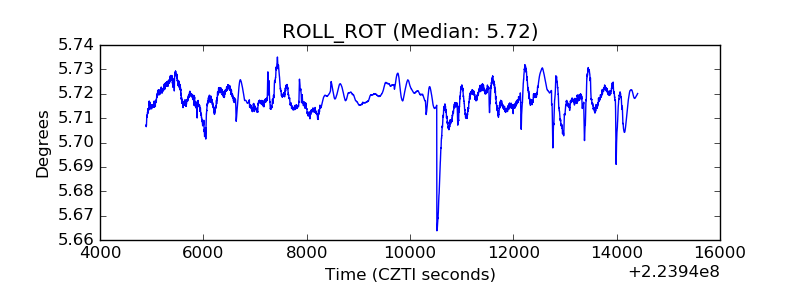 |
| _Roll_DEC | 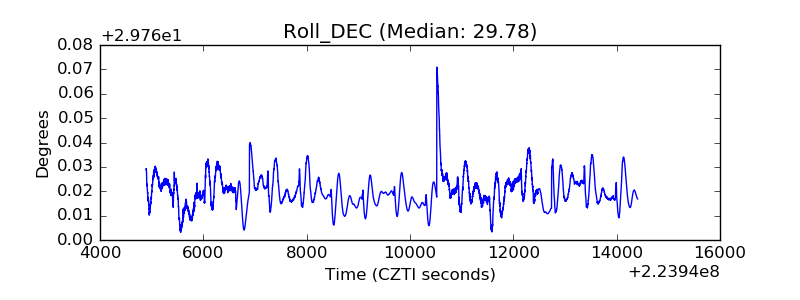 |
| _Roll_RA | 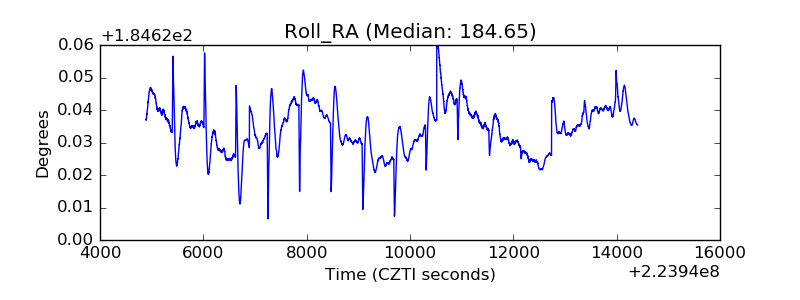 |
| Veto Counter | 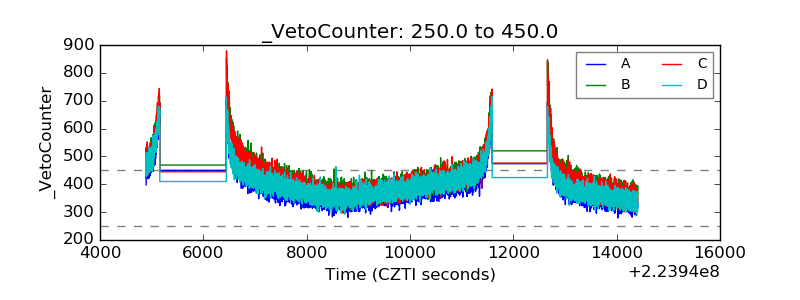 |