| Param | Original file | Final file |
|---|---|---|
| Filename | modeM0/AS1G06_157T02_9000001008_07341cztM0_level2.evt | modeM0/AS1G06_157T02_9000001008_07341cztM0_level2_quad_clean.evt |
| Size (bytes) | 829,895,040 | 159,704,640 |
| Size | 791.4 MB | 152.3 MB |
| Events in quadrant A | 5,760,687 | 992,872 |
| Events in quadrant B | 6,138,912 | 1,020,389 |
| Events in quadrant C | 5,772,300 | 1,002,708 |
| Events in quadrant D | 6,610,072 | 952,125 |
| Mode M0 | |||
|---|---|---|---|
| Quadrant | BADHDUFLAG | Total packets | Discarded packets |
| A | 0 | 26105 | 5 |
| B | 0 | 26980 | 4 |
| C | 0 | 26139 | 4 |
| D | 0 | 28566 | 4 |
| Mode SS | |||
|---|---|---|---|
| Quadrant | BADHDUFLAG | Total packets | Discarded packets |
| A | 0 | 256 | 0 |
| B | 0 | 256 | 0 |
| C | 0 | 256 | 0 |
| D | 0 | 256 | 0 |
| Mode M9 | |||
|---|---|---|---|
| Quadrant | BADHDUFLAG | Total packets | Discarded packets |
| A | 0 | 17 | 0 |
| B | 0 | 17 | 0 |
| C | 0 | 17 | 0 |
| D | 0 | 17 | 0 |
| Quadrant | Total seconds | Saturated seconds | Saturation percentage |
|---|---|---|---|
| A | 12566 | 135 | 1.074328% |
| B | 12566 | 167 | 1.328983% |
| C | 12566 | 71 | 0.565017% |
| D | 12566 | 162 | 1.289193% |
Noise dominated data is calculated using 1-second bins in cleaned event files. If a bin has >2000 counts, and if more than 50% of those come from <1% of pixels, then it is considered to be noise-dominated and hence unusable.
| Quadrant | # 1 sec bins | Bins with >0 counts | Bins with >2000 counts | High rate bins dominated by noise | Noise dominated (total time) | Noise dominated (detector-on time) | Marked lightcurve |
|---|---|---|---|---|---|---|---|
| A | 14291 | 12569 | 3 | 3 | 0.02% | 0.02% |  |
| B | 14291 | 12568 | 20 | 20 | 0.14% | 0.16% | 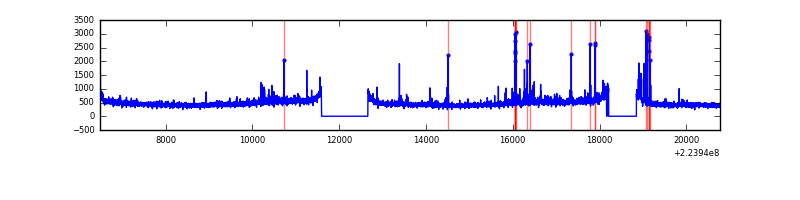 |
| C | 14291 | 12569 | 1 | 1 | 0.01% | 0.01% | 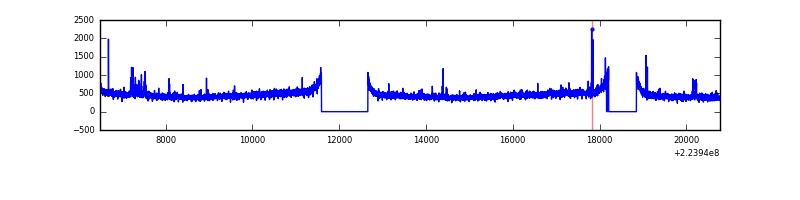 |
| D | 14291 | 12568 | 96 | 96 | 0.67% | 0.76% | 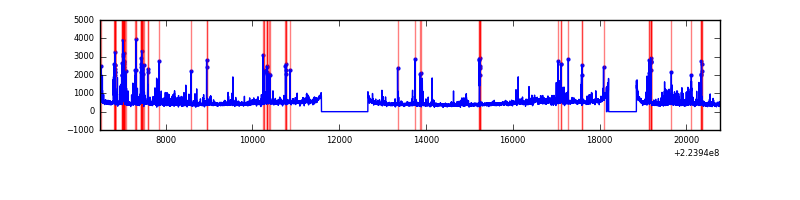 |
Top three noisy pixels from each quadrant. If the there are fewer than three noisy pixels in the level2.evt file, extra rows are filled as -1
| Pixel properties | Quadrant properties | ||||||
|---|---|---|---|---|---|---|---|
| Quadrant | DetID | PixID | Counts | Sigma | Mean | Median | Sigma |
| A | 14 | 111 | 50919 | 164.22 | 1472 | 1442 | 301.3 |
| A | 15 | 234 | 26519 | 83.23 | 1472 | 1442 | 301.3 |
| A | 13 | 248 | 15953 | 48.16 | 1472 | 1442 | 301.3 |
| B | 4 | 81 | 109907 | 380.47 | 1491 | 1454 | 285.0 |
| B | 0 | 214 | 89680 | 309.51 | 1491 | 1454 | 285.0 |
| B | 11 | 51 | 62947 | 215.73 | 1491 | 1454 | 285.0 |
| C | 9 | 68 | 146945 | 435.86 | 1435 | 1444 | 333.8 |
| C | 13 | 61 | 11232 | 29.32 | 1435 | 1444 | 333.8 |
| C | 14 | 234 | 10135 | 26.03 | 1435 | 1444 | 333.8 |
| D | 2 | 216 | 420240 | 1208.49 | 1420 | 1375 | 346.6 |
| D | 5 | 233 | 325530 | 935.23 | 1420 | 1375 | 346.6 |
| D | 8 | 195 | 176365 | 504.87 | 1420 | 1375 | 346.6 |
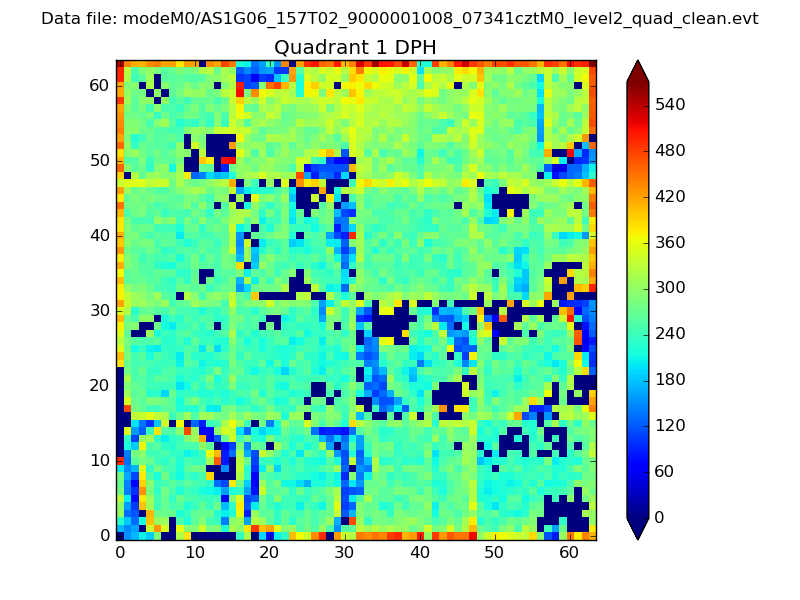
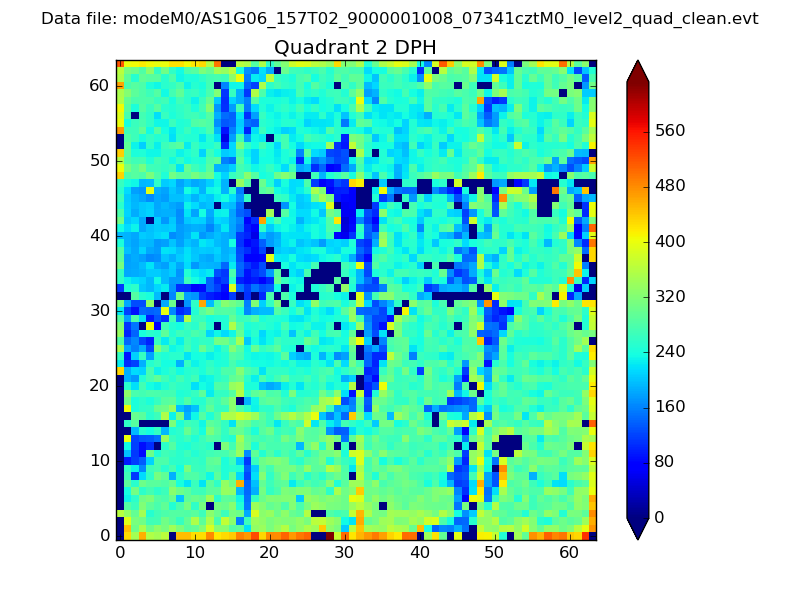
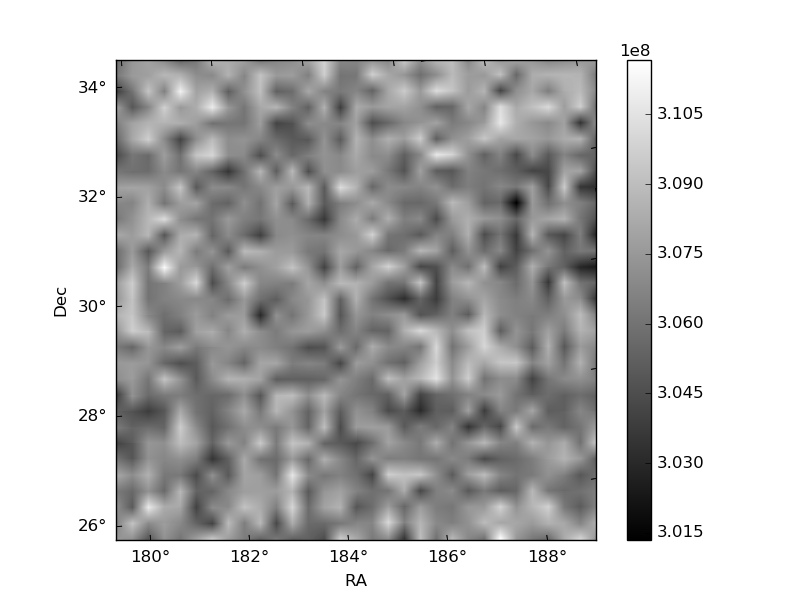
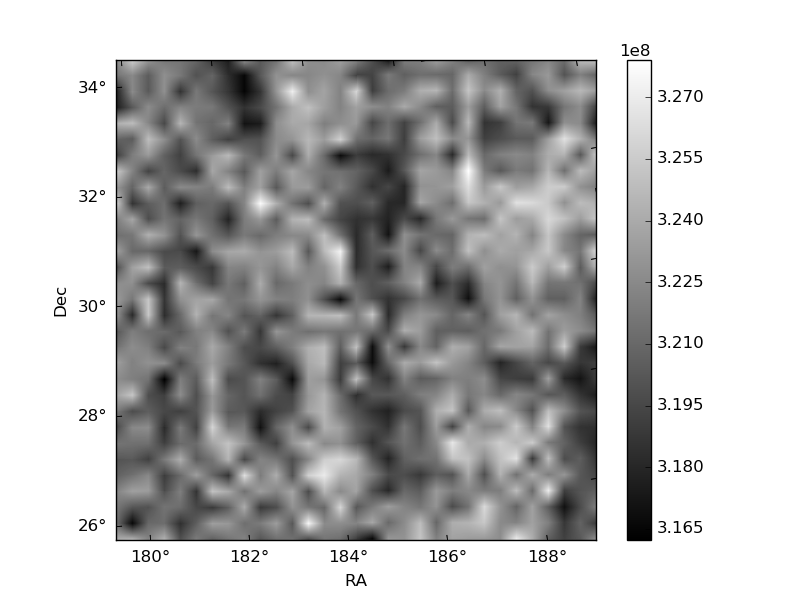
Histogram calculated using DETX and DETY for each event in the final _common_clean file
| Quadrant A |  |
 |
Quadrant B |
|---|---|---|---|
| Quadrant D | 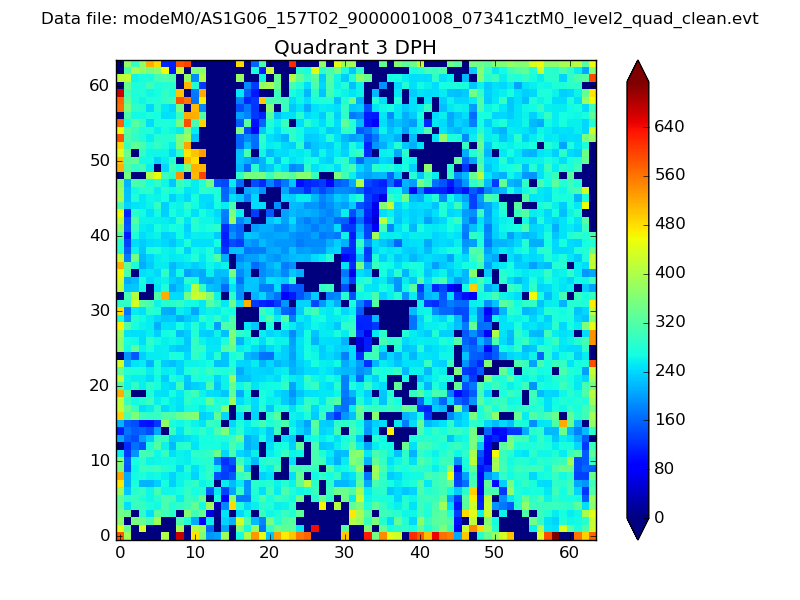 |
 |
Quadrant C |
| Plot type | Count rate plots | Images |
|---|---|---|
| Comparison with Poisson distribution Blue bars denote a histogram of data divided into 1 sec bins. Red curve is a Poisson curve with rate = median count rate of data. |
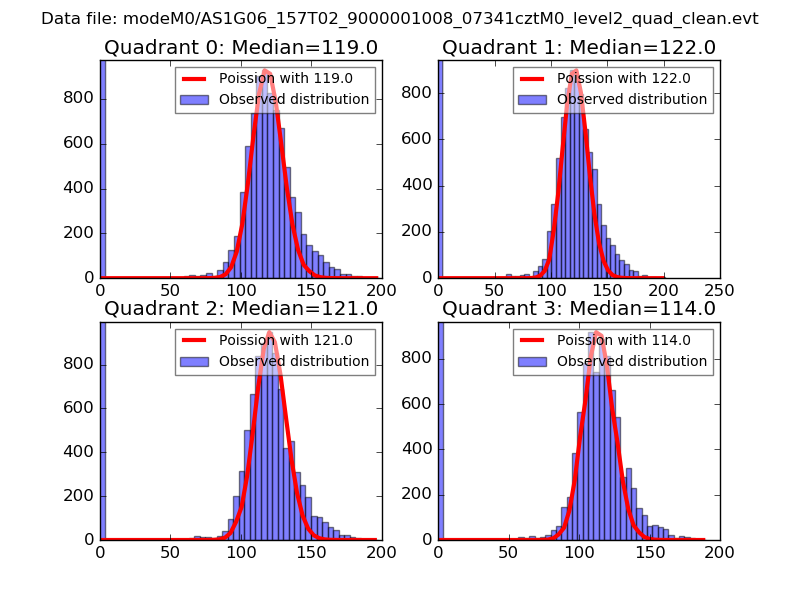 |
 |
| Quadrant-wise count rates Data is divided into 100 sec bins |
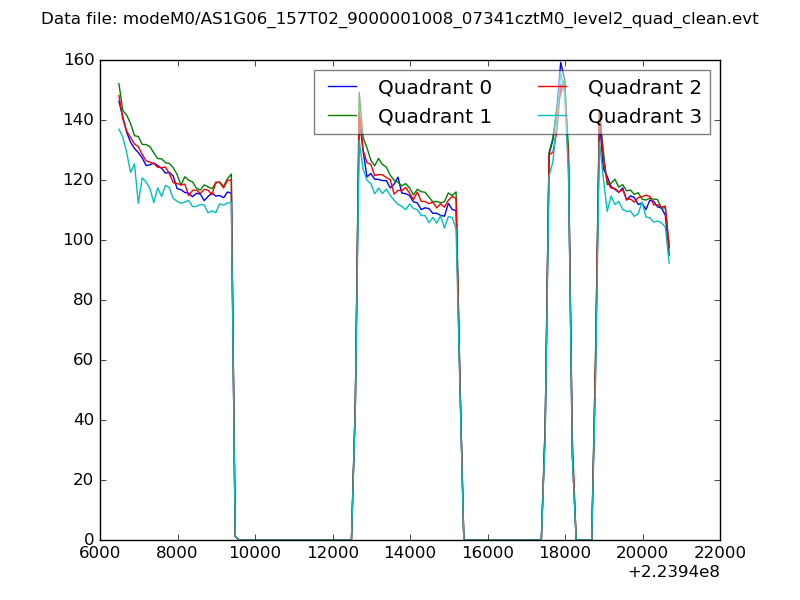 |
|
| Module-wise count rates for Quadrant A Data is divided into 100 sec bins |
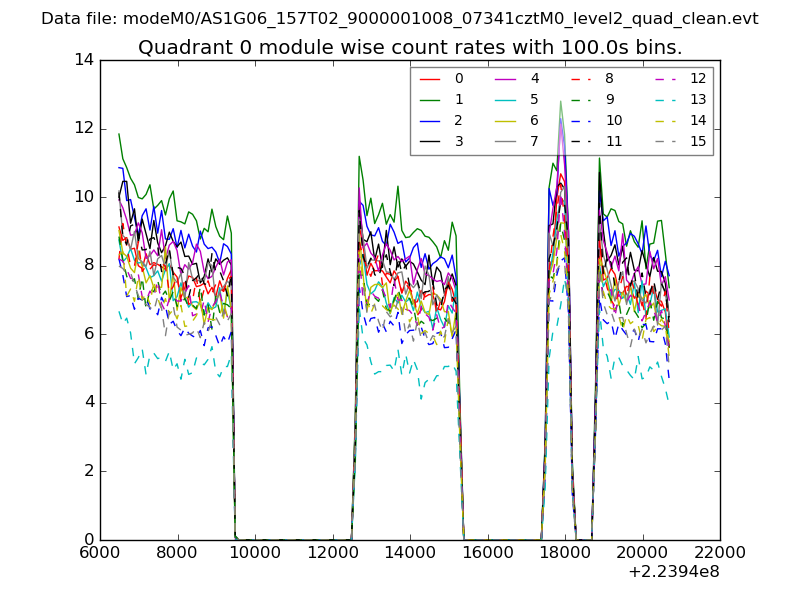 |
 |
| Module-wise count rates for Quadrant B Data is divided into 100 sec bins |
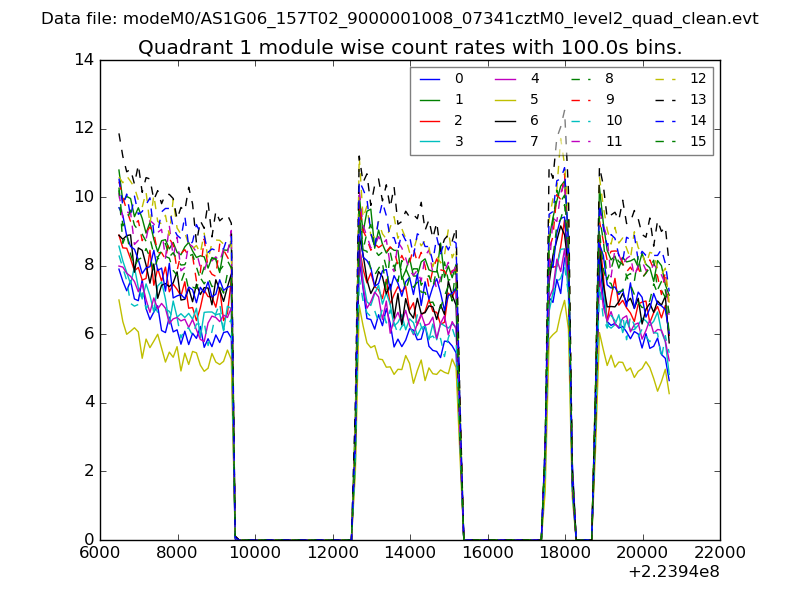 |
 |
| Module-wise count rates for Quadrant C Data is divided into 100 sec bins |
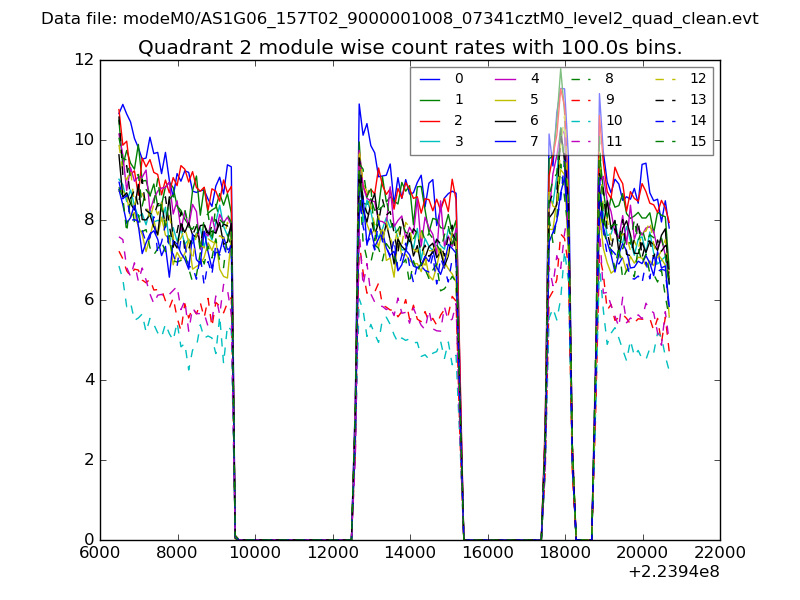 |
 |
| Module-wise count rates for Quadrant D Data is divided into 100 sec bins |
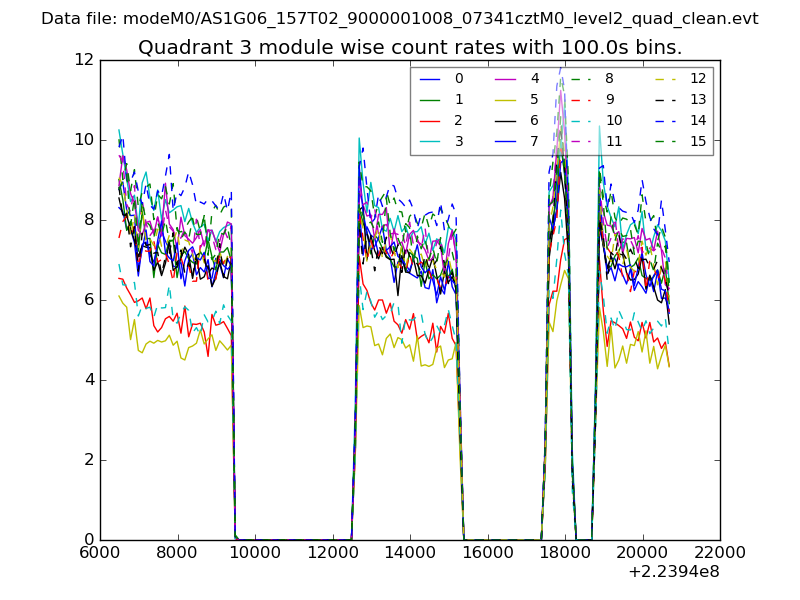 |
 |
| Parameter | Plot |
|---|---|
| CZT HV Monitor | 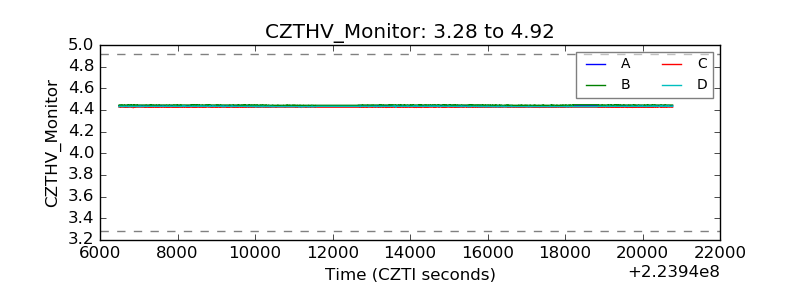 |
| D_VDD | 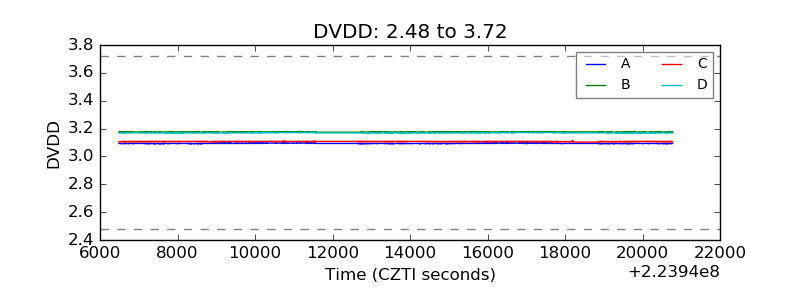 |
| Temperature 1 | 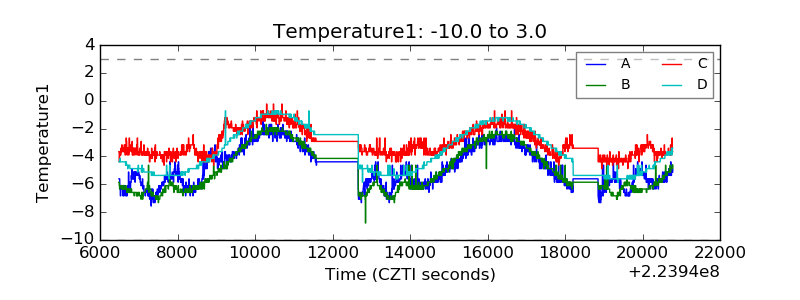 |
| Veto HV Monitor | 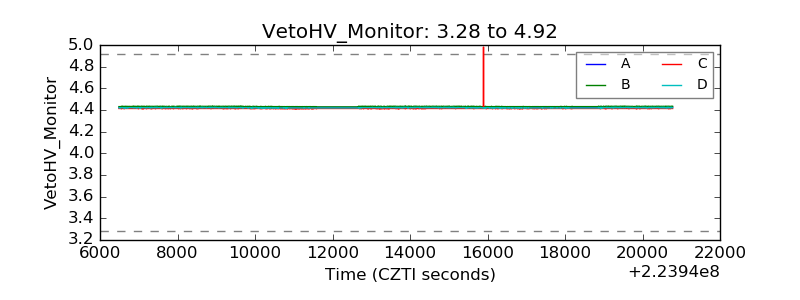 |
| Veto LLD | 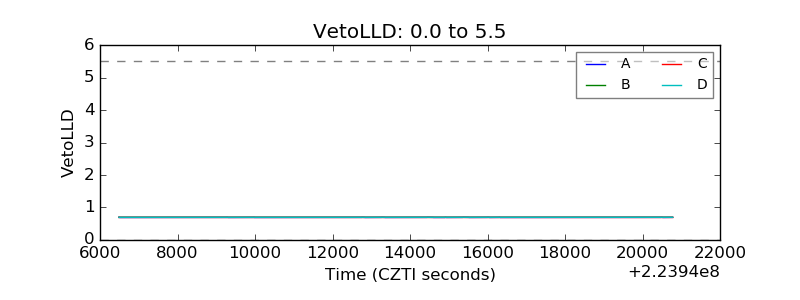 |
| Alpha Counter | 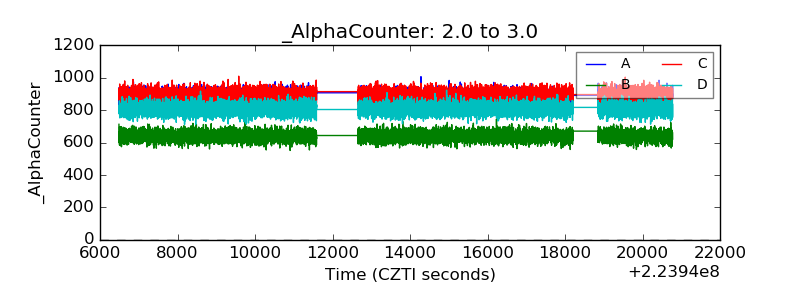 |
| _CPM_Rate | 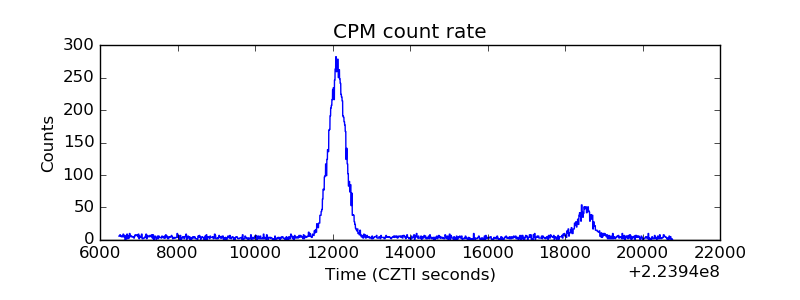 |
| CZT Counter | 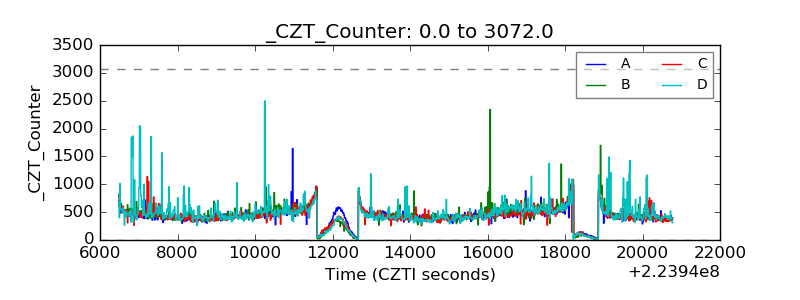 |
| +2.5 Volts monitor |  |
| +5 Volts monitor |  |
| _ROLL_ROT | 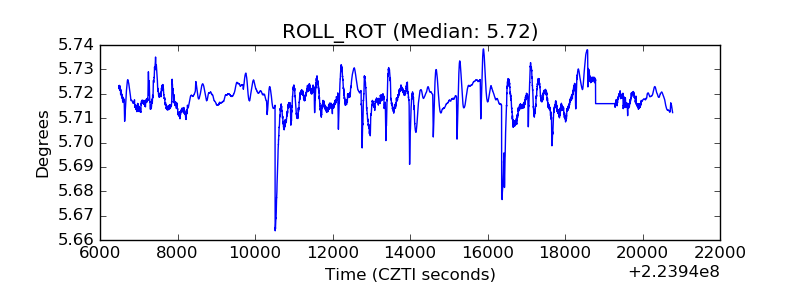 |
| _Roll_DEC | 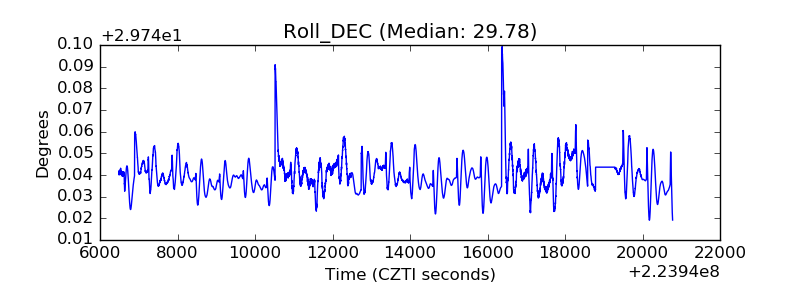 |
| _Roll_RA | 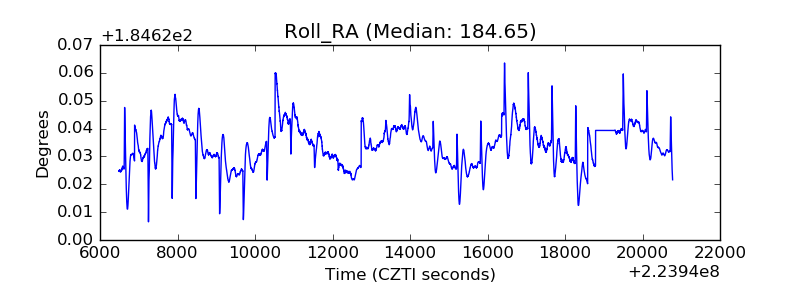 |
| Veto Counter | 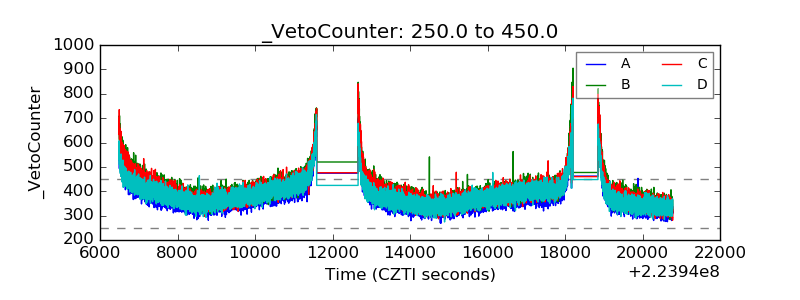 |