| Param | Original file | Final file |
|---|---|---|
| Filename | modeM0/AS1G06_157T02_9000001008_07342cztM0_level2.evt | modeM0/AS1G06_157T02_9000001008_07342cztM0_level2_quad_clean.evt |
| Size (bytes) | 504,875,520 | 96,871,680 |
| Size | 481.5 MB | 92.4 MB |
| Events in quadrant A | 3,345,101 | 605,715 |
| Events in quadrant B | 3,612,922 | 618,849 |
| Events in quadrant C | 3,288,001 | 613,683 |
| Events in quadrant D | 4,542,667 | 581,607 |
| Mode M0 | |||
|---|---|---|---|
| Quadrant | BADHDUFLAG | Total packets | Discarded packets |
| A | 0 | 15210 | 2 |
| B | 0 | 15862 | 1 |
| C | 0 | 15218 | 1 |
| D | 0 | 18798 | 1 |
| Mode SS | |||
|---|---|---|---|
| Quadrant | BADHDUFLAG | Total packets | Discarded packets |
| A | 0 | 148 | 0 |
| B | 0 | 148 | 0 |
| C | 0 | 148 | 0 |
| D | 0 | 148 | 0 |
| Mode M9 | |||
|---|---|---|---|
| Quadrant | BADHDUFLAG | Total packets | Discarded packets |
| A | 0 | 2 | 0 |
| B | 0 | 2 | 0 |
| C | 0 | 2 | 0 |
| D | 0 | 2 | 0 |
| Quadrant | Total seconds | Saturated seconds | Saturation percentage |
|---|---|---|---|
| A | 7384 | 174 | 2.356446% |
| B | 7384 | 174 | 2.356446% |
| C | 7384 | 83 | 1.124052% |
| D | 7384 | 286 | 3.873239% |
Noise dominated data is calculated using 1-second bins in cleaned event files. If a bin has >2000 counts, and if more than 50% of those come from <1% of pixels, then it is considered to be noise-dominated and hence unusable.
| Quadrant | # 1 sec bins | Bins with >0 counts | Bins with >2000 counts | High rate bins dominated by noise | Noise dominated (total time) | Noise dominated (detector-on time) | Marked lightcurve |
|---|---|---|---|---|---|---|---|
| A | 7544 | 7385 | 1 | 1 | 0.01% | 0.01% | 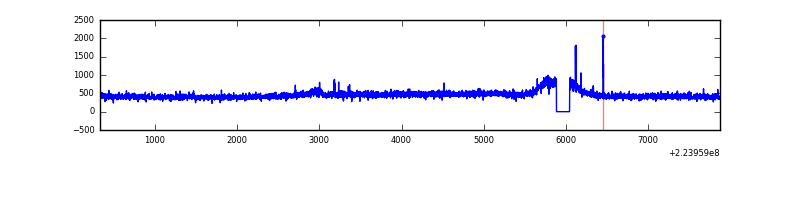 |
| B | 7544 | 7385 | 6 | 6 | 0.08% | 0.08% | 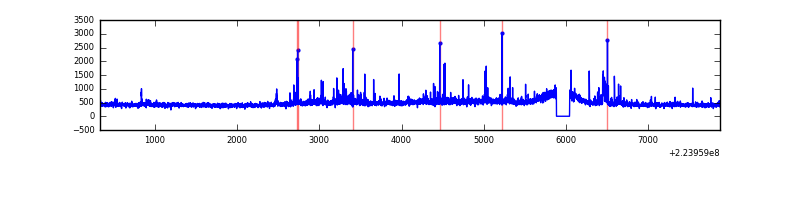 |
| C | 7544 | 7385 | 7 | 7 | 0.09% | 0.09% | 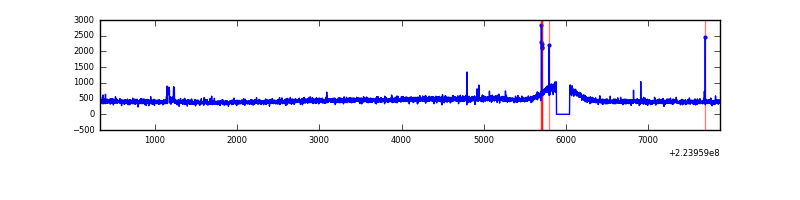 |
| D | 7544 | 7385 | 114 | 114 | 1.51% | 1.54% | 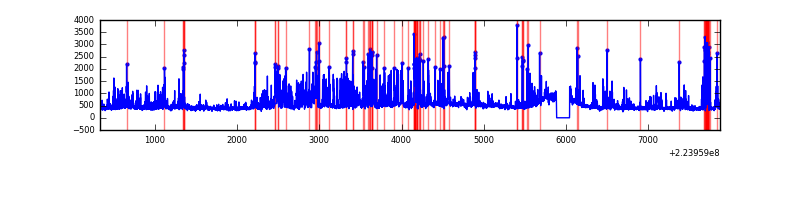 |
Top three noisy pixels from each quadrant. If the there are fewer than three noisy pixels in the level2.evt file, extra rows are filled as -1
| Pixel properties | Quadrant properties | ||||||
|---|---|---|---|---|---|---|---|
| Quadrant | DetID | PixID | Counts | Sigma | Mean | Median | Sigma |
| A | 15 | 234 | 26726 | 146.59 | 857 | 836 | 176.6 |
| A | 15 | 239 | 16527 | 88.84 | 857 | 836 | 176.6 |
| A | 0 | 226 | 7914 | 40.08 | 857 | 836 | 176.6 |
| B | 4 | 81 | 91176 | 536.83 | 862 | 838 | 168.3 |
| B | 11 | 51 | 73463 | 431.57 | 862 | 838 | 168.3 |
| B | 0 | 214 | 47897 | 279.65 | 862 | 838 | 168.3 |
| C | 9 | 68 | 42585 | 214.92 | 830 | 833 | 194.3 |
| C | 13 | 61 | 6592 | 29.64 | 830 | 833 | 194.3 |
| C | 10 | 22 | 5331 | 23.15 | 830 | 833 | 194.3 |
| D | 2 | 216 | 1012057 | 4934.02 | 823 | 797 | 205.0 |
| D | 8 | 195 | 133488 | 647.41 | 823 | 797 | 205.0 |
| D | 2 | 14 | 109053 | 528.19 | 823 | 797 | 205.0 |
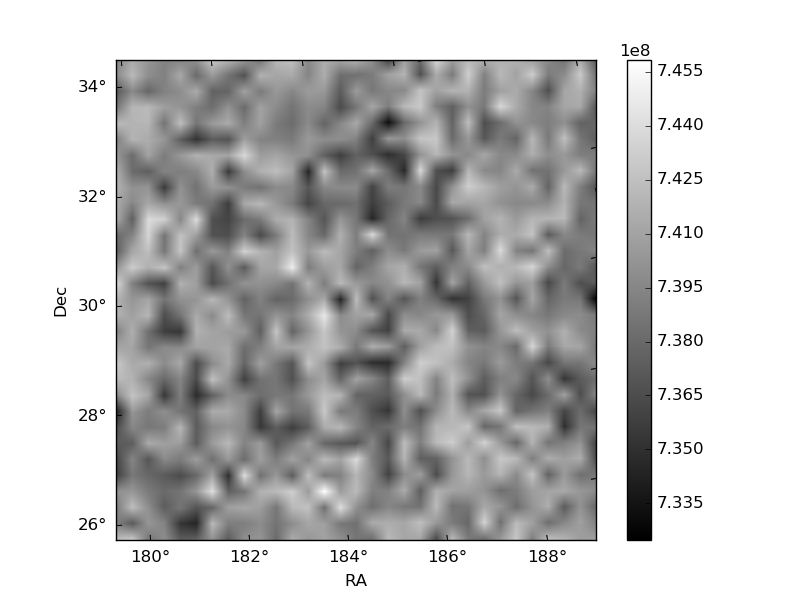
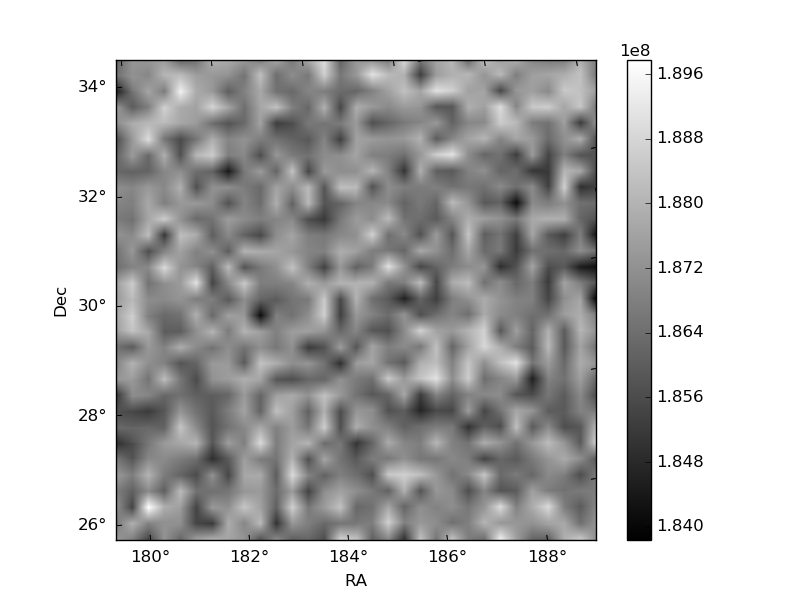
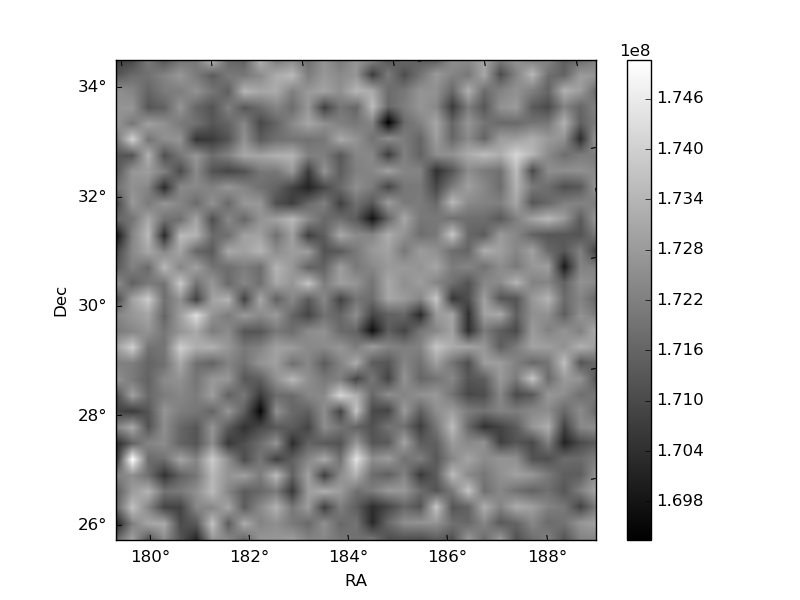
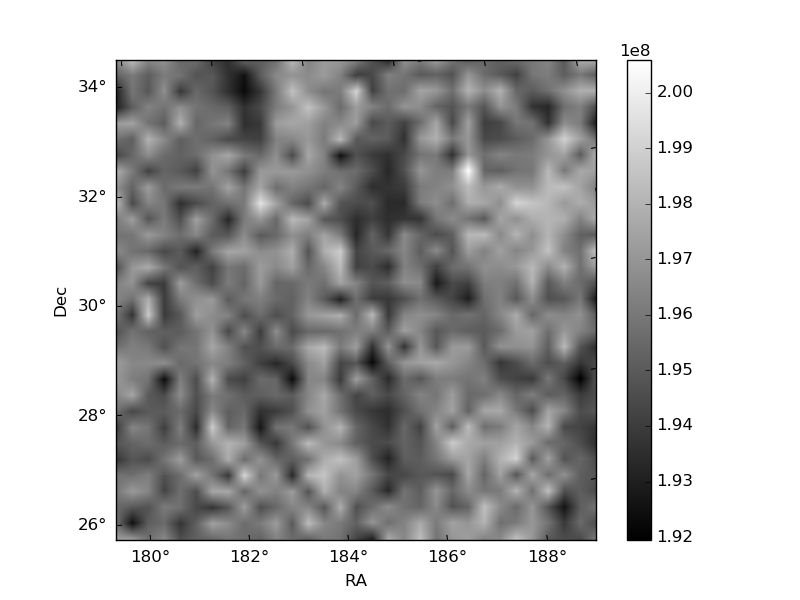
Histogram calculated using DETX and DETY for each event in the final _common_clean file
| Quadrant A | 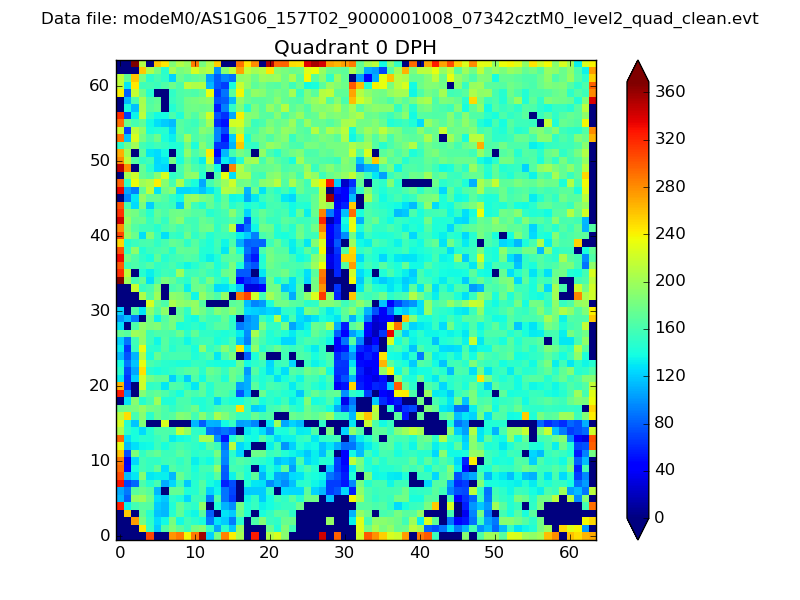 |
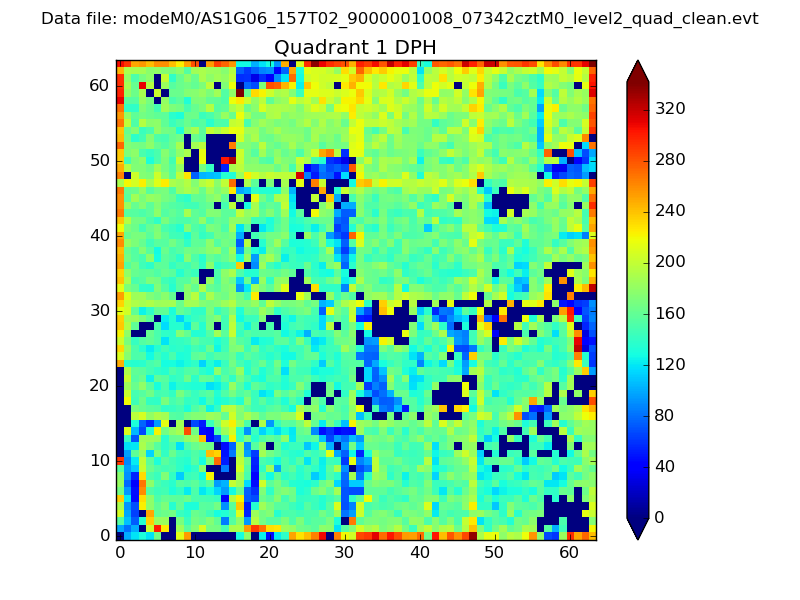 |
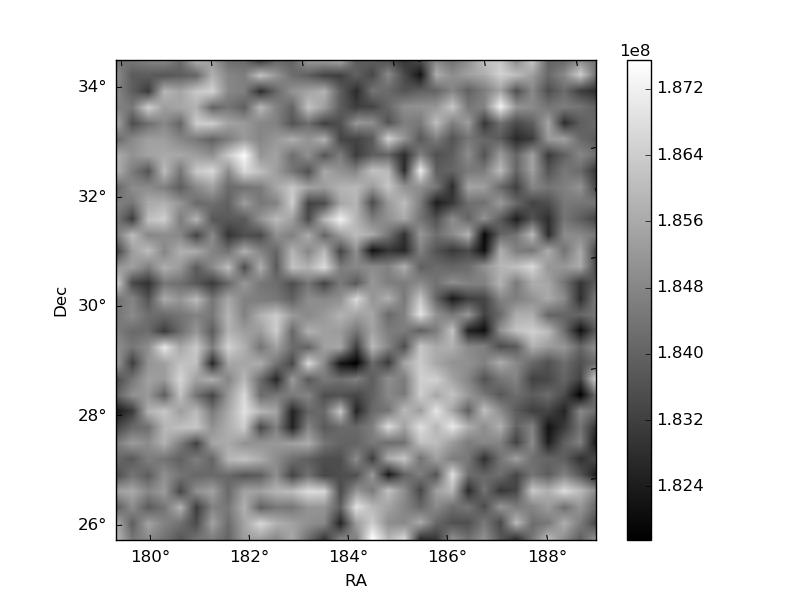
Quadrant B |
|---|---|---|---|
| Quadrant D | 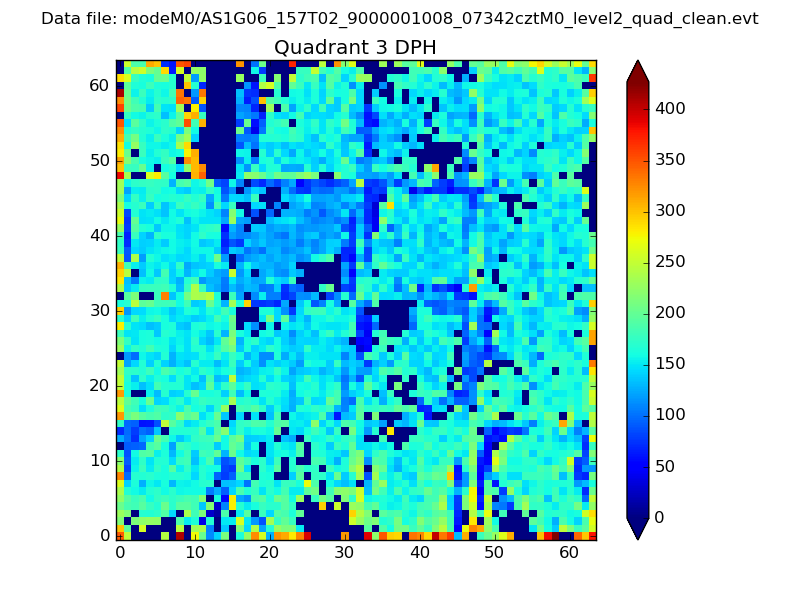 |
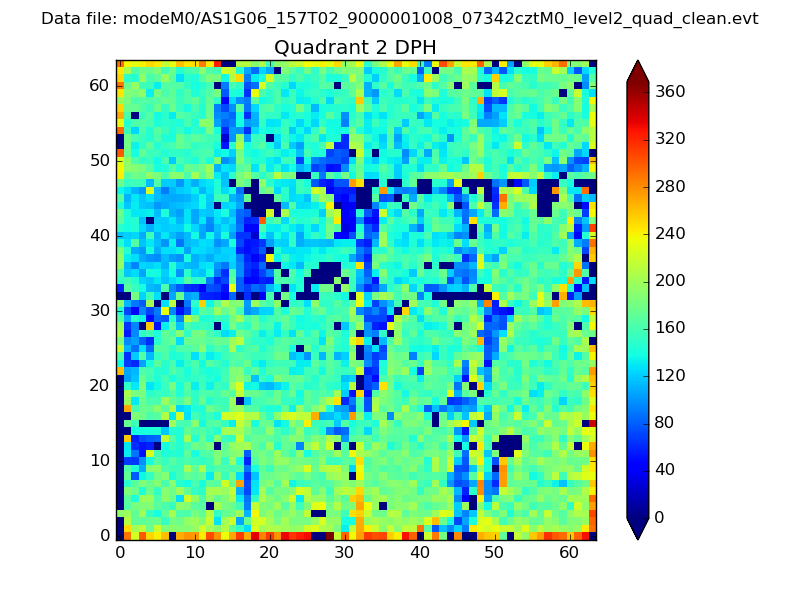 |
Quadrant C |
| Plot type | Count rate plots | Images |
|---|---|---|
| Comparison with Poisson distribution Blue bars denote a histogram of data divided into 1 sec bins. Red curve is a Poisson curve with rate = median count rate of data. |
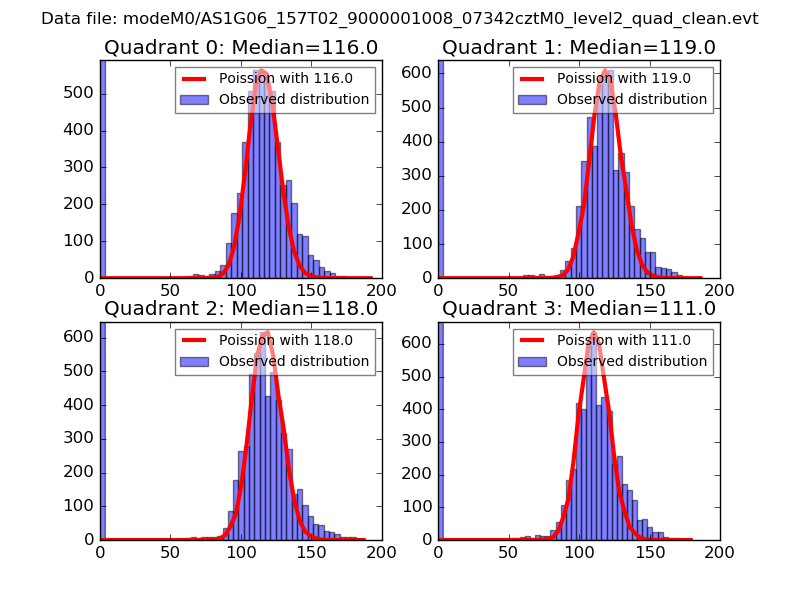 |
 |
| Quadrant-wise count rates Data is divided into 100 sec bins |
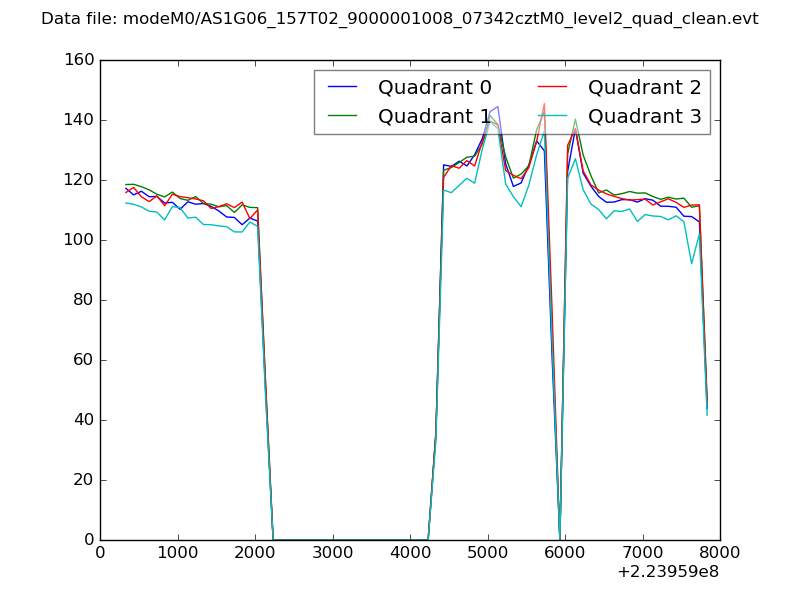 |
|
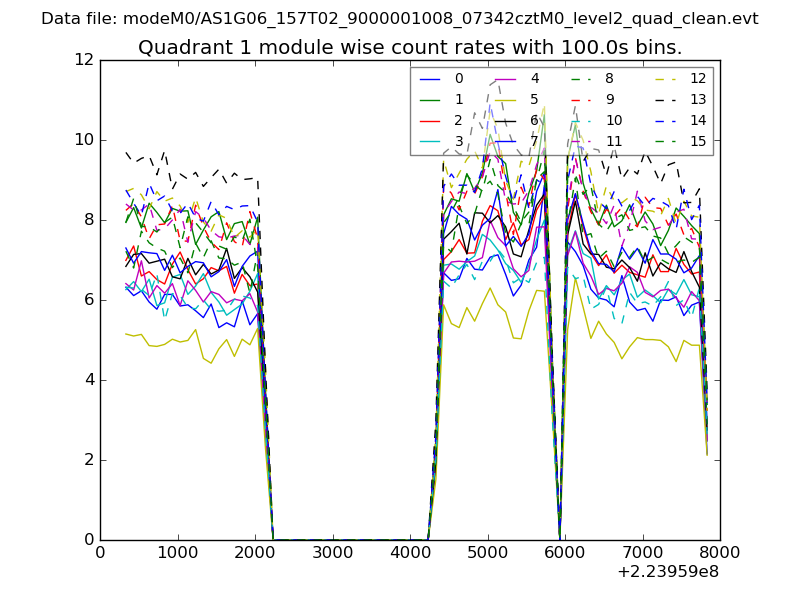
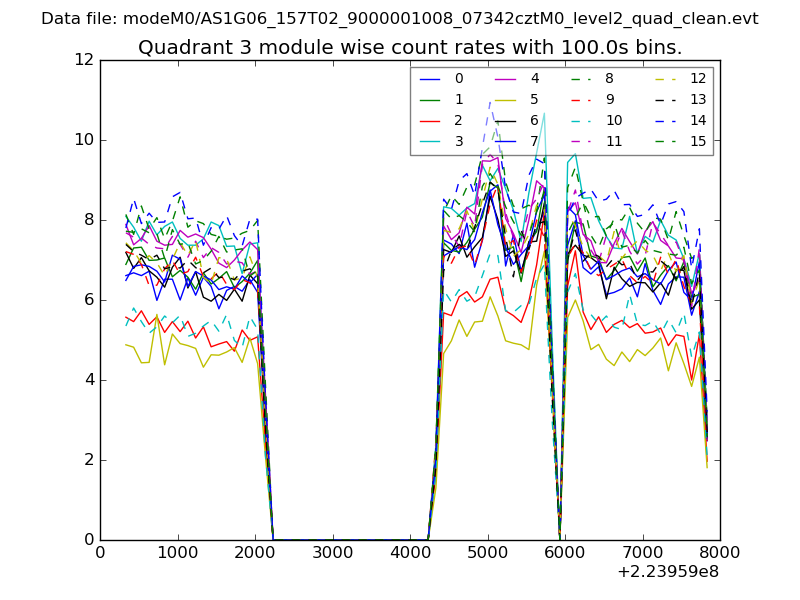
| Module-wise count rates for Quadrant A Data is divided into 100 sec bins |
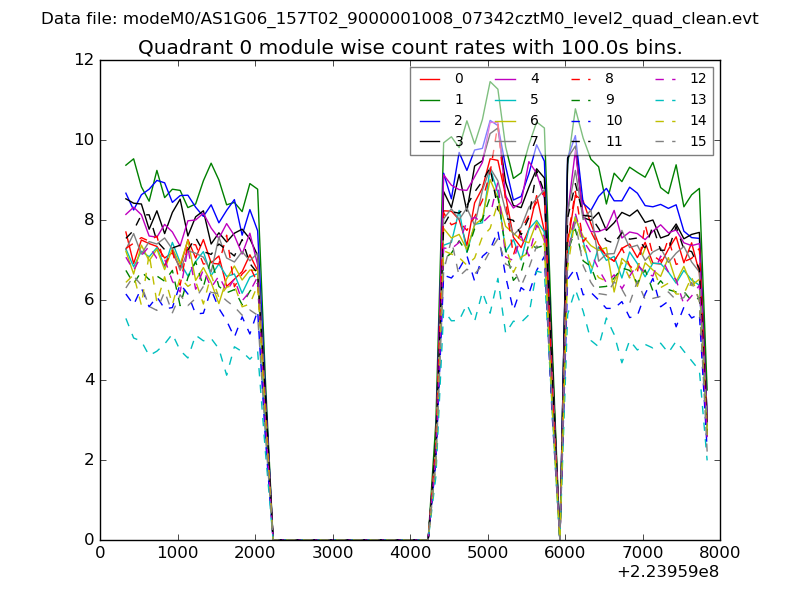 |
 |
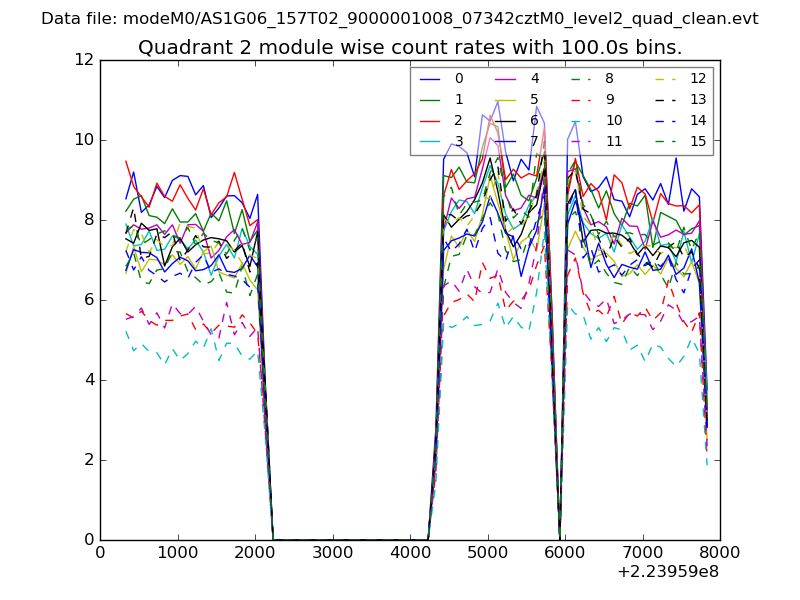
| Module-wise count rates for Quadrant B Data is divided into 100 sec bins |
 |
 |
| Module-wise count rates for Quadrant C Data is divided into 100 sec bins |
 |
 |
| Module-wise count rates for Quadrant D Data is divided into 100 sec bins |
 |
 |
| Parameter | Plot |
|---|---|
| CZT HV Monitor | 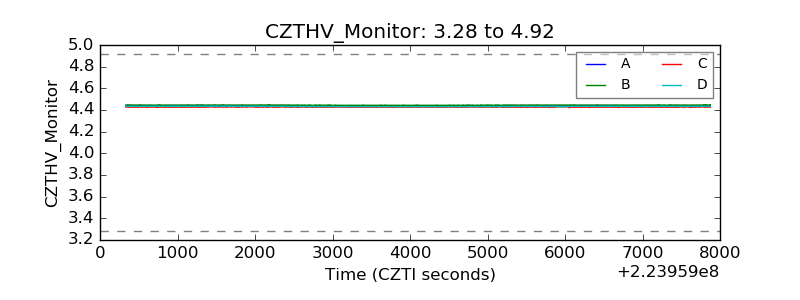 |
| D_VDD | 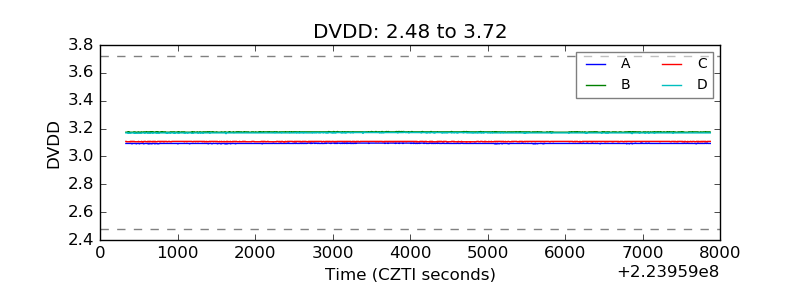 |
| Temperature 1 | 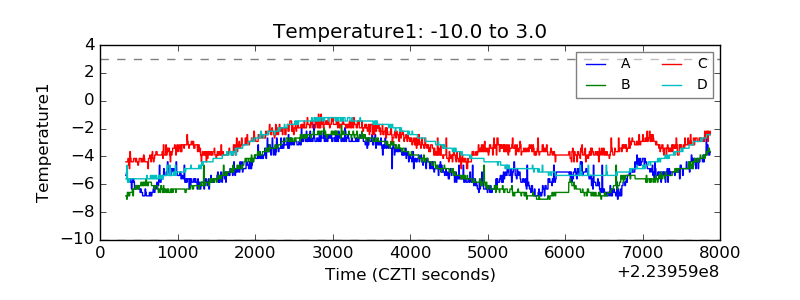 |
| Veto HV Monitor | 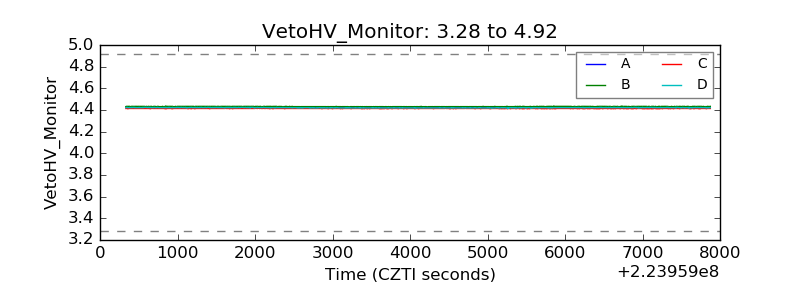 |
| Veto LLD | 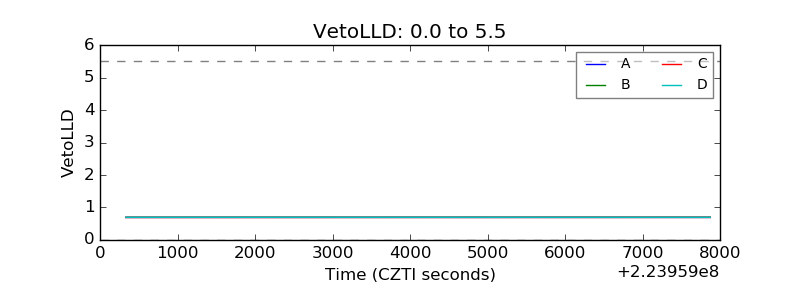 |
| Alpha Counter | 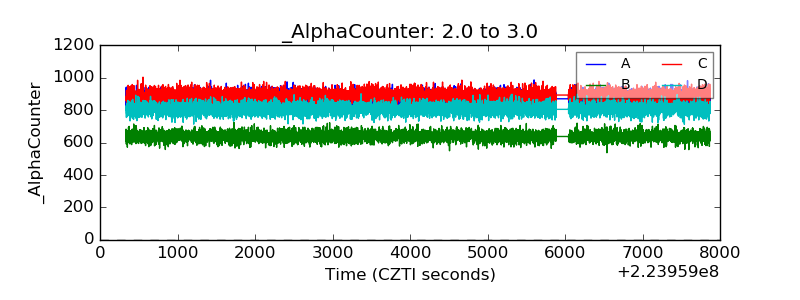 |
| _CPM_Rate | 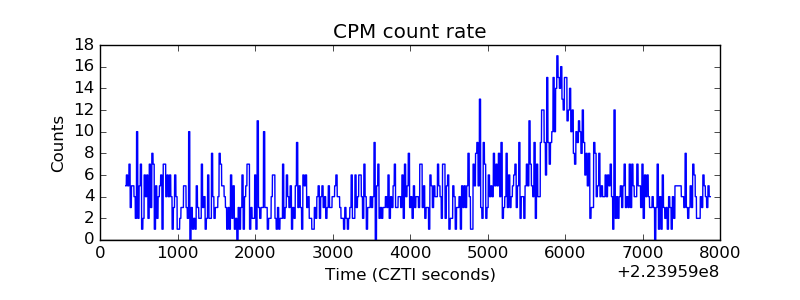 |
| CZT Counter | 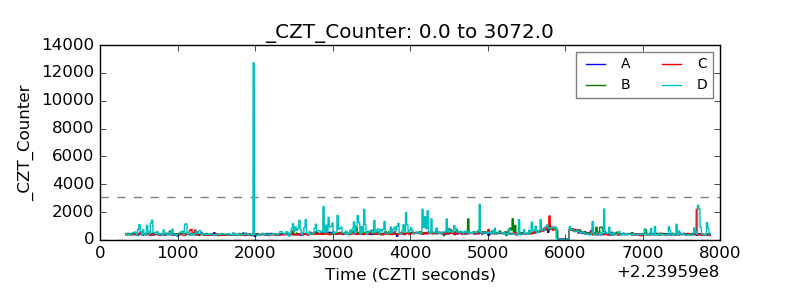 |
| +2.5 Volts monitor | 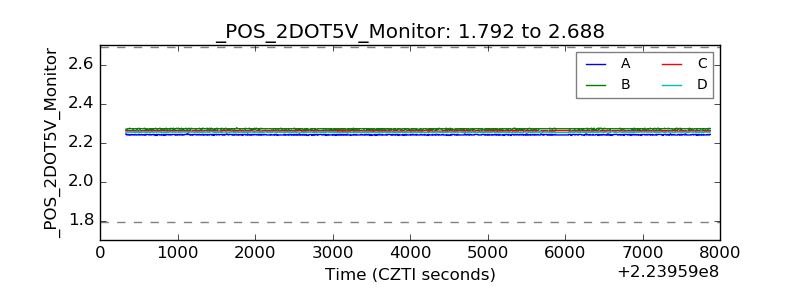 |
| +5 Volts monitor |  |
| _ROLL_ROT | 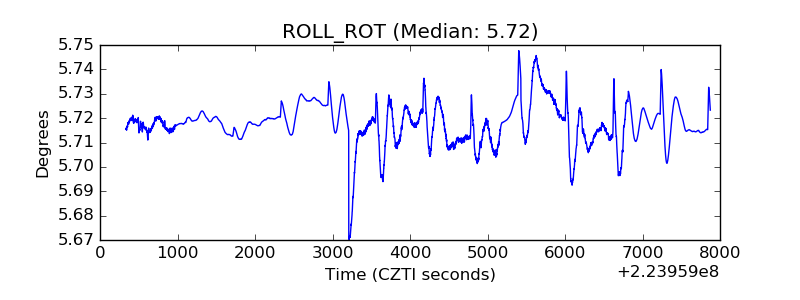 |
| _Roll_DEC | 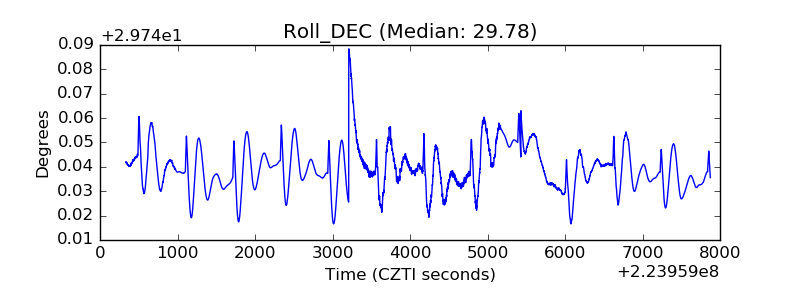 |
| _Roll_RA | 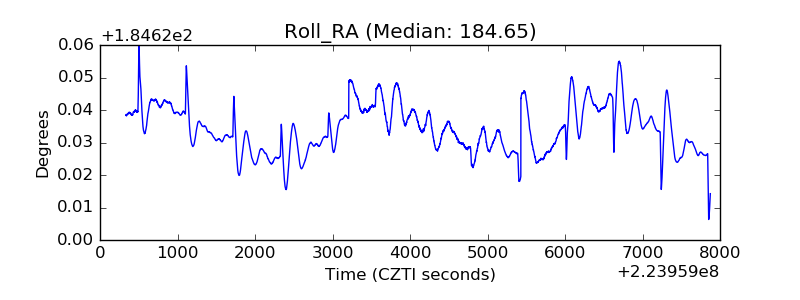 |
| Veto Counter | 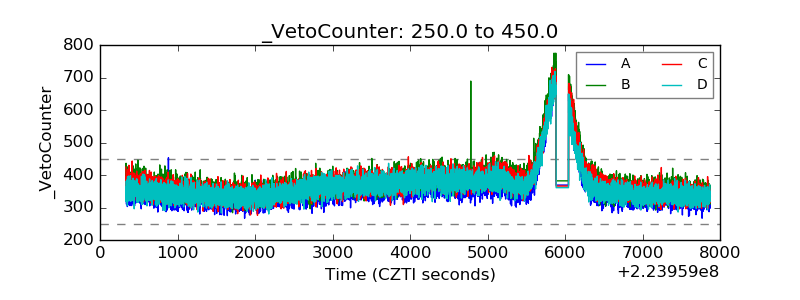 |