| Param | Original file | Final file |
|---|---|---|
| Filename | modeM0/AS1G06_157T02_9000001008_07343cztM0_level2.evt | modeM0/AS1G06_157T02_9000001008_07343cztM0_level2_quad_clean.evt |
| Size (bytes) | 882,953,280 | 168,465,600 |
| Size | 842.0 MB | 160.7 MB |
| Events in quadrant A | 5,959,121 | 1,052,825 |
| Events in quadrant B | 6,484,121 | 1,077,513 |
| Events in quadrant C | 5,864,881 | 1,066,742 |
| Events in quadrant D | 7,557,342 | 1,012,621 |
| Mode M0 | |||
|---|---|---|---|
| Quadrant | BADHDUFLAG | Total packets | Discarded packets |
| A | 0 | 27939 | 1041 |
| B | 0 | 29150 | 1067 |
| C | 0 | 27782 | 965 |
| D | 0 | 33233 | 1634 |
| Mode SS | |||
|---|---|---|---|
| Quadrant | BADHDUFLAG | Total packets | Discarded packets |
| A | 0 | 269 | 9 |
| B | 0 | 270 | 8 |
| C | 0 | 269 | 9 |
| D | 0 | 269 | 9 |
| Mode M9 | |||
|---|---|---|---|
| Quadrant | BADHDUFLAG | Total packets | Discarded packets |
| A | 0 | 2 | 0 |
| B | 0 | 2 | 0 |
| C | 0 | 2 | 0 |
| D | 0 | 2 | 0 |
| Quadrant | Total seconds | Saturated seconds | Saturation percentage |
|---|---|---|---|
| A | 12911 | 385 | 2.981953% |
| B | 12923 | 378 | 2.925017% |
| C | 12925 | 180 | 1.392650% |
| D | 12875 | 466 | 3.619417% |
Noise dominated data is calculated using 1-second bins in cleaned event files. If a bin has >2000 counts, and if more than 50% of those come from <1% of pixels, then it is considered to be noise-dominated and hence unusable.
| Quadrant | # 1 sec bins | Bins with >0 counts | Bins with >2000 counts | High rate bins dominated by noise | Noise dominated (total time) | Noise dominated (detector-on time) | Marked lightcurve |
|---|---|---|---|---|---|---|---|
| A | 13661 | 12996 | 2 | 2 | 0.01% | 0.02% | 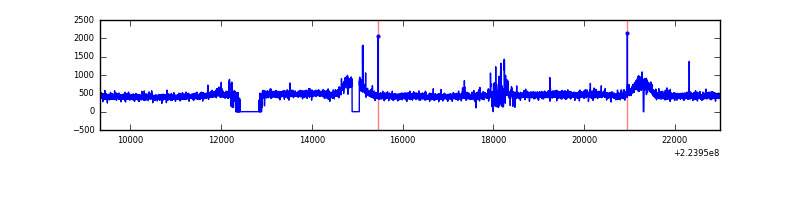 |
| B | 13661 | 13008 | 9 | 9 | 0.07% | 0.07% |  |
| C | 13661 | 13011 | 7 | 7 | 0.05% | 0.05% | 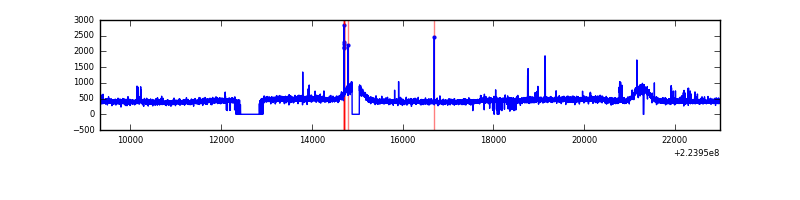 |
| D | 13661 | 12966 | 146 | 146 | 1.07% | 1.13% | 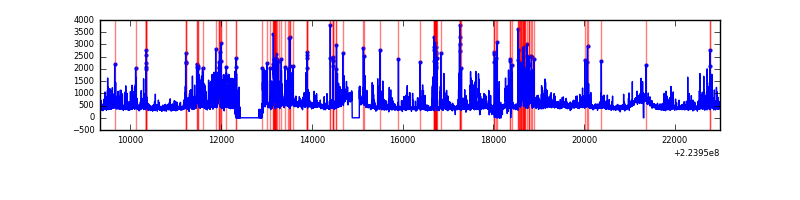 |
Top three noisy pixels from each quadrant. If the there are fewer than three noisy pixels in the level2.evt file, extra rows are filled as -1
| Pixel properties | Quadrant properties | ||||||
|---|---|---|---|---|---|---|---|
| Quadrant | DetID | PixID | Counts | Sigma | Mean | Median | Sigma |
| A | 15 | 234 | 114539 | 364.33 | 1512 | 1475 | 310.3 |
| A | 15 | 239 | 20511 | 61.34 | 1512 | 1475 | 310.3 |
| A | 0 | 226 | 14276 | 41.25 | 1512 | 1475 | 310.3 |
| B | 11 | 51 | 154627 | 521.14 | 1523 | 1483 | 293.9 |
| B | 0 | 214 | 130211 | 438.05 | 1523 | 1483 | 293.9 |
| B | 4 | 81 | 125640 | 422.5 | 1523 | 1483 | 293.9 |
| C | 9 | 68 | 98794 | 283.86 | 1471 | 1476 | 342.8 |
| C | 10 | 22 | 18315 | 49.12 | 1471 | 1476 | 342.8 |
| C | 13 | 61 | 11547 | 29.38 | 1471 | 1476 | 342.8 |
| D | 2 | 216 | 1278804 | 3507.42 | 1458 | 1406 | 364.2 |
| D | 12 | 233 | 278651 | 761.25 | 1458 | 1406 | 364.2 |
| D | 8 | 195 | 183282 | 499.39 | 1458 | 1406 | 364.2 |
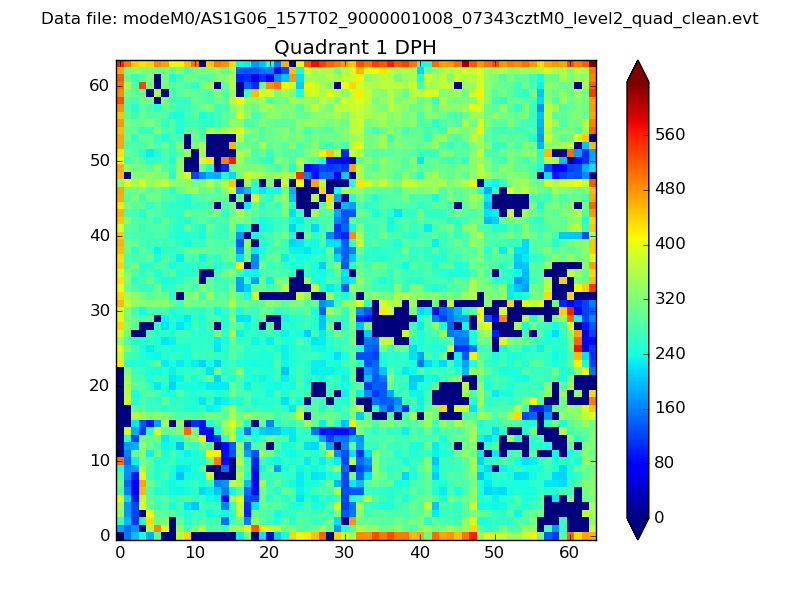
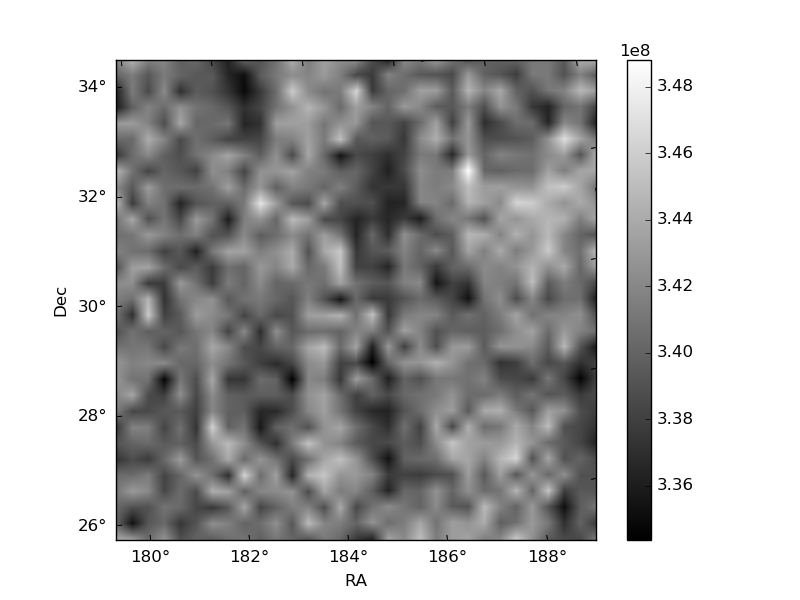
Histogram calculated using DETX and DETY for each event in the final _common_clean file
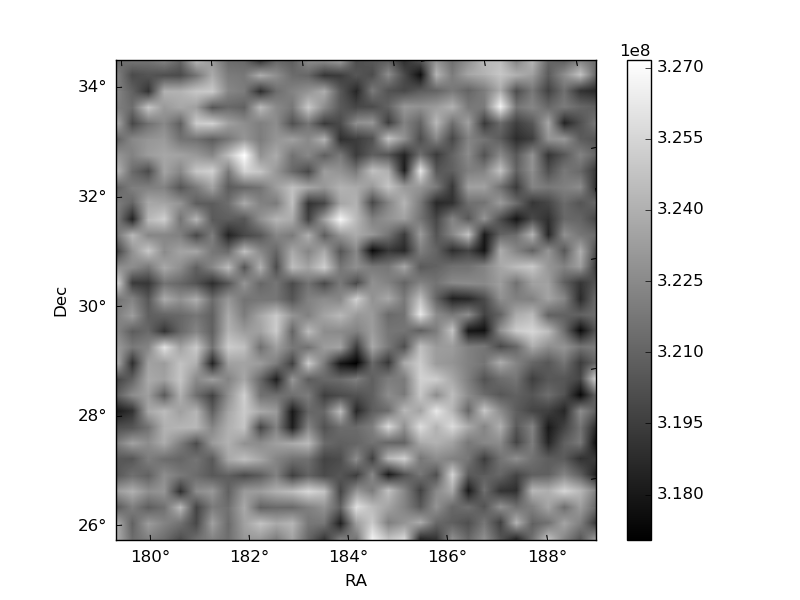
| Quadrant A |  |
 |
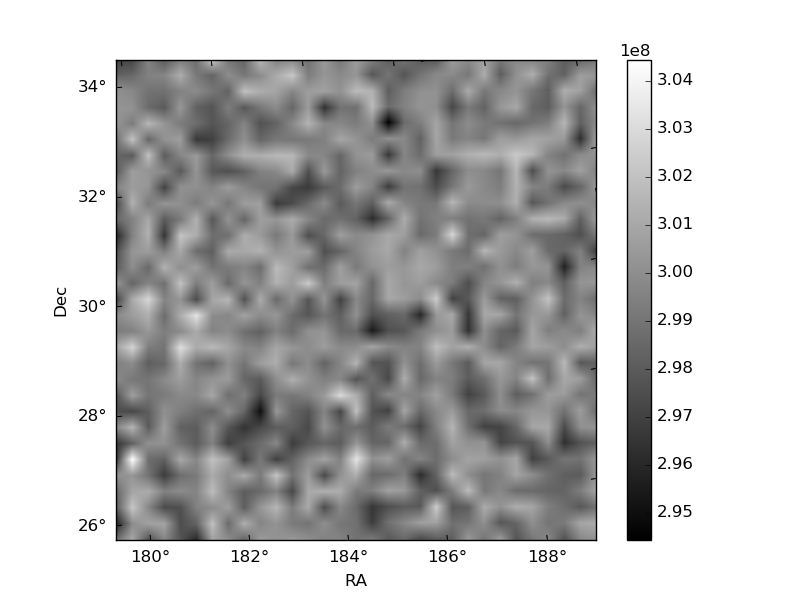
Quadrant B |
|---|---|---|---|
| Quadrant D |  |
 |
Quadrant C |
| Plot type | Count rate plots | Images |
|---|---|---|
| Comparison with Poisson distribution Blue bars denote a histogram of data divided into 1 sec bins. Red curve is a Poisson curve with rate = median count rate of data. |
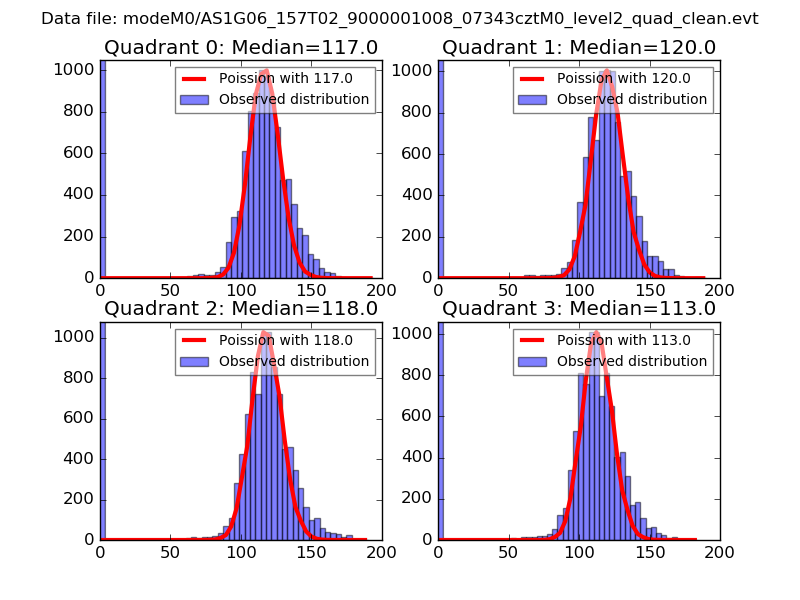 |
 |
| Quadrant-wise count rates Data is divided into 100 sec bins |
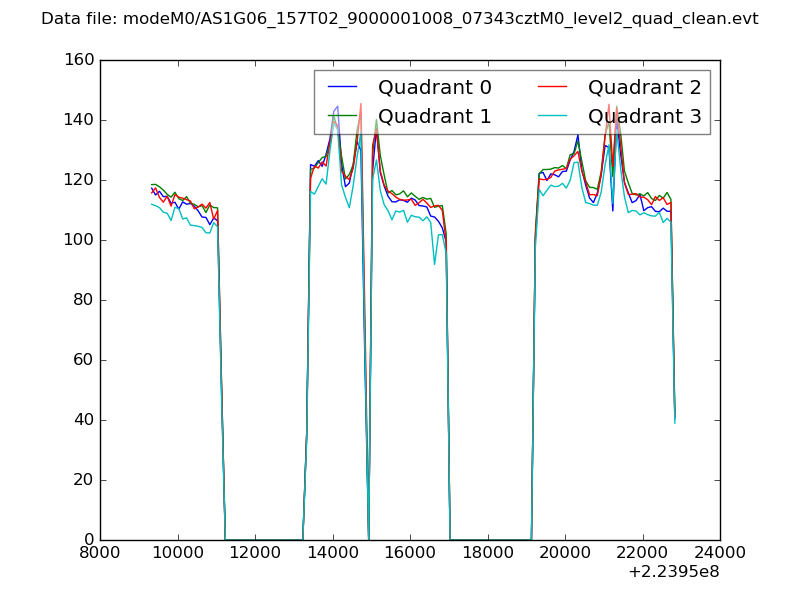 |
|
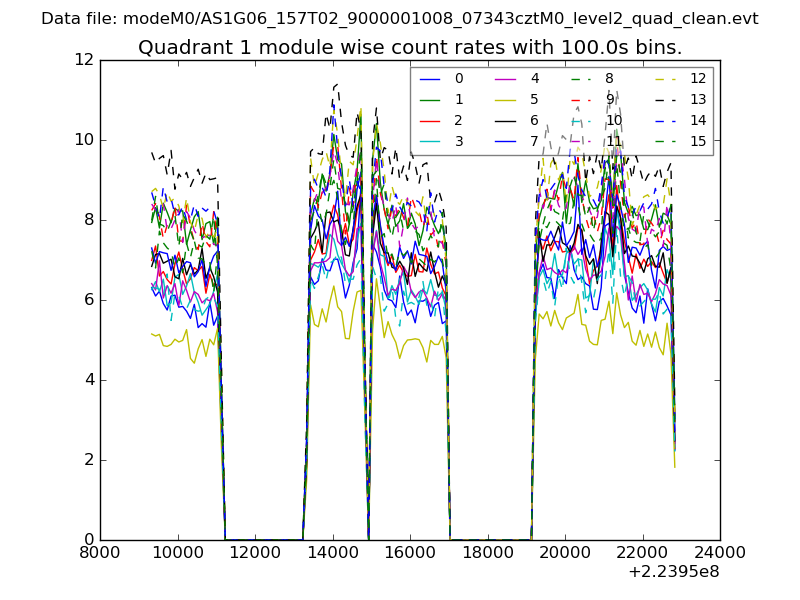
| Module-wise count rates for Quadrant A Data is divided into 100 sec bins |
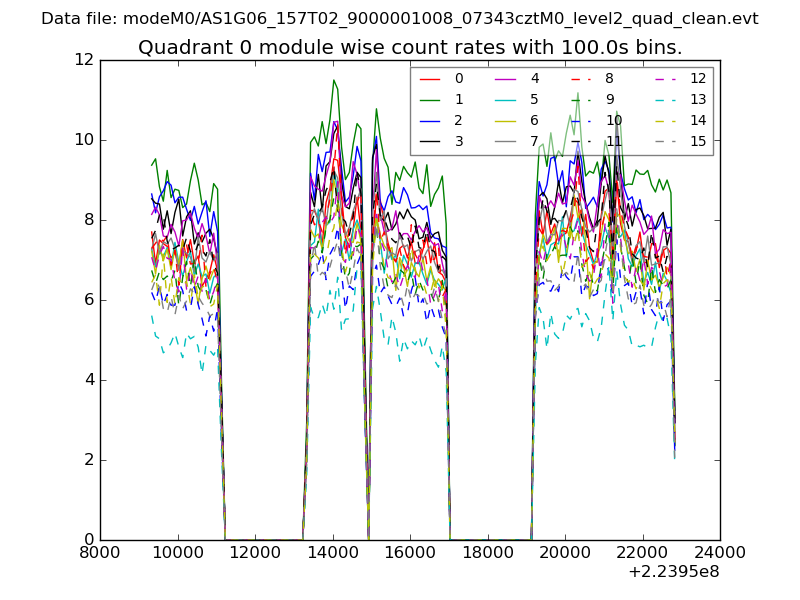 |
 |
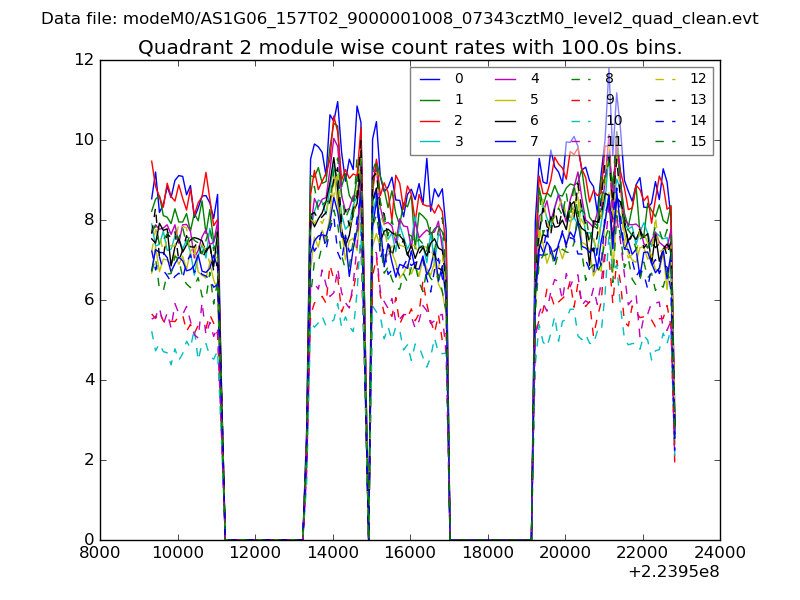
| Module-wise count rates for Quadrant B Data is divided into 100 sec bins |
 |
 |
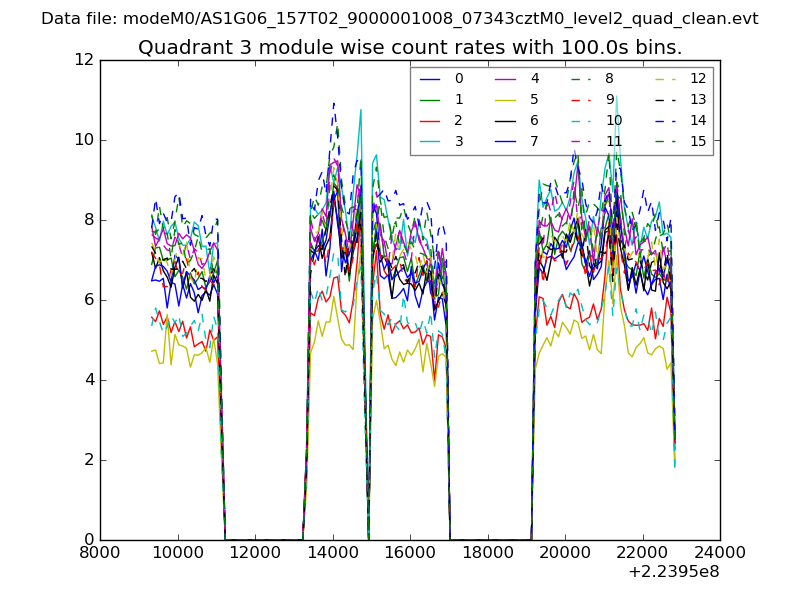
| Module-wise count rates for Quadrant C Data is divided into 100 sec bins |
 |
 |
| Module-wise count rates for Quadrant D Data is divided into 100 sec bins |
 |
 |
| Parameter | Plot |
|---|---|
| CZT HV Monitor | 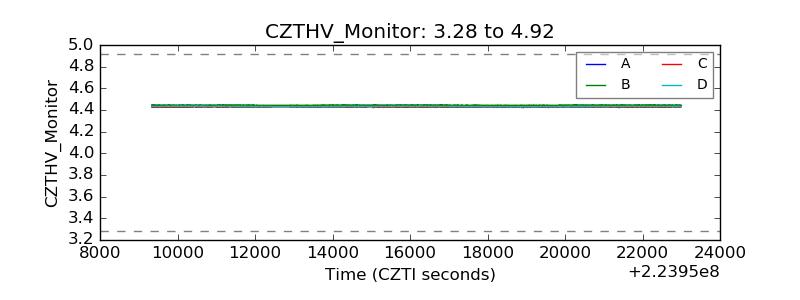 |
| D_VDD | 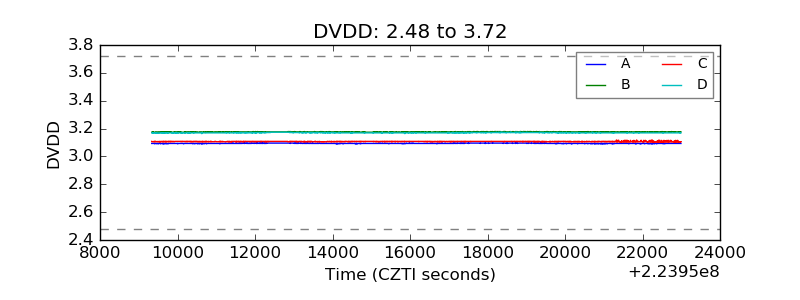 |
| Temperature 1 | 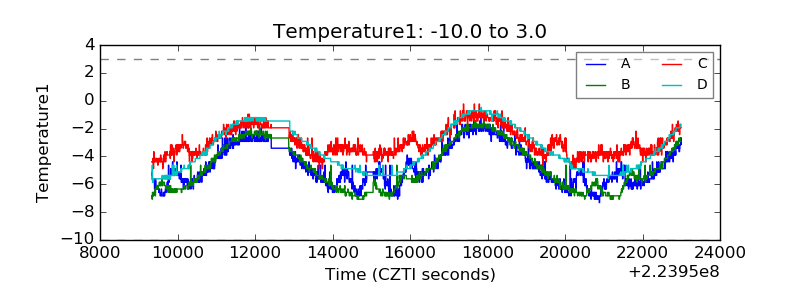 |
| Veto HV Monitor |  |
| Veto LLD | 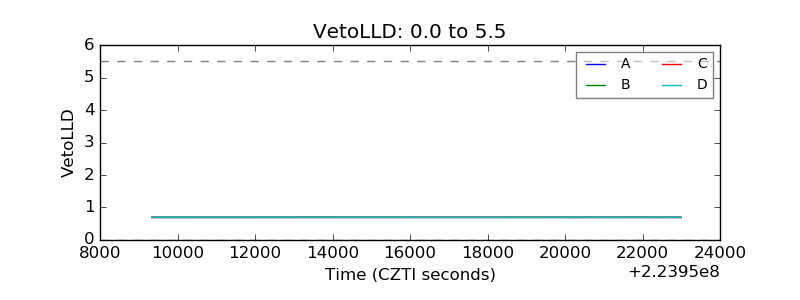 |
| Alpha Counter | 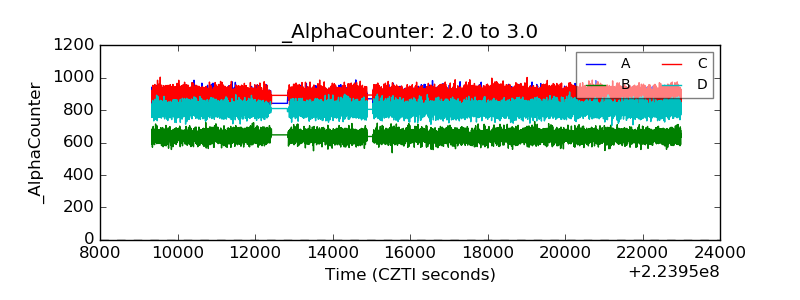 |
| _CPM_Rate | 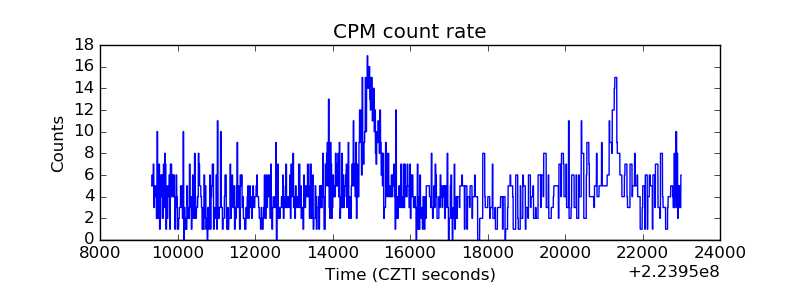 |
| CZT Counter |  |
| +2.5 Volts monitor |  |
| +5 Volts monitor |  |
| _ROLL_ROT | 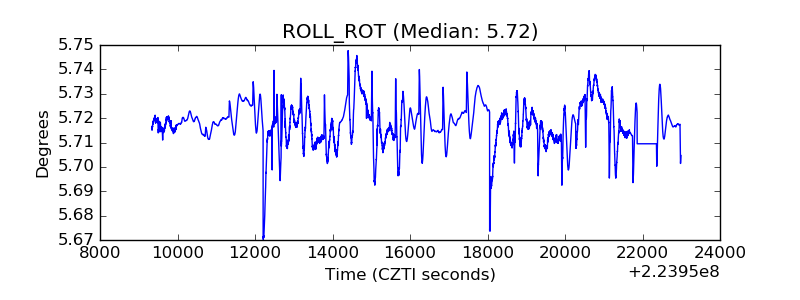 |
| _Roll_DEC | 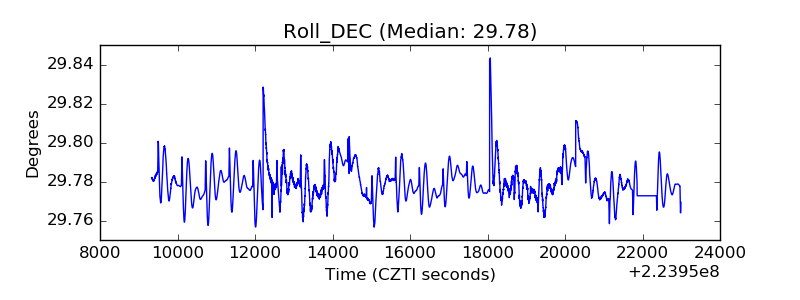 |
| _Roll_RA |  |
| Veto Counter | 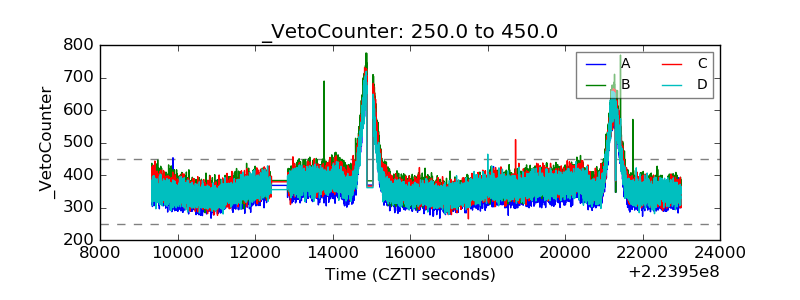 |