| Param | Original file | Final file |
|---|---|---|
| Filename | modeM0/AS1G06_157T02_9000001008_07348cztM0_level2.evt | modeM0/AS1G06_157T02_9000001008_07348cztM0_level2_quad_clean.evt |
| Size (bytes) | 458,521,920 | 68,503,680 |
| Size | 437.3 MB | 65.3 MB |
| Events in quadrant A | 3,146,692 | 406,828 |
| Events in quadrant B | 3,357,706 | 408,027 |
| Events in quadrant C | 3,189,377 | 408,484 |
| Events in quadrant D | 3,745,653 | 392,011 |
| Mode M0 | |||
|---|---|---|---|
| Quadrant | BADHDUFLAG | Total packets | Discarded packets |
| A | 0 | 13705 | 3 |
| B | 0 | 14405 | 2 |
| C | 0 | 13796 | 2 |
| D | 0 | 15777 | 2 |
| Mode SS | |||
|---|---|---|---|
| Quadrant | BADHDUFLAG | Total packets | Discarded packets |
| A | 0 | 134 | 0 |
| B | 0 | 134 | 0 |
| C | 0 | 134 | 0 |
| D | 0 | 134 | 0 |
| Mode M9 | |||
|---|---|---|---|
| Quadrant | BADHDUFLAG | Total packets | Discarded packets |
| A | 0 | 10 | 0 |
| B | 0 | 10 | 0 |
| C | 0 | 10 | 0 |
| D | 0 | 11 | 0 |
| Quadrant | Total seconds | Saturated seconds | Saturation percentage |
|---|---|---|---|
| A | 6577 | 60 | 0.912270% |
| B | 6577 | 78 | 1.185951% |
| C | 6577 | 47 | 0.714612% |
| D | 6577 | 143 | 2.174244% |
Noise dominated data is calculated using 1-second bins in cleaned event files. If a bin has >2000 counts, and if more than 50% of those come from <1% of pixels, then it is considered to be noise-dominated and hence unusable.
| Quadrant | # 1 sec bins | Bins with >0 counts | Bins with >2000 counts | High rate bins dominated by noise | Noise dominated (total time) | Noise dominated (detector-on time) | Marked lightcurve |
|---|---|---|---|---|---|---|---|
| A | 7607 | 6577 | 0 | 0 | 0.00% | 0.00% | 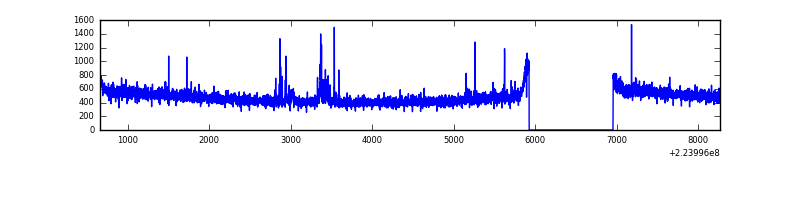 |
| B | 7607 | 6577 | 13 | 13 | 0.17% | 0.20% |  |
| C | 7607 | 6577 | 0 | 0 | 0.00% | 0.00% | 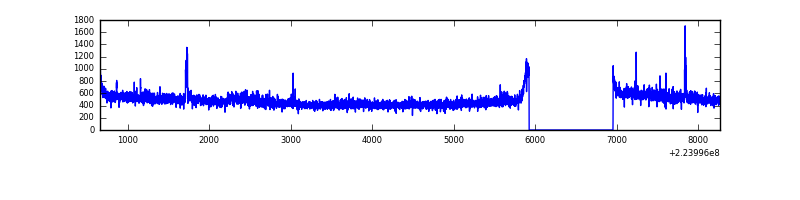 |
| D | 7607 | 6577 | 51 | 51 | 0.67% | 0.78% | 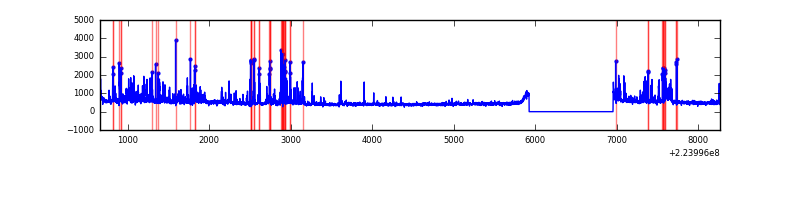 |
Top three noisy pixels from each quadrant. If the there are fewer than three noisy pixels in the level2.evt file, extra rows are filled as -1
| Pixel properties | Quadrant properties | ||||||
|---|---|---|---|---|---|---|---|
| Quadrant | DetID | PixID | Counts | Sigma | Mean | Median | Sigma |
| A | 15 | 234 | 54907 | 333.16 | 797 | 778 | 162.5 |
| A | 14 | 111 | 11613 | 66.69 | 797 | 778 | 162.5 |
| A | 15 | 239 | 9140 | 51.47 | 797 | 778 | 162.5 |
| B | 11 | 51 | 103428 | 667.42 | 800 | 780 | 153.8 |
| B | 0 | 214 | 93876 | 605.31 | 800 | 780 | 153.8 |
| B | 4 | 81 | 33408 | 212.15 | 800 | 780 | 153.8 |
| C | 9 | 68 | 134465 | 741.62 | 777 | 781 | 180.3 |
| C | 1 | 16 | 9250 | 46.98 | 777 | 781 | 180.3 |
| C | 1 | 3 | 8678 | 43.81 | 777 | 781 | 180.3 |
| D | 2 | 216 | 418523 | 2187.41 | 775 | 752 | 191.0 |
| D | 14 | 34 | 145725 | 759.07 | 775 | 752 | 191.0 |
| D | 8 | 195 | 115390 | 600.23 | 775 | 752 | 191.0 |
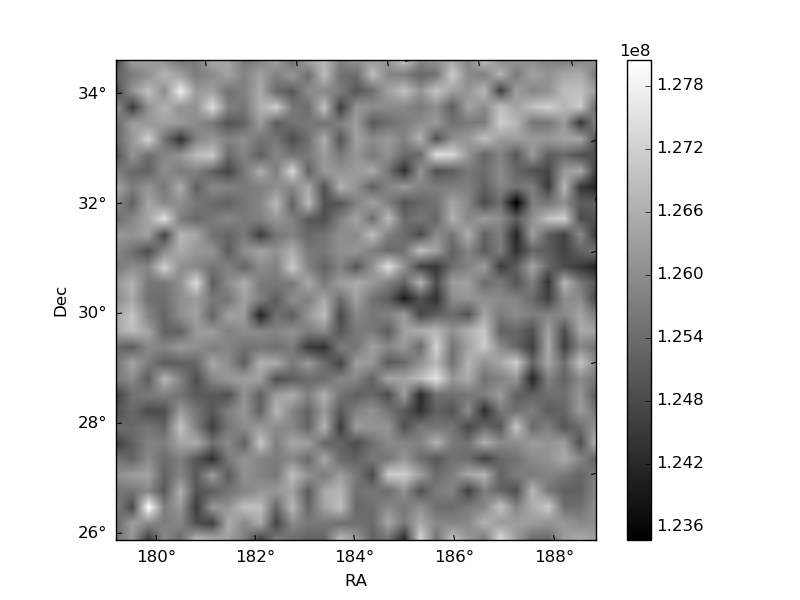
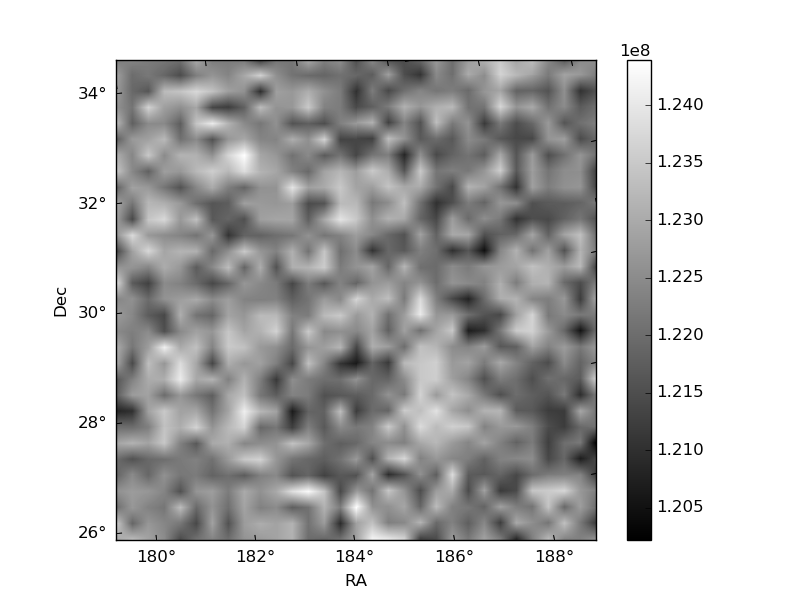
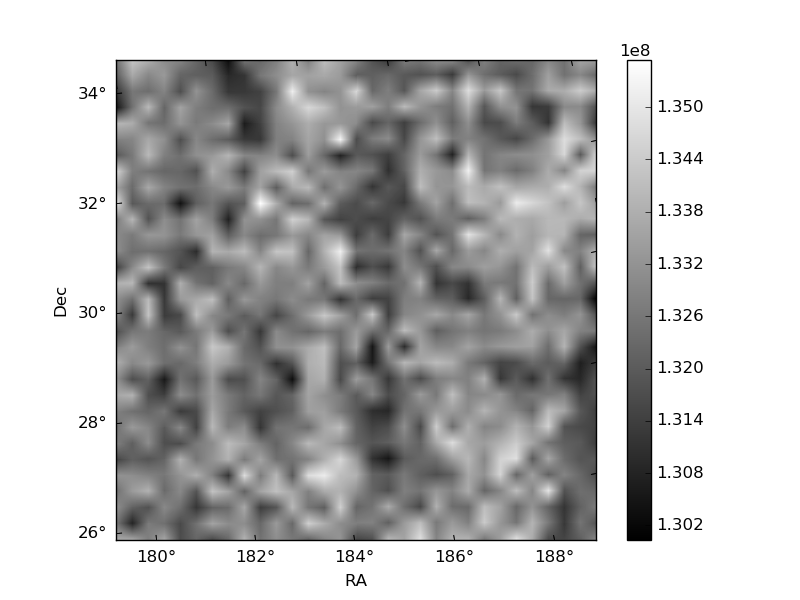
Histogram calculated using DETX and DETY for each event in the final _common_clean file
| Quadrant A |  |
 |
Quadrant B |
|---|---|---|---|
| Quadrant D |  |
 |
Quadrant C |
| Plot type | Count rate plots | Images |
|---|---|---|
| Comparison with Poisson distribution Blue bars denote a histogram of data divided into 1 sec bins. Red curve is a Poisson curve with rate = median count rate of data. |
 |
 |
| Quadrant-wise count rates Data is divided into 100 sec bins |
 |
|
| Module-wise count rates for Quadrant A Data is divided into 100 sec bins |
 |
 |
| Module-wise count rates for Quadrant B Data is divided into 100 sec bins |
 |
 |
| Module-wise count rates for Quadrant C Data is divided into 100 sec bins |
 |
 |
| Module-wise count rates for Quadrant D Data is divided into 100 sec bins |
 |
 |
| Parameter | Plot |
|---|---|
| CZT HV Monitor |  |
| D_VDD |  |
| Temperature 1 |  |
| Veto HV Monitor |  |
| Veto LLD |  |
| Alpha Counter |  |
| _CPM_Rate |  |
| CZT Counter |  |
| +2.5 Volts monitor |  |
| +5 Volts monitor |  |
| _ROLL_ROT |  |
| _Roll_DEC |  |
| _Roll_RA |  |
| Veto Counter |  |