| Param | Original file | Final file |
|---|---|---|
| Filename | modeM0/AS1G06_157T02_9000001008_07354cztM0_level2.evt | modeM0/AS1G06_157T02_9000001008_07354cztM0_level2_quad_clean.evt |
| Size (bytes) | 478,126,080 | 91,647,360 |
| Size | 456.0 MB | 87.4 MB |
| Events in quadrant A | 2,903,999 | 586,459 |
| Events in quadrant B | 3,052,503 | 608,440 |
| Events in quadrant C | 3,972,299 | 591,641 |
| Events in quadrant D | 4,120,435 | 546,036 |
| Mode M0 | |||
|---|---|---|---|
| Quadrant | BADHDUFLAG | Total packets | Discarded packets |
| A | 0 | 13090 | 3 |
| B | 0 | 13498 | 2 |
| C | 0 | 16368 | 2 |
| D | 0 | 16896 | 2 |
| Mode SS | |||
|---|---|---|---|
| Quadrant | BADHDUFLAG | Total packets | Discarded packets |
| A | 0 | 128 | 0 |
| B | 0 | 128 | 0 |
| C | 0 | 128 | 0 |
| D | 0 | 128 | 0 |
| Mode M9 | |||
|---|---|---|---|
| Quadrant | BADHDUFLAG | Total packets | Discarded packets |
| A | 0 | 16 | 0 |
| B | 0 | 16 | 0 |
| C | 0 | 16 | 0 |
| D | 0 | 17 | 0 |
| Quadrant | Total seconds | Saturated seconds | Saturation percentage |
|---|---|---|---|
| A | 6349 | 21 | 0.330761% |
| B | 6349 | 35 | 0.551268% |
| C | 6349 | 28 | 0.441014% |
| D | 6349 | 341 | 5.370925% |
Noise dominated data is calculated using 1-second bins in cleaned event files. If a bin has >2000 counts, and if more than 50% of those come from <1% of pixels, then it is considered to be noise-dominated and hence unusable.
| Quadrant | # 1 sec bins | Bins with >0 counts | Bins with >2000 counts | High rate bins dominated by noise | Noise dominated (total time) | Noise dominated (detector-on time) | Marked lightcurve |
|---|---|---|---|---|---|---|---|
| A | 7579 | 6350 | 1 | 1 | 0.01% | 0.02% | 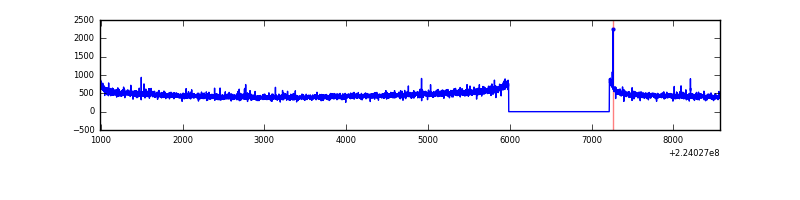 |
| B | 7579 | 6350 | 0 | 0 | 0.00% | 0.00% | 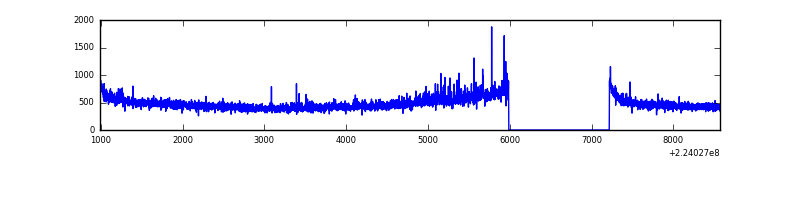 |
| C | 7579 | 6350 | 5 | 5 | 0.07% | 0.08% |  |
| D | 7579 | 6350 | 292 | 292 | 3.85% | 4.60% | 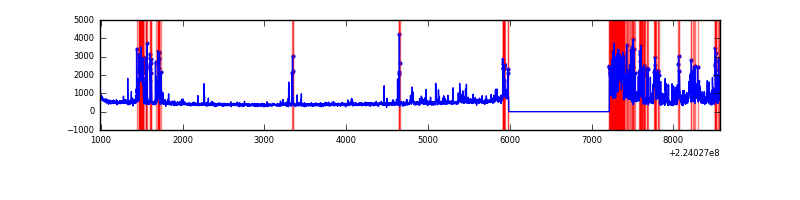 |
Top three noisy pixels from each quadrant. If the there are fewer than three noisy pixels in the level2.evt file, extra rows are filled as -1
| Pixel properties | Quadrant properties | ||||||
|---|---|---|---|---|---|---|---|
| Quadrant | DetID | PixID | Counts | Sigma | Mean | Median | Sigma |
| A | 15 | 239 | 17486 | 110.01 | 750 | 732 | 152.3 |
| A | 0 | 226 | 7158 | 42.2 | 750 | 732 | 152.3 |
| A | 12 | 194 | 6492 | 37.82 | 750 | 732 | 152.3 |
| B | 0 | 214 | 70903 | 474.26 | 767 | 748 | 147.9 |
| B | 12 | 111 | 14914 | 95.76 | 767 | 748 | 147.9 |
| B | 11 | 111 | 11726 | 74.21 | 767 | 748 | 147.9 |
| C | 9 | 68 | 1069630 | 6235.17 | 738 | 743 | 171.4 |
| C | 10 | 22 | 17871 | 99.91 | 738 | 743 | 171.4 |
| C | 13 | 61 | 5839 | 29.73 | 738 | 743 | 171.4 |
| D | 1 | 52 | 1067994 | 5990.01 | 713 | 691 | 178.2 |
| D | 14 | 34 | 198859 | 1112.18 | 713 | 691 | 178.2 |
| D | 2 | 216 | 64313 | 357.06 | 713 | 691 | 178.2 |
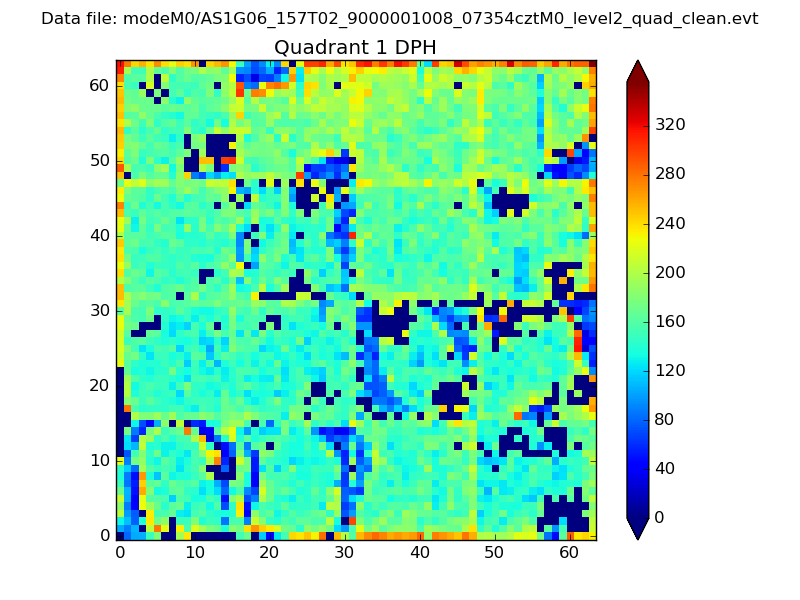
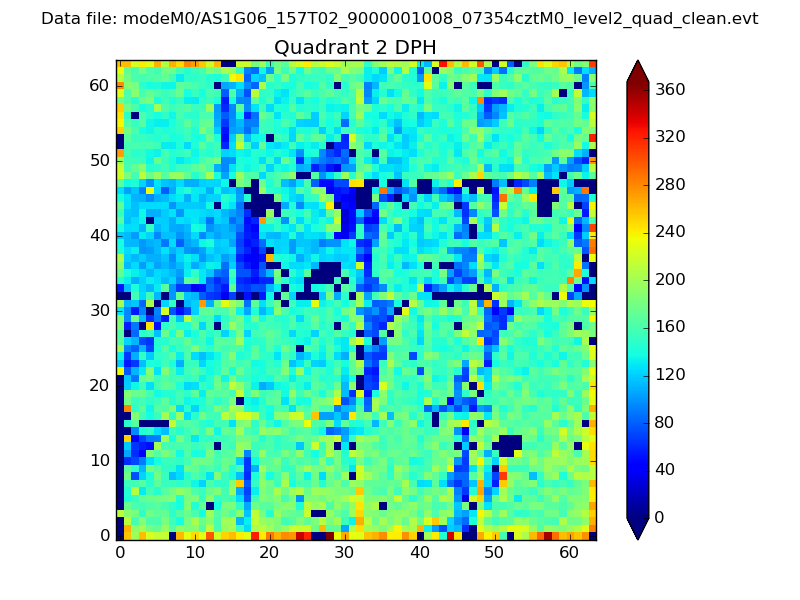
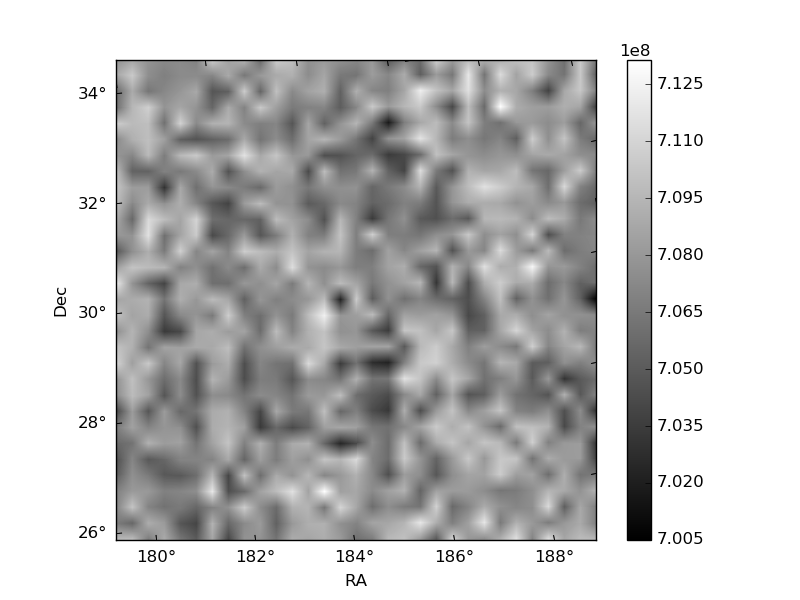
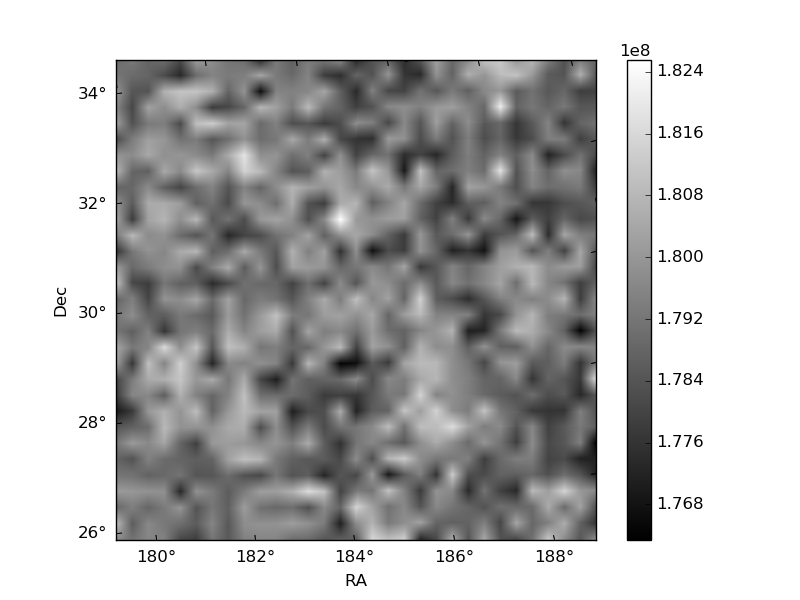
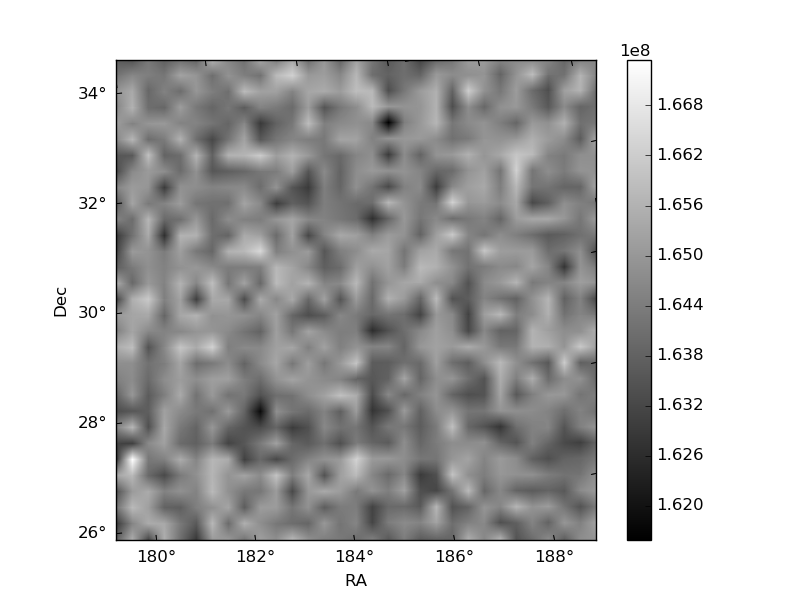
Histogram calculated using DETX and DETY for each event in the final _common_clean file
| Quadrant A | 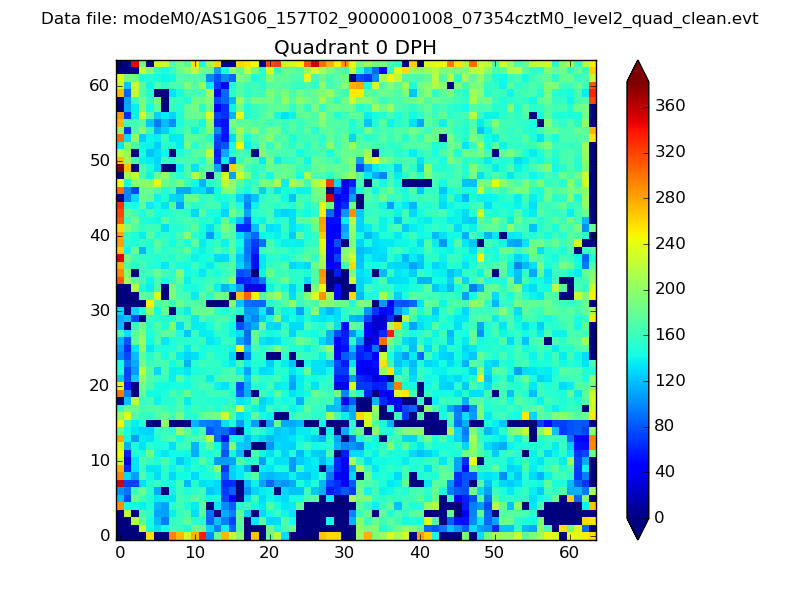 |
 |
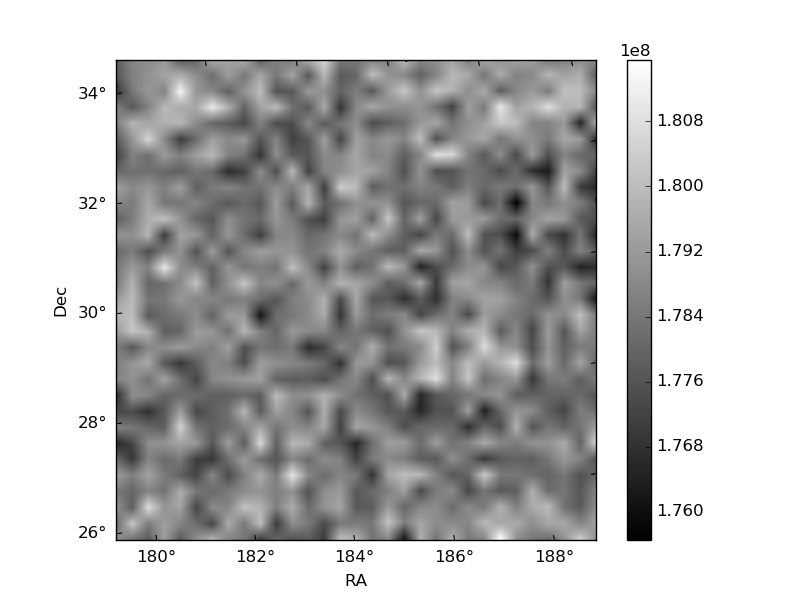
Quadrant B |
|---|---|---|---|
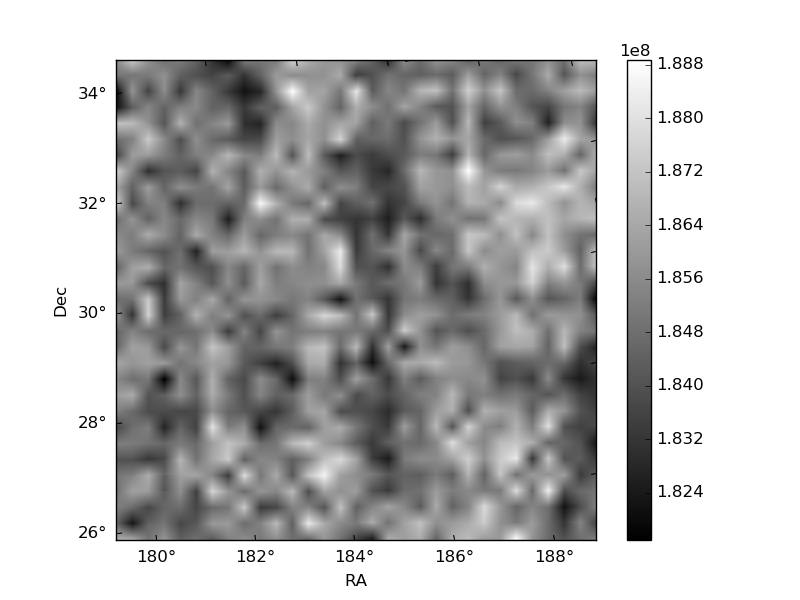
| Quadrant D | 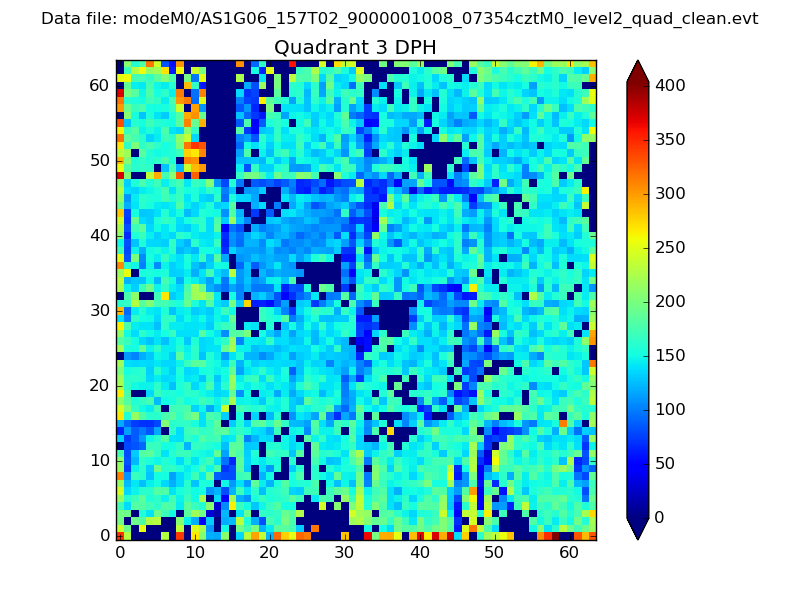 |
 |
Quadrant C |
| Plot type | Count rate plots | Images |
|---|---|---|
| Comparison with Poisson distribution Blue bars denote a histogram of data divided into 1 sec bins. Red curve is a Poisson curve with rate = median count rate of data. |
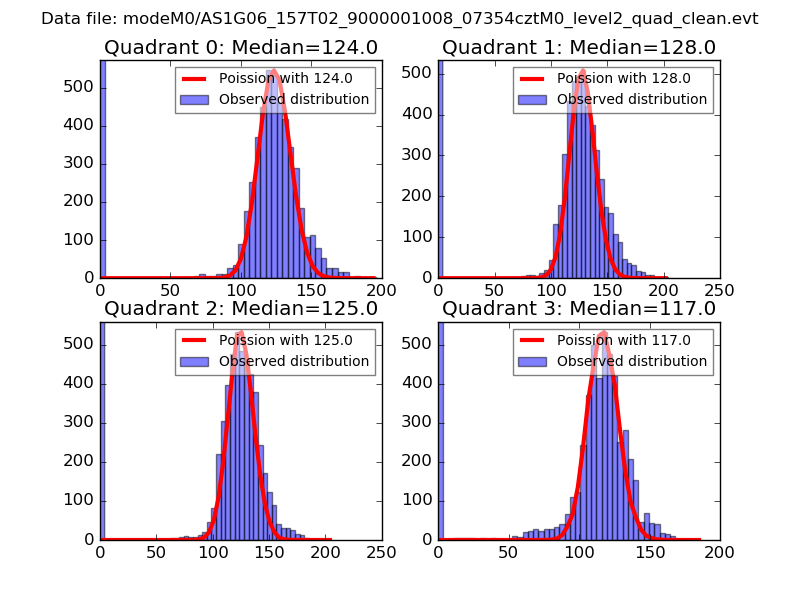 |
 |
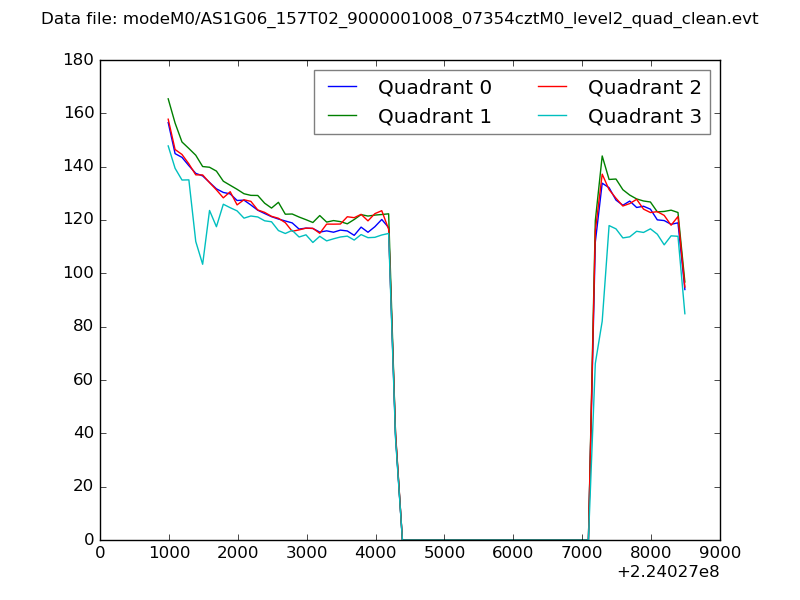
| Quadrant-wise count rates Data is divided into 100 sec bins |
 |
|
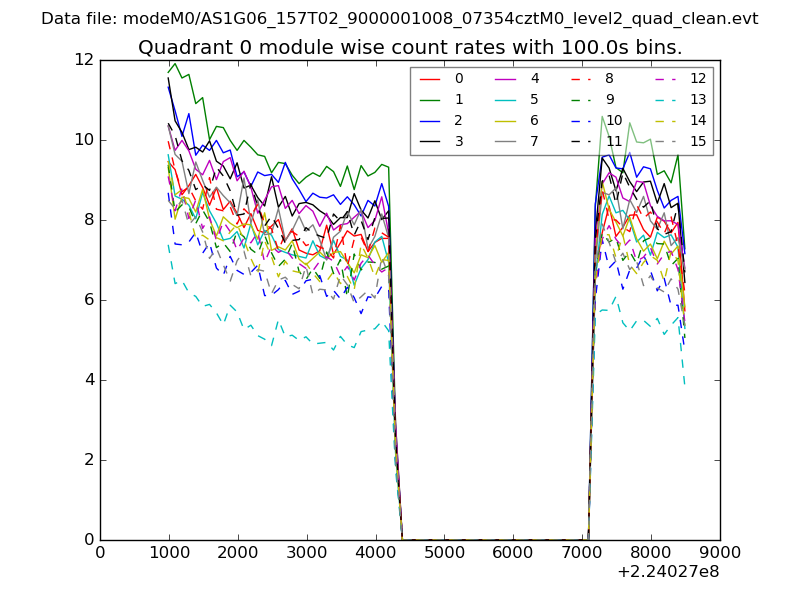
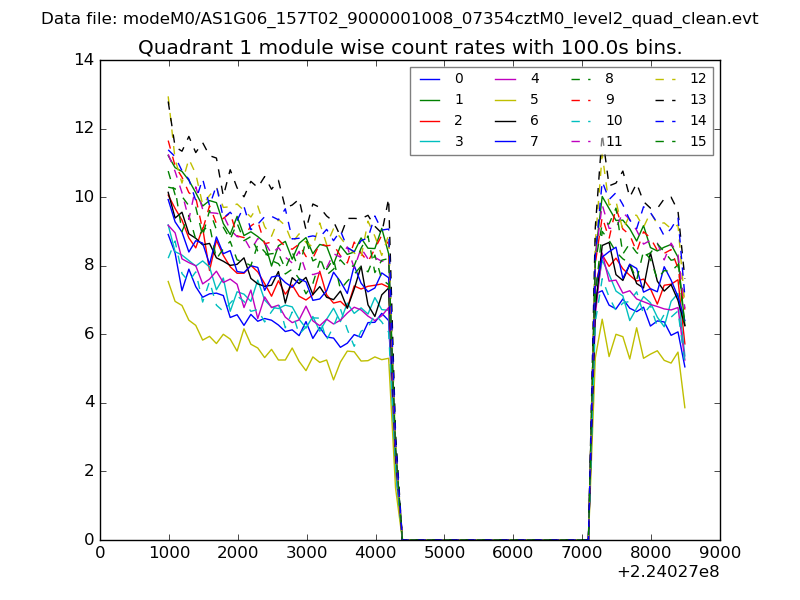
| Module-wise count rates for Quadrant A Data is divided into 100 sec bins |
 |
 |
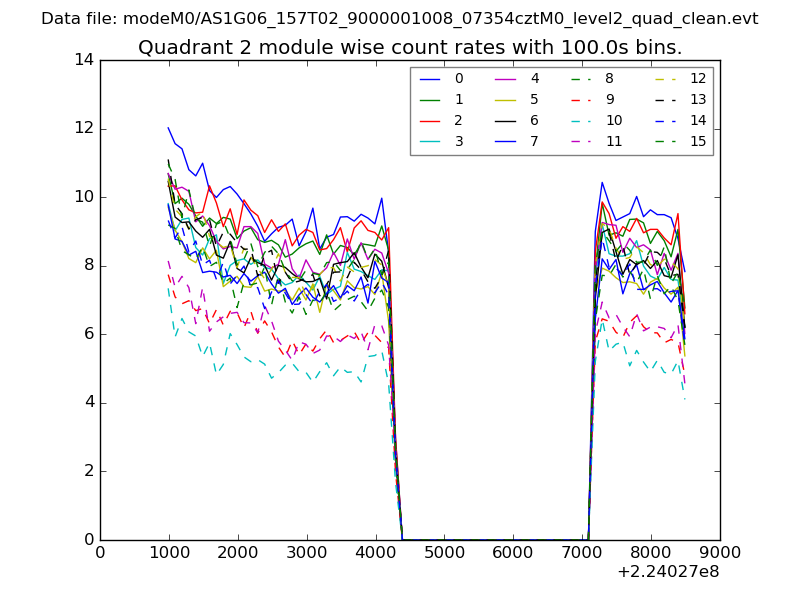
| Module-wise count rates for Quadrant B Data is divided into 100 sec bins |
 |
 |
| Module-wise count rates for Quadrant C Data is divided into 100 sec bins |
 |
 |
| Module-wise count rates for Quadrant D Data is divided into 100 sec bins |
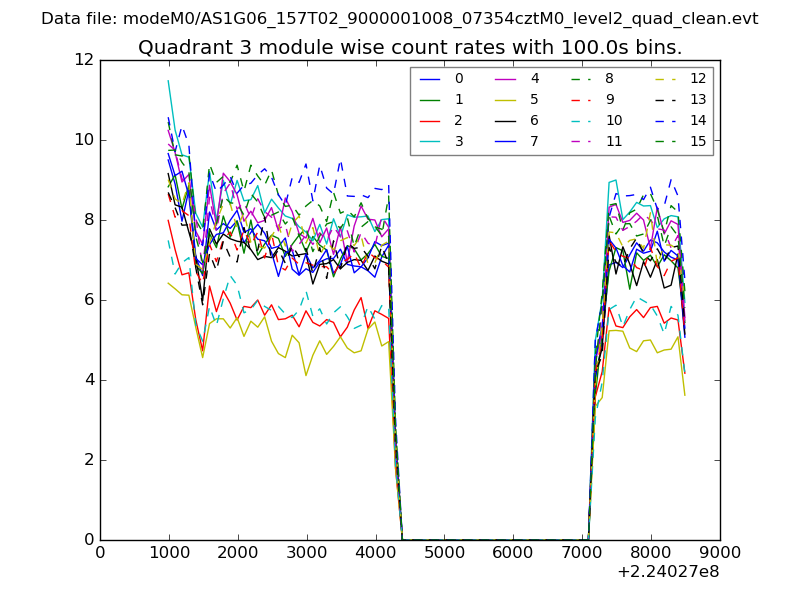 |
 |
| Parameter | Plot |
|---|---|
| CZT HV Monitor | 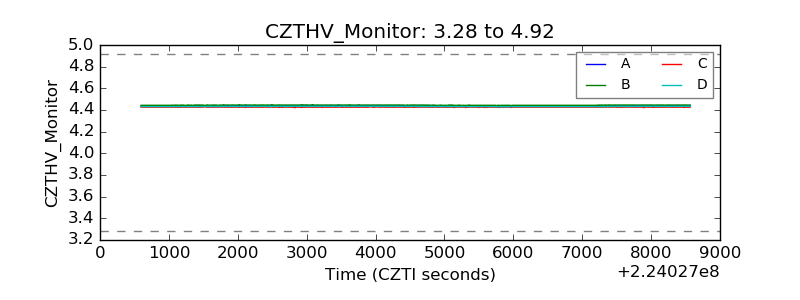 |
| D_VDD | 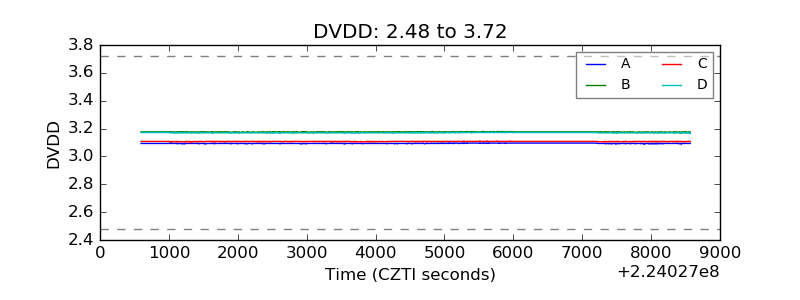 |
| Temperature 1 | 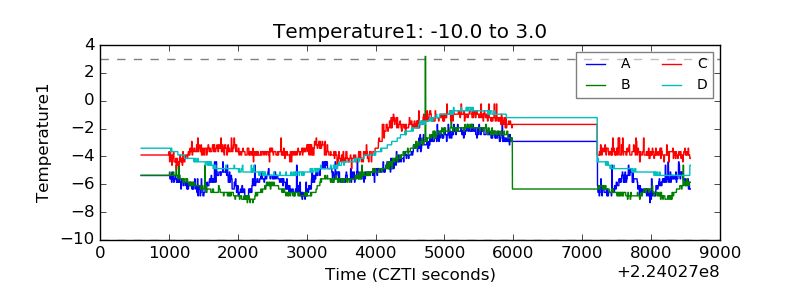 |
| Veto HV Monitor | 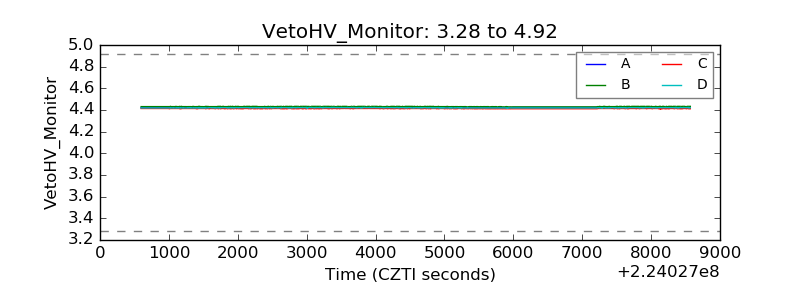 |
| Veto LLD | 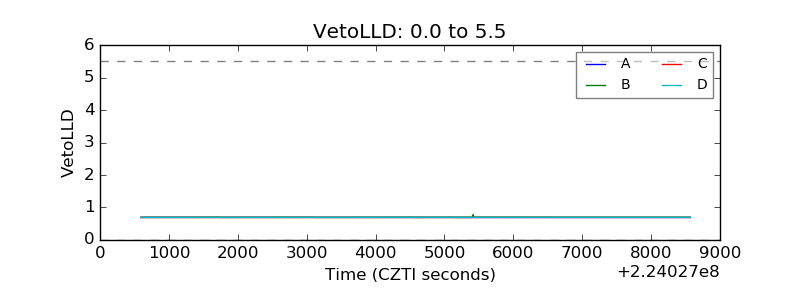 |
| Alpha Counter | 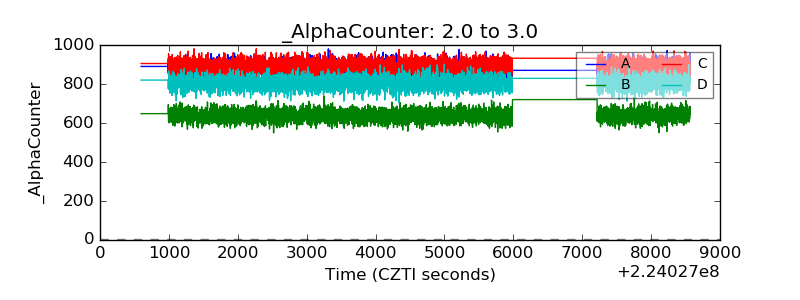 |
| _CPM_Rate | 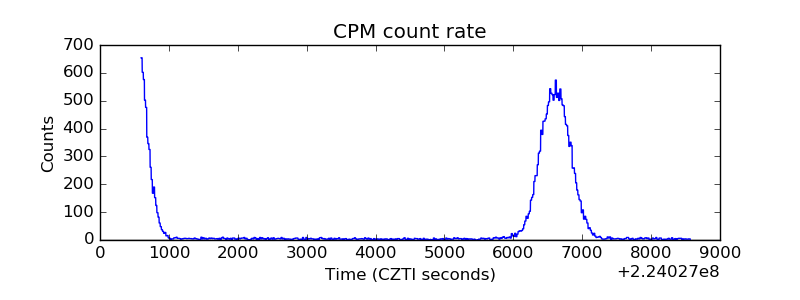 |
| CZT Counter | 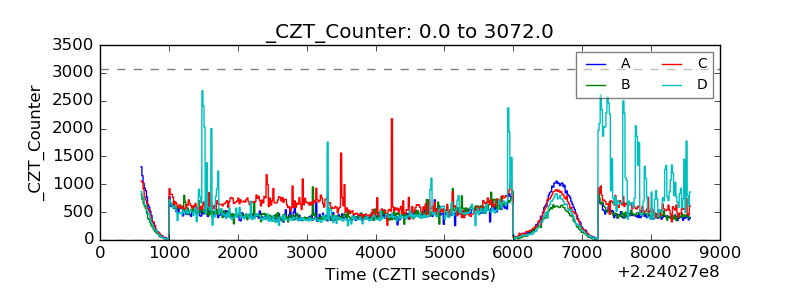 |
| +2.5 Volts monitor |  |
| +5 Volts monitor |  |
| _ROLL_ROT | 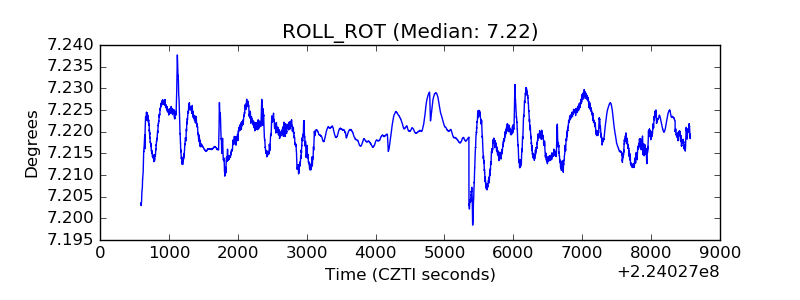 |
| _Roll_DEC | 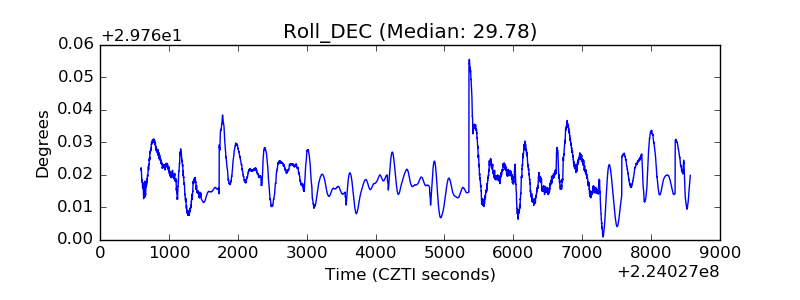 |
| _Roll_RA | 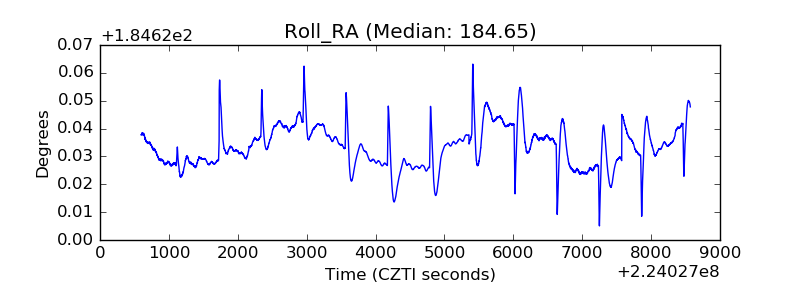 |
| Veto Counter | 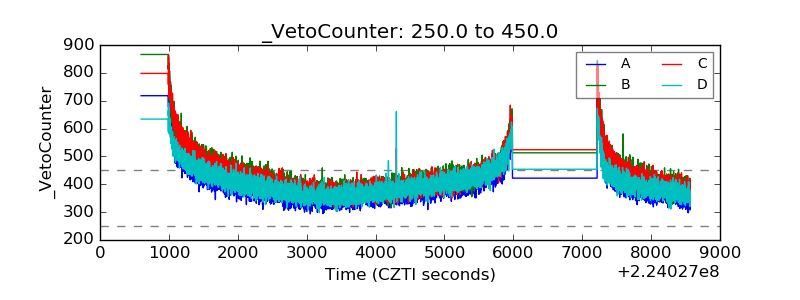 |