| Param | Original file | Final file |
|---|---|---|
| Filename | modeM0/AS1G06_157T02_9000001008_07355cztM0_level2.evt | modeM0/AS1G06_157T02_9000001008_07355cztM0_level2_quad_clean.evt |
| Size (bytes) | 687,683,520 | 88,992,000 |
| Size | 655.8 MB | 84.9 MB |
| Events in quadrant A | 3,211,308 | 582,782 |
| Events in quadrant B | 3,329,574 | 601,958 |
| Events in quadrant C | 3,980,074 | 589,011 |
| Events in quadrant D | 9,824,446 | 425,746 |
| Mode M0 | |||
|---|---|---|---|
| Quadrant | BADHDUFLAG | Total packets | Discarded packets |
| A | 0 | 14679 | 3 |
| B | 0 | 14861 | 2 |
| C | 0 | 16359 | 2 |
| D | 0 | 33979 | 2 |
| Mode SS | |||
|---|---|---|---|
| Quadrant | BADHDUFLAG | Total packets | Discarded packets |
| A | 0 | 144 | 0 |
| B | 0 | 144 | 0 |
| C | 0 | 144 | 0 |
| D | 0 | 144 | 0 |
| Mode M9 | |||
|---|---|---|---|
| Quadrant | BADHDUFLAG | Total packets | Discarded packets |
| A | 0 | 20 | 0 |
| B | 0 | 20 | 0 |
| C | 0 | 20 | 0 |
| D | 0 | 21 | 0 |
| Quadrant | Total seconds | Saturated seconds | Saturation percentage |
|---|---|---|---|
| A | 7104 | 46 | 0.647523% |
| B | 7104 | 59 | 0.830518% |
| C | 7104 | 41 | 0.577140% |
| D | 7104 | 2467 | 34.726914% |
Noise dominated data is calculated using 1-second bins in cleaned event files. If a bin has >2000 counts, and if more than 50% of those come from <1% of pixels, then it is considered to be noise-dominated and hence unusable.
| Quadrant | # 1 sec bins | Bins with >0 counts | Bins with >2000 counts | High rate bins dominated by noise | Noise dominated (total time) | Noise dominated (detector-on time) | Marked lightcurve |
|---|---|---|---|---|---|---|---|
| A | 7984 | 7105 | 1 | 1 | 0.01% | 0.01% |  |
| B | 7984 | 7105 | 0 | 0 | 0.00% | 0.00% |  |
| C | 7984 | 7105 | 0 | 0 | 0.00% | 0.00% | 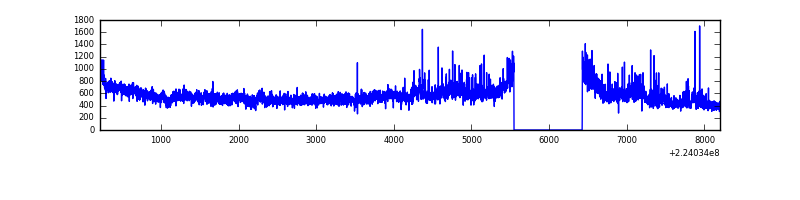 |
| D | 7984 | 7105 | 2419 | 2419 | 30.30% | 34.05% |  |
Top three noisy pixels from each quadrant. If the there are fewer than three noisy pixels in the level2.evt file, extra rows are filled as -1
| Pixel properties | Quadrant properties | ||||||
|---|---|---|---|---|---|---|---|
| Quadrant | DetID | PixID | Counts | Sigma | Mean | Median | Sigma |
| A | 15 | 239 | 34239 | 199.09 | 824 | 805 | 167.9 |
| A | 0 | 226 | 7808 | 41.7 | 824 | 805 | 167.9 |
| A | 12 | 194 | 7134 | 37.69 | 824 | 805 | 167.9 |
| B | 0 | 214 | 50082 | 304.14 | 839 | 816 | 162.0 |
| B | 4 | 81 | 28147 | 168.73 | 839 | 816 | 162.0 |
| B | 12 | 111 | 16824 | 98.83 | 839 | 816 | 162.0 |
| C | 9 | 68 | 807404 | 4280.18 | 807 | 812 | 188.4 |
| C | 12 | 80 | 8093 | 38.64 | 807 | 812 | 188.4 |
| C | 10 | 22 | 6608 | 30.76 | 807 | 812 | 188.4 |
| D | 1 | 52 | 7048133 | 46629.27 | 614 | 594 | 151.1 |
| D | 14 | 34 | 316640 | 2091.08 | 614 | 594 | 151.1 |
| D | 12 | 233 | 72076 | 472.95 | 614 | 594 | 151.1 |
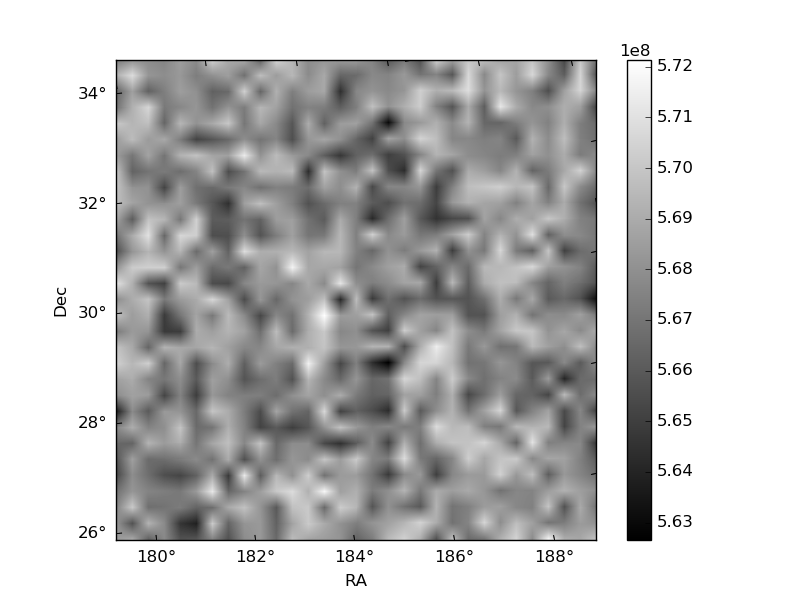
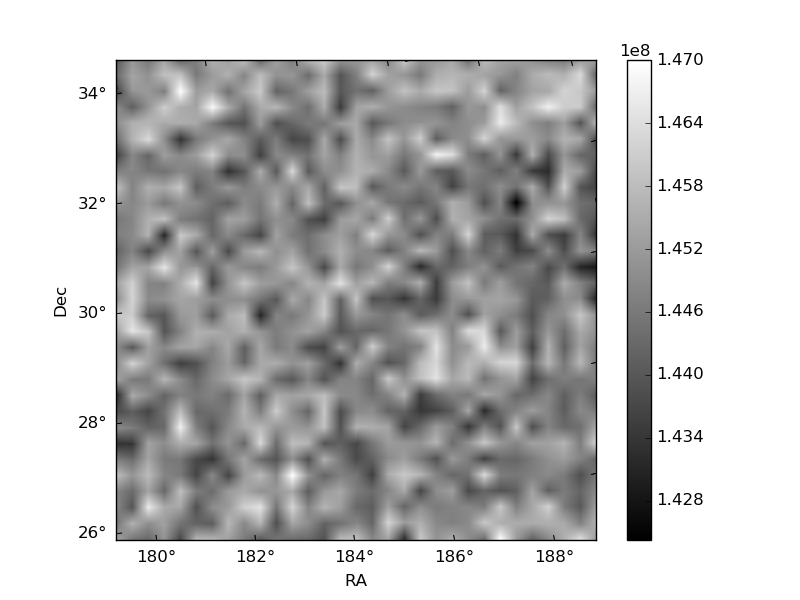
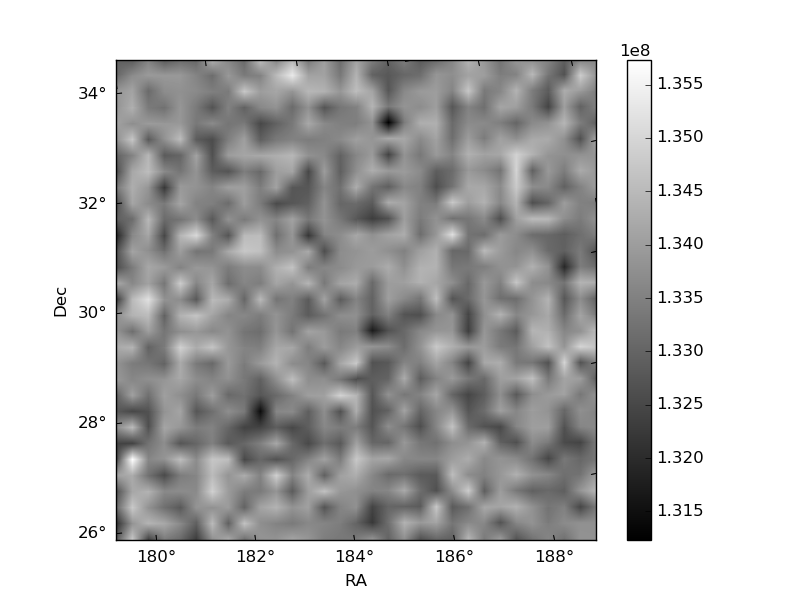
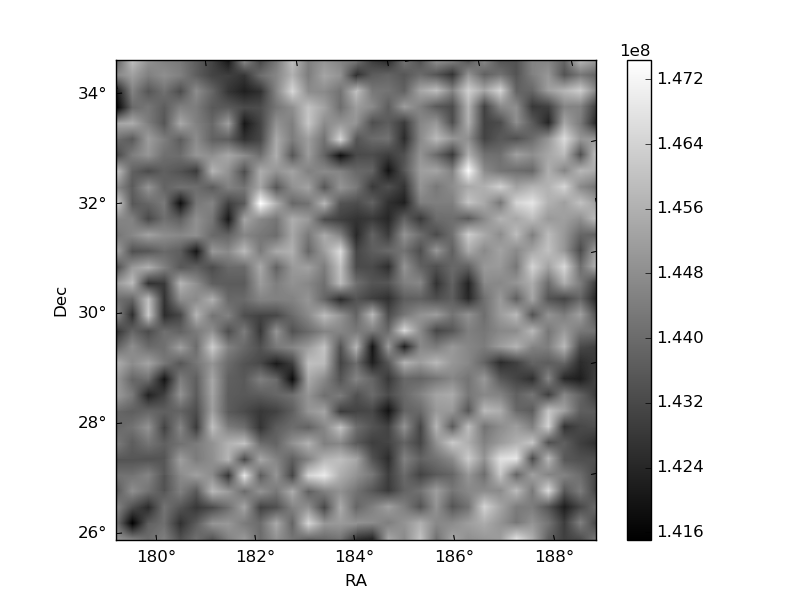
Histogram calculated using DETX and DETY for each event in the final _common_clean file
| Quadrant A | 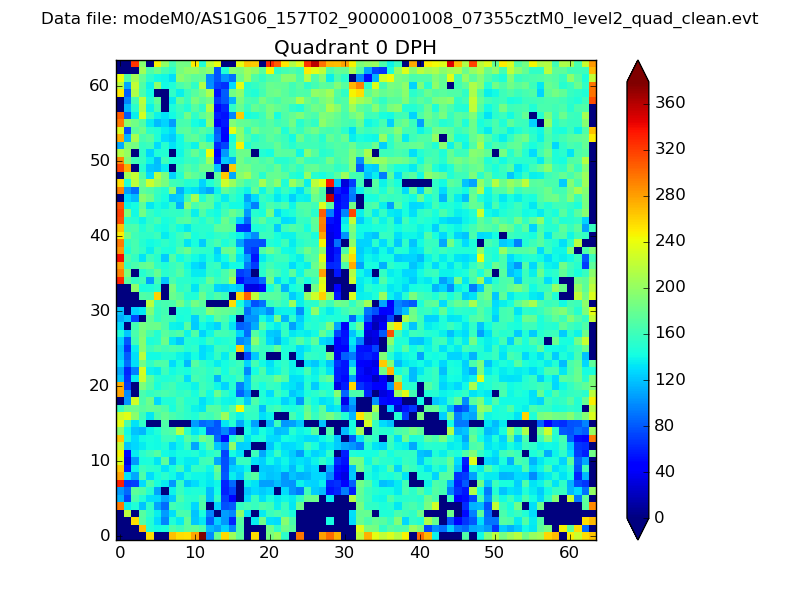 |
 |
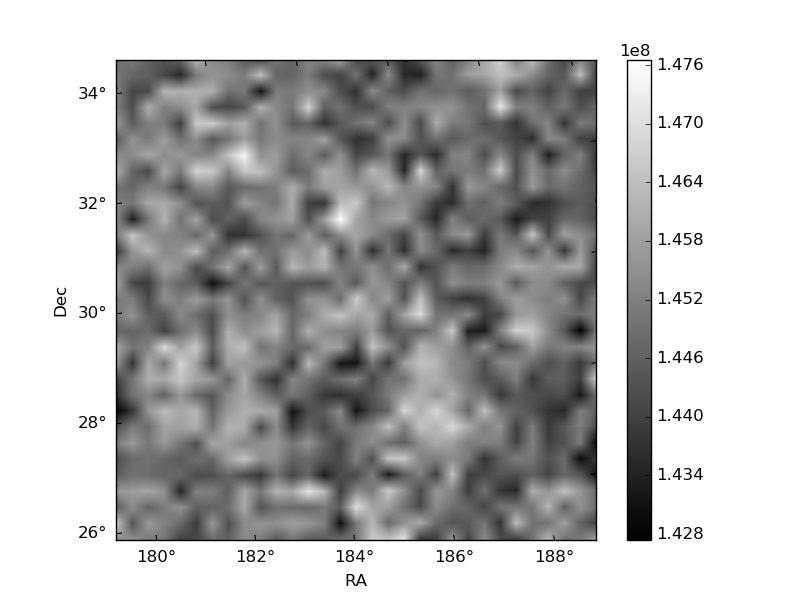
Quadrant B |
|---|---|---|---|
| Quadrant D | 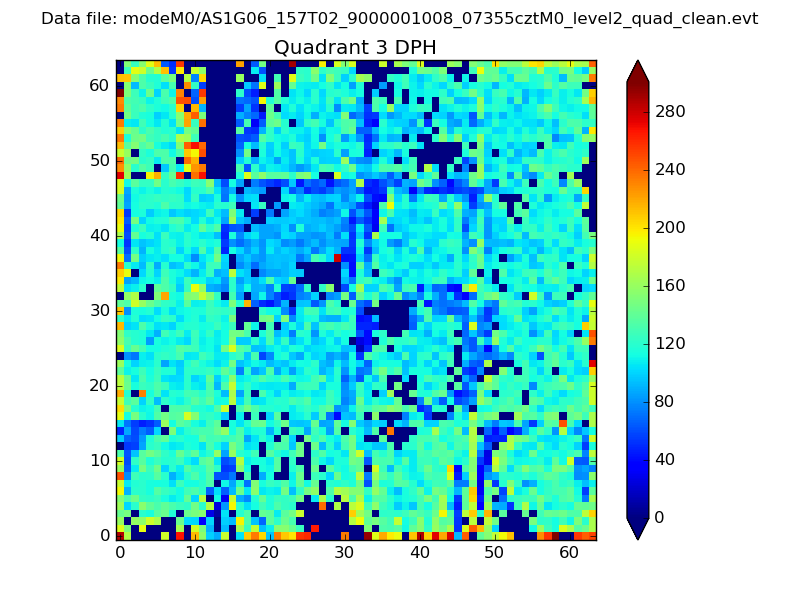 |
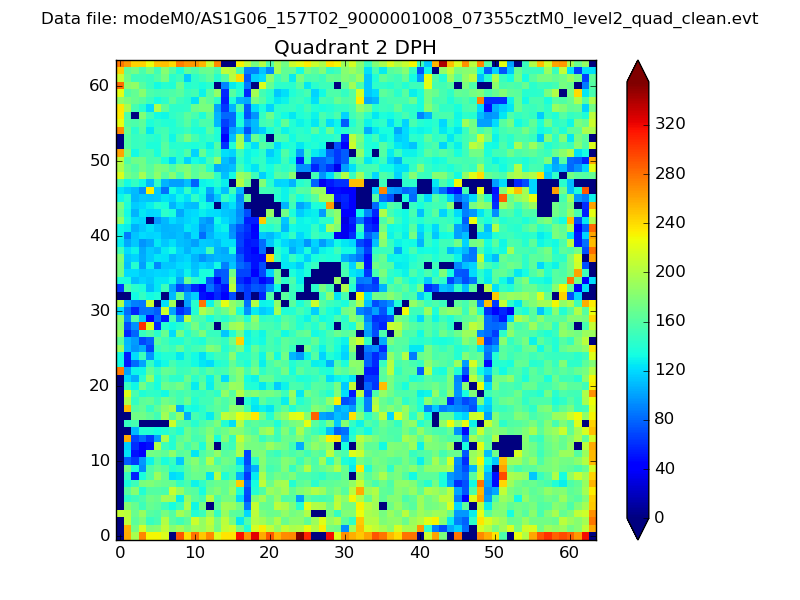 |
Quadrant C |
| Plot type | Count rate plots | Images |
|---|---|---|
| Comparison with Poisson distribution Blue bars denote a histogram of data divided into 1 sec bins. Red curve is a Poisson curve with rate = median count rate of data. |
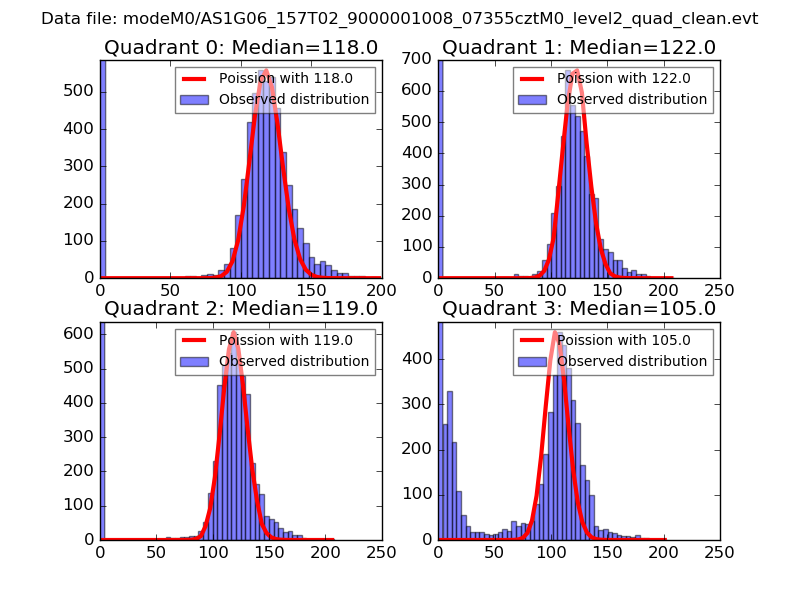 |
 |
| Quadrant-wise count rates Data is divided into 100 sec bins |
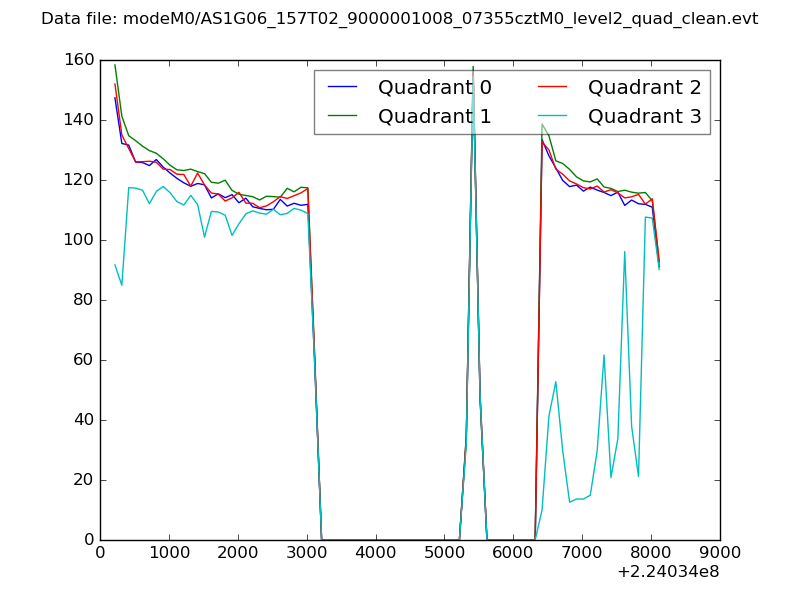 |
|
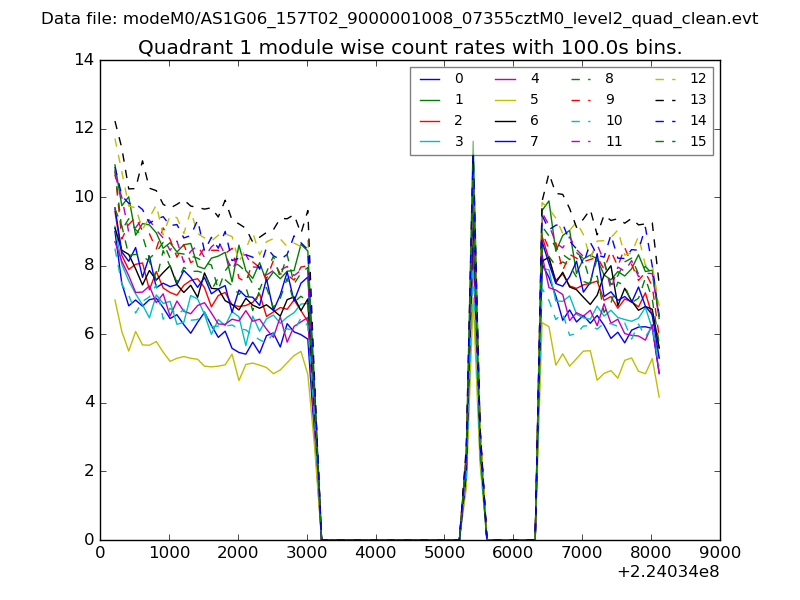
| Module-wise count rates for Quadrant A Data is divided into 100 sec bins |
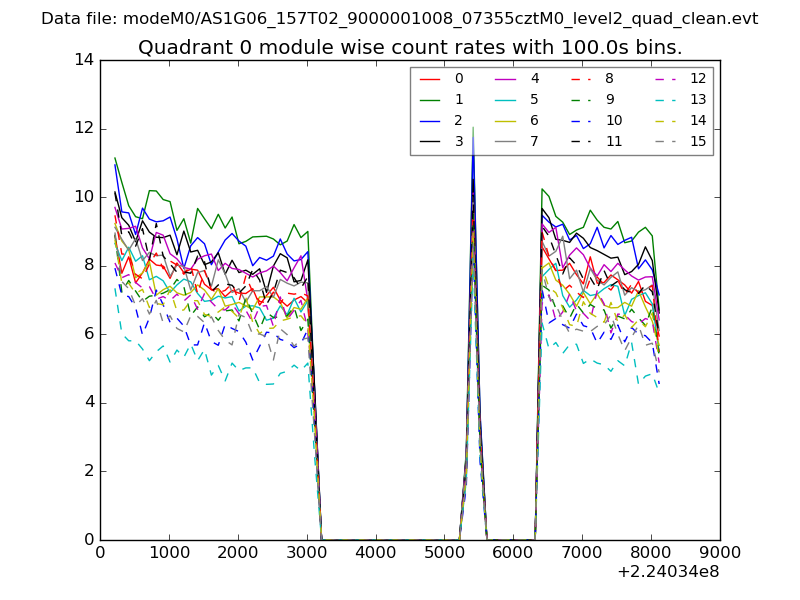 |
 |
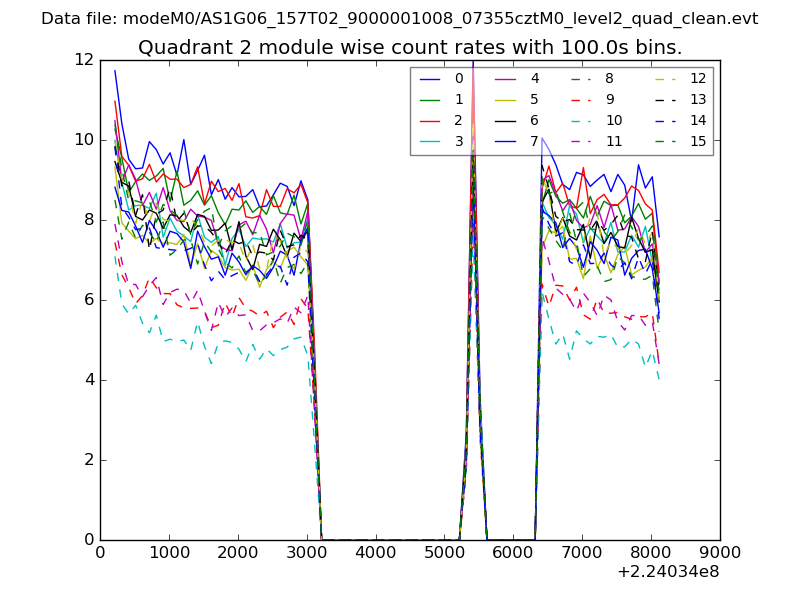
| Module-wise count rates for Quadrant B Data is divided into 100 sec bins |
 |
 |
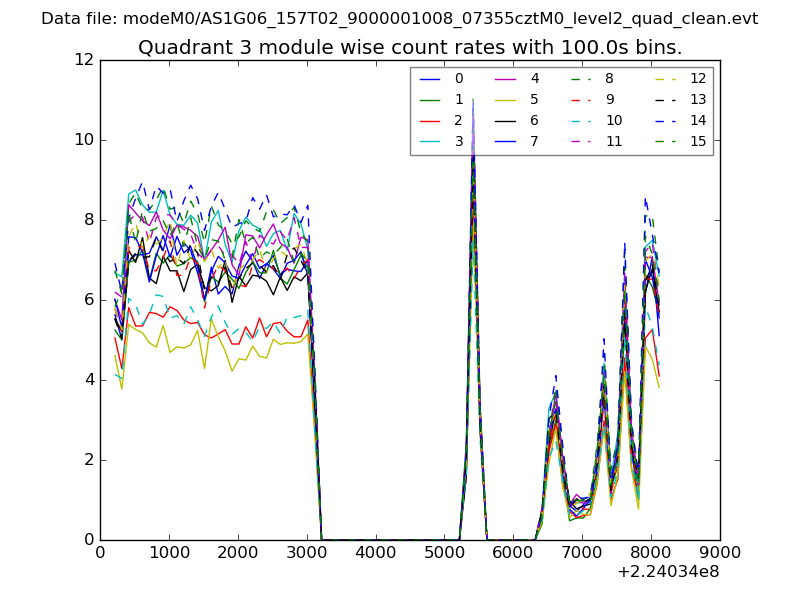
| Module-wise count rates for Quadrant C Data is divided into 100 sec bins |
 |
 |
| Module-wise count rates for Quadrant D Data is divided into 100 sec bins |
 |
 |
| Parameter | Plot |
|---|---|
| CZT HV Monitor | 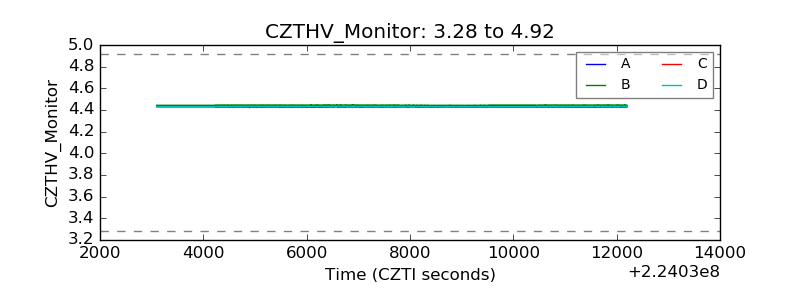 |
| D_VDD | 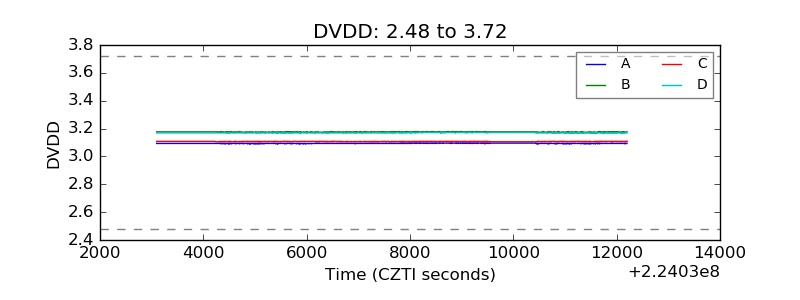 |
| Temperature 1 | 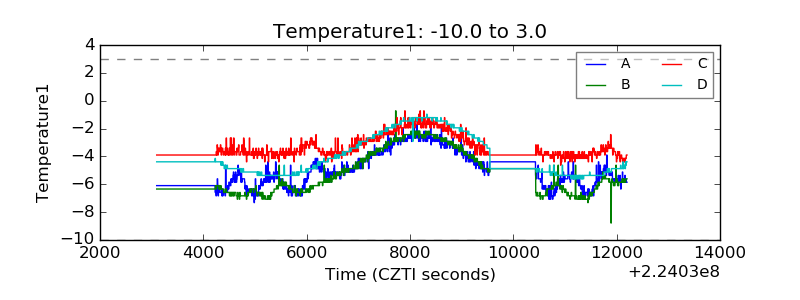 |
| Veto HV Monitor | 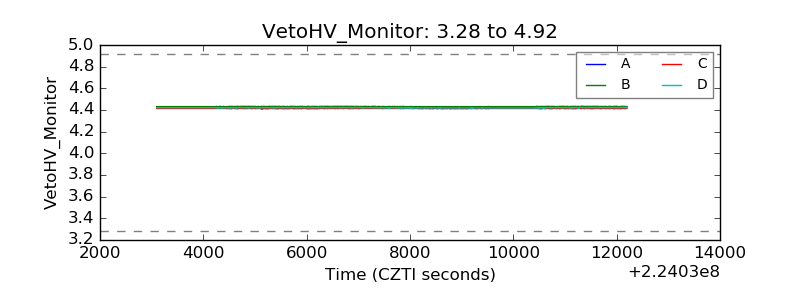 |
| Veto LLD |  |
| Alpha Counter |  |
| _CPM_Rate | 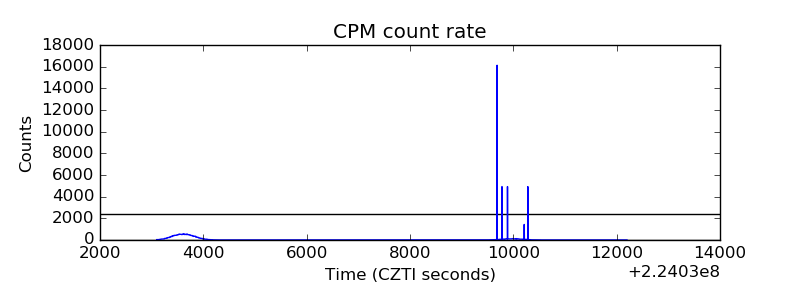 |
| CZT Counter | 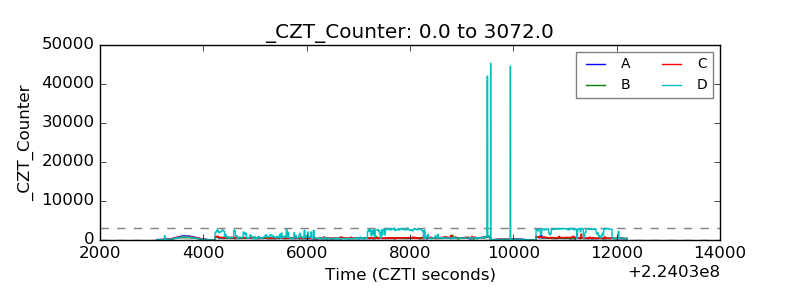 |
| +2.5 Volts monitor |  |
| +5 Volts monitor |  |
| _ROLL_ROT | 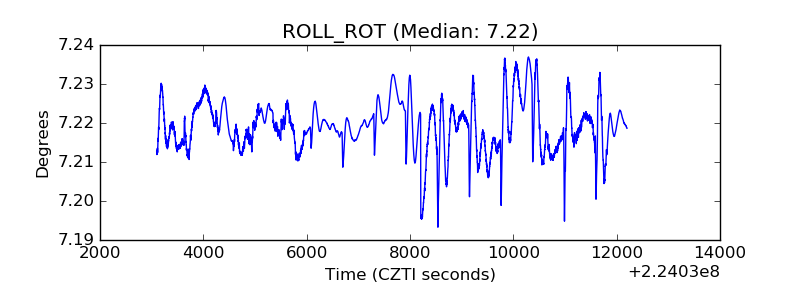 |
| _Roll_DEC | 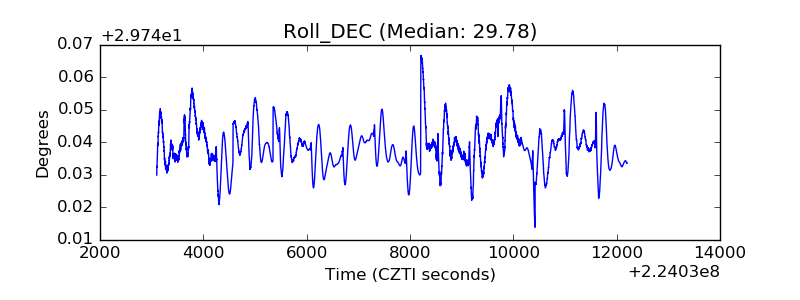 |
| _Roll_RA | 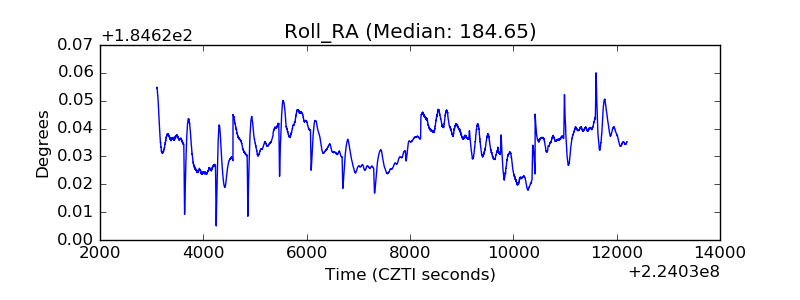 |
| Veto Counter | 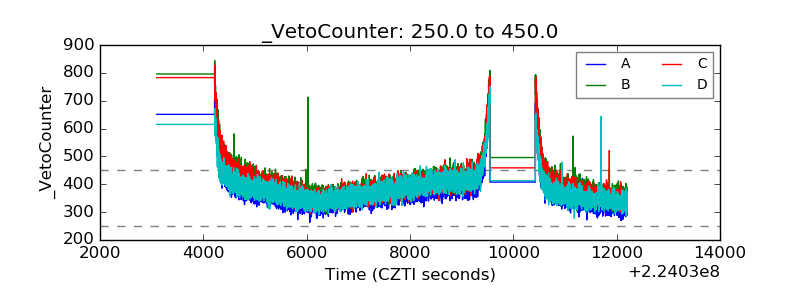 |