| Param | Original file | Final file |
|---|---|---|
| Filename | modeM0/AS1G06_157T02_9000001008_07356cztM0_level2.evt | modeM0/AS1G06_157T02_9000001008_07356cztM0_level2_quad_clean.evt |
| Size (bytes) | 289,874,880 | 58,996,800 |
| Size | 276.4 MB | 56.3 MB |
| Events in quadrant A | 2,349,006 | 432,632 |
| Events in quadrant B | 1,993,620 | 371,411 |
| Events in quadrant C | 2,226,905 | 358,368 |
| Events in quadrant D | 1,934,723 | 340,805 |
| Mode M0 | |||
|---|---|---|---|
| Quadrant | BADHDUFLAG | Total packets | Discarded packets |
| A | 0 | 17210 | 7408 |
| B | 0 | 15890 | 7288 |
| C | 0 | 18349 | 9107 |
| D | 0 | 25149 | 16632 |
| Mode SS | |||
|---|---|---|---|
| Quadrant | BADHDUFLAG | Total packets | Discarded packets |
| A | 0 | 154 | 69 |
| B | 0 | 155 | 75 |
| C | 0 | 155 | 69 |
| D | 0 | 156 | 76 |
| Mode M9 | |||
|---|---|---|---|
| Quadrant | BADHDUFLAG | Total packets | Discarded packets |
| A | 0 | 13 | 8 |
| B | 0 | 13 | 8 |
| C | 0 | 13 | 8 |
| D | 0 | 14 | 8 |
| Quadrant | Total seconds | Saturated seconds | Saturation percentage |
|---|---|---|---|
| A | 4049 | 287 | 7.088170% |
| B | 4083 | 85 | 2.081803% |
| C | 3966 | 55 | 1.386788% |
| D | 3947 | 54 | 1.368128% |
Noise dominated data is calculated using 1-second bins in cleaned event files. If a bin has >2000 counts, and if more than 50% of those come from <1% of pixels, then it is considered to be noise-dominated and hence unusable.
| Quadrant | # 1 sec bins | Bins with >0 counts | Bins with >2000 counts | High rate bins dominated by noise | Noise dominated (total time) | Noise dominated (detector-on time) | Marked lightcurve |
|---|---|---|---|---|---|---|---|
| A | 7823 | 4488 | 186 | 186 | 2.38% | 4.14% | 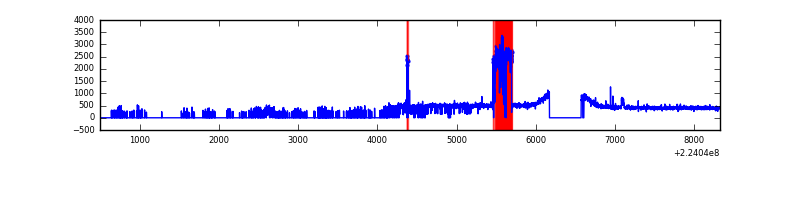 |
| B | 7716 | 4543 | 0 | 0 | 0.00% | 0.00% | 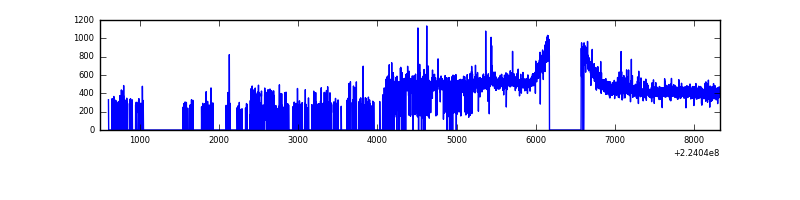 |
| C | 7668 | 4362 | 0 | 0 | 0.00% | 0.00% | 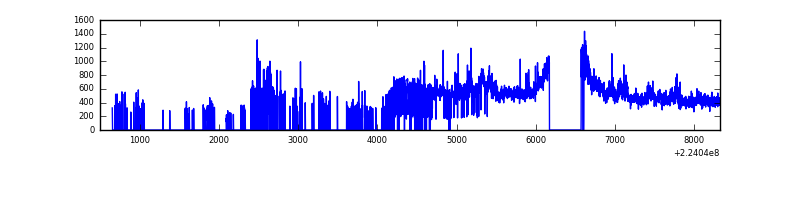 |
| D | 6411 | 4313 | 15 | 15 | 0.23% | 0.35% | 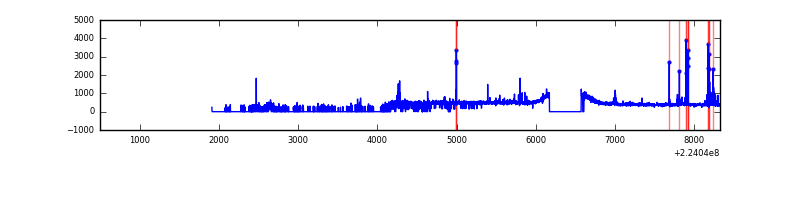 |
Top three noisy pixels from each quadrant. If the there are fewer than three noisy pixels in the level2.evt file, extra rows are filled as -1
| Pixel properties | Quadrant properties | ||||||
|---|---|---|---|---|---|---|---|
| Quadrant | DetID | PixID | Counts | Sigma | Mean | Median | Sigma |
| A | 15 | 234 | 502540 | 5044.53 | 478 | 468 | 99.5 |
| A | 3 | 1 | 5041 | 45.95 | 478 | 468 | 99.5 |
| A | 0 | 226 | 4487 | 40.38 | 478 | 468 | 99.5 |
| B | 0 | 214 | 25559 | 252.93 | 503 | 492 | 99.1 |
| B | 4 | 81 | 11939 | 115.5 | 503 | 492 | 99.1 |
| B | 12 | 111 | 10336 | 99.33 | 503 | 492 | 99.1 |
| C | 9 | 68 | 235805 | 2087.76 | 472 | 473 | 112.7 |
| C | 12 | 80 | 133351 | 1178.83 | 472 | 473 | 112.7 |
| C | 8 | 128 | 5282 | 42.66 | 472 | 473 | 112.7 |
| D | 12 | 233 | 68240 | 576.07 | 470 | 454 | 117.7 |
| D | 2 | 14 | 29066 | 243.15 | 470 | 454 | 117.7 |
| D | 2 | 216 | 25252 | 210.74 | 470 | 454 | 117.7 |
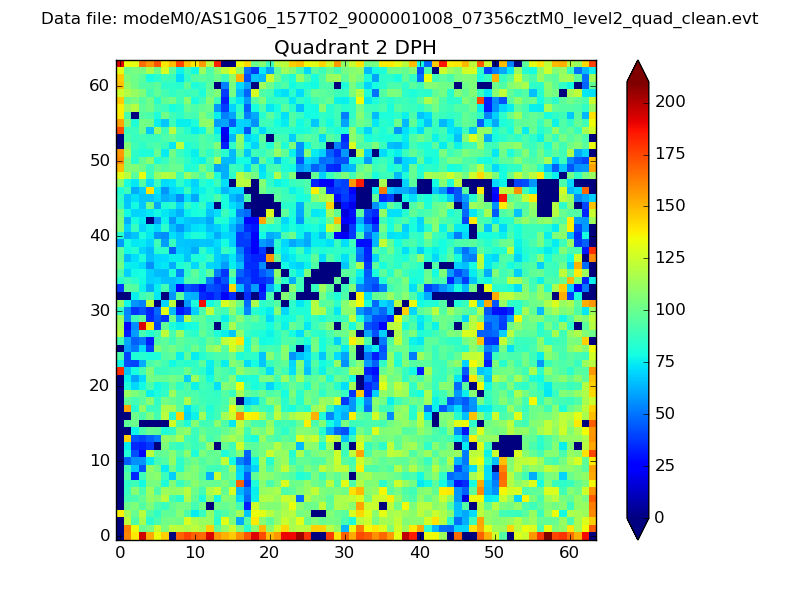
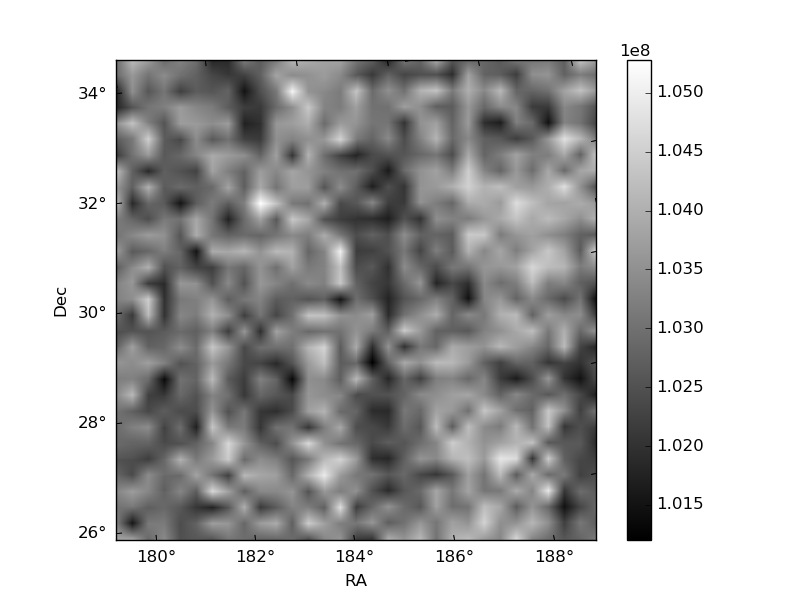
Histogram calculated using DETX and DETY for each event in the final _common_clean file
| Quadrant A | 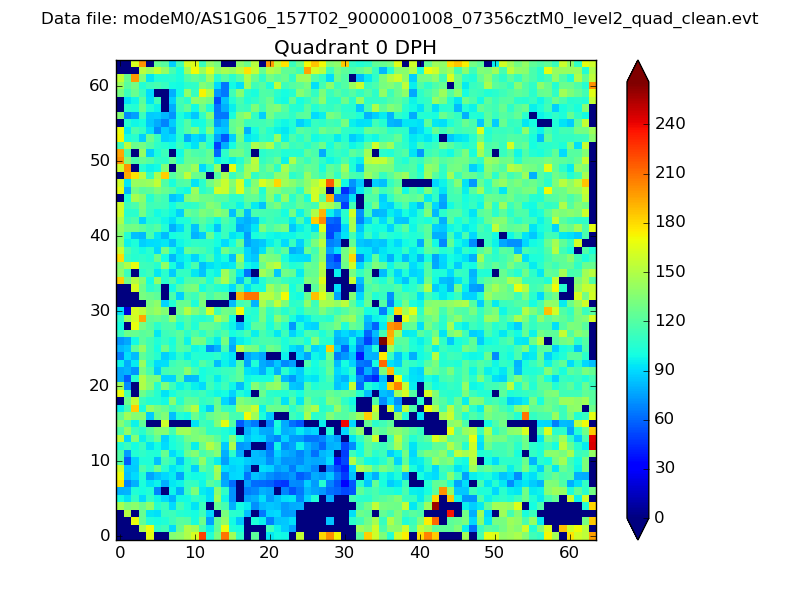 |
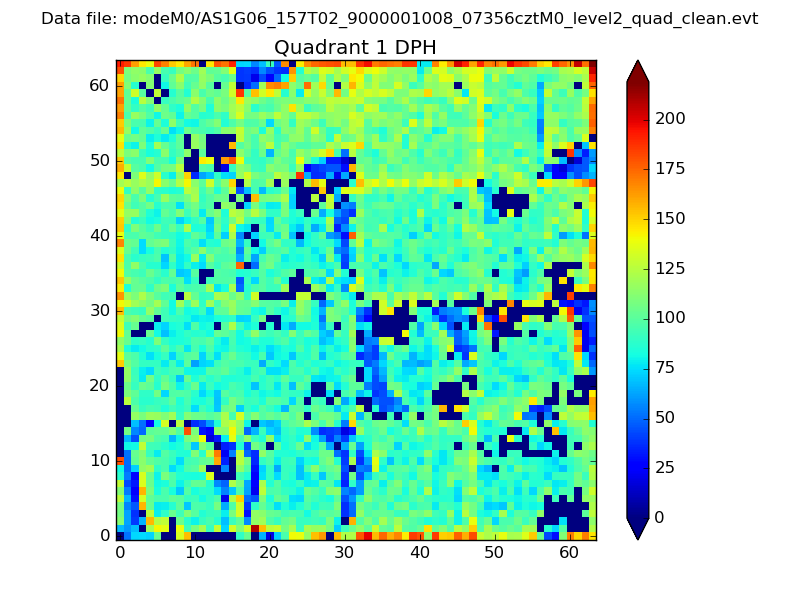 |
Quadrant B |
|---|---|---|---|
| Quadrant D | 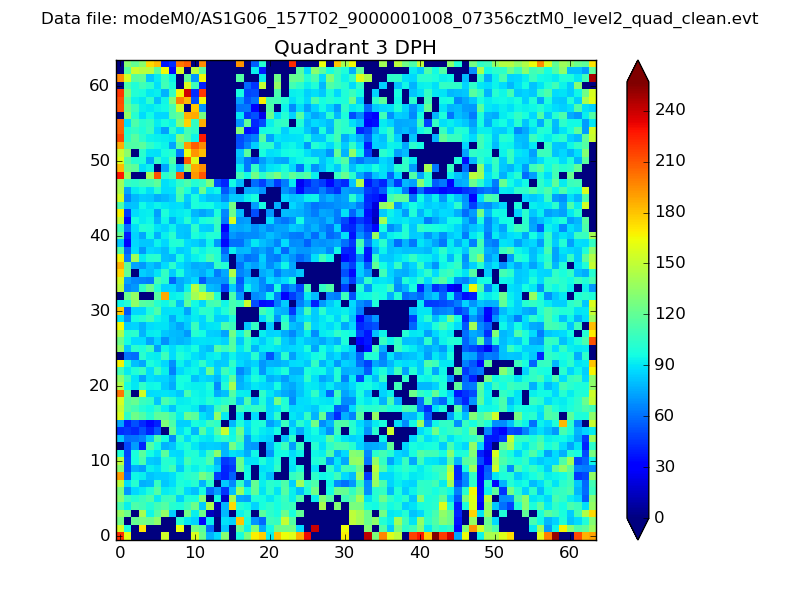 |
 |
Quadrant C |
| Plot type | Count rate plots | Images |
|---|---|---|
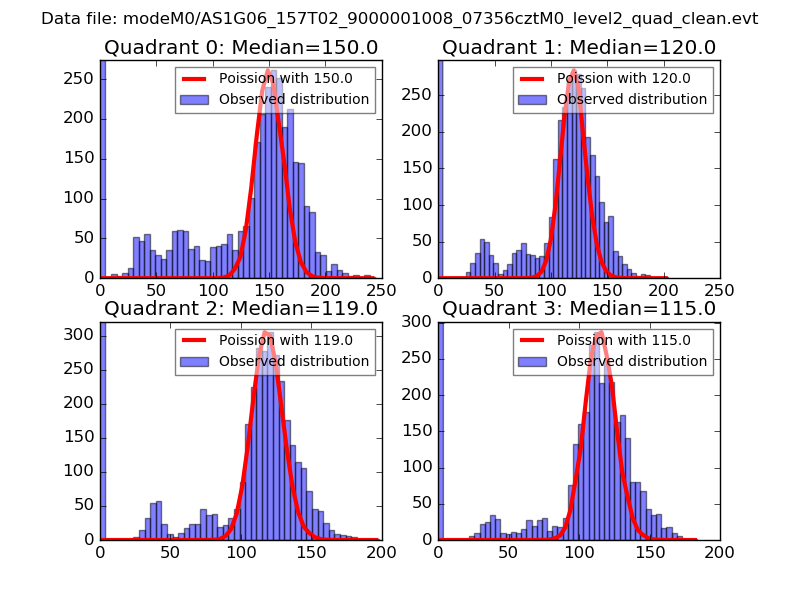
| Comparison with Poisson distribution Blue bars denote a histogram of data divided into 1 sec bins. Red curve is a Poisson curve with rate = median count rate of data. |
 |
 |
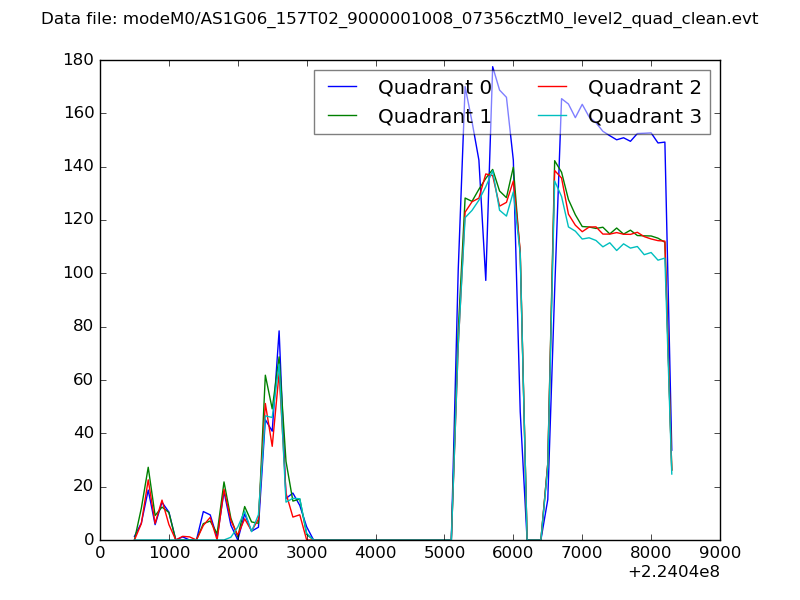
| Quadrant-wise count rates Data is divided into 100 sec bins |
 |
|
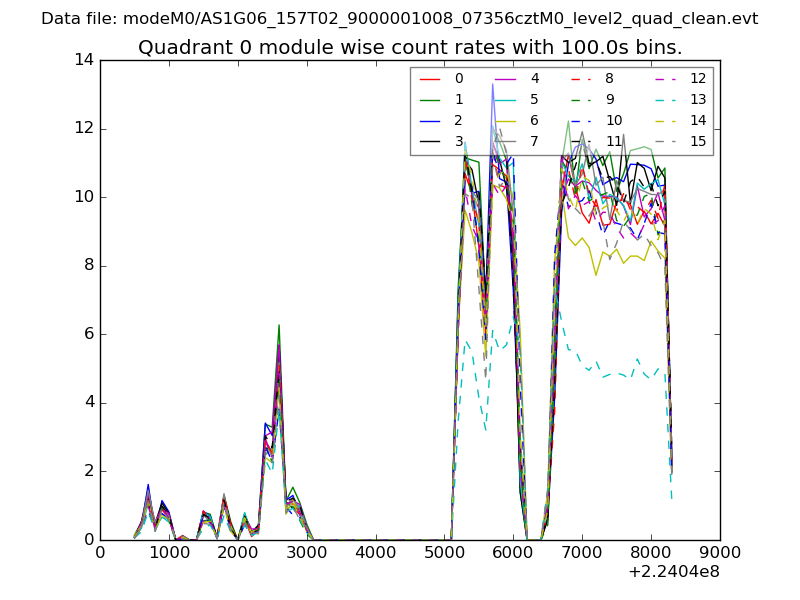
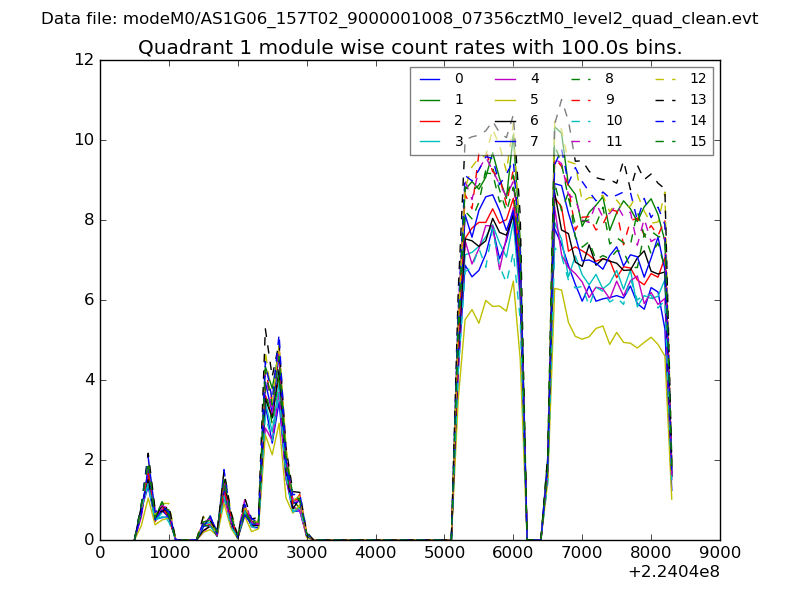
| Module-wise count rates for Quadrant A Data is divided into 100 sec bins |
 |
 |
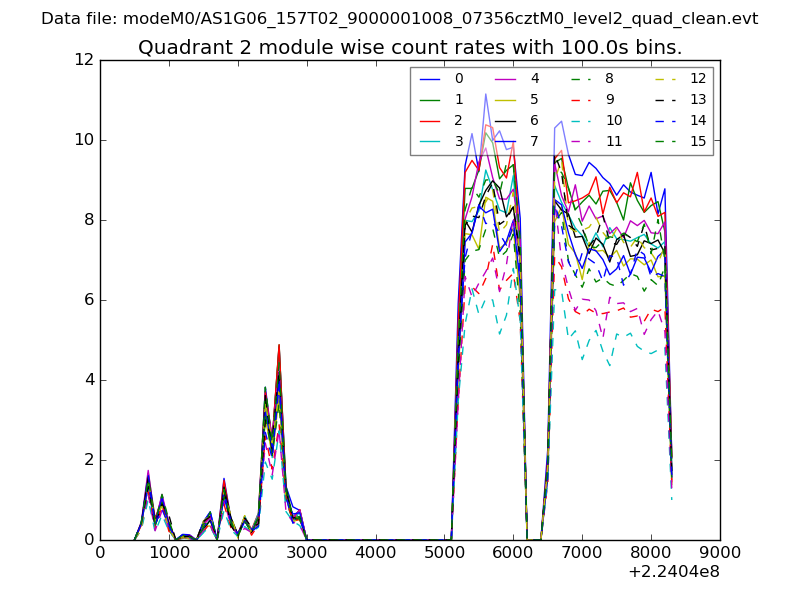
| Module-wise count rates for Quadrant B Data is divided into 100 sec bins |
 |
 |
| Module-wise count rates for Quadrant C Data is divided into 100 sec bins |
 |
 |
| Module-wise count rates for Quadrant D Data is divided into 100 sec bins |
 |
 |
| Parameter | Plot |
|---|---|
| CZT HV Monitor | 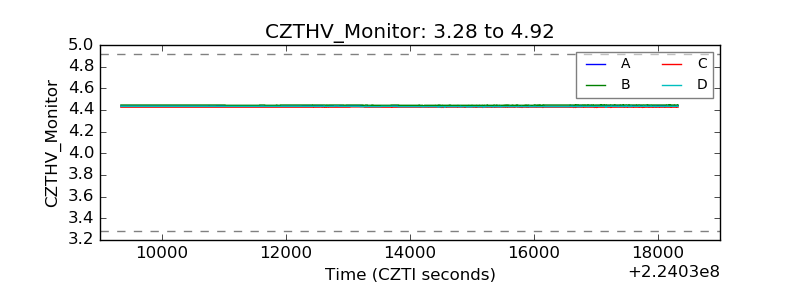 |
| D_VDD |  |
| Temperature 1 | 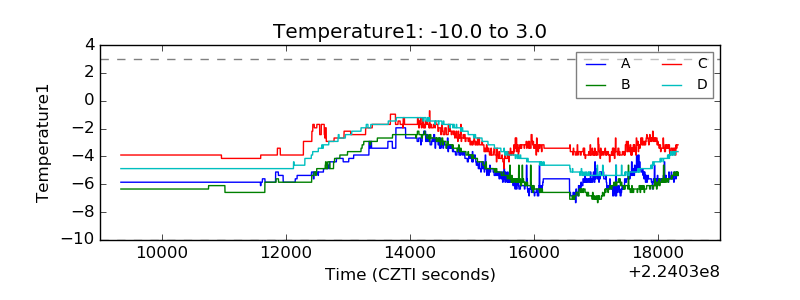 |
| Veto HV Monitor | 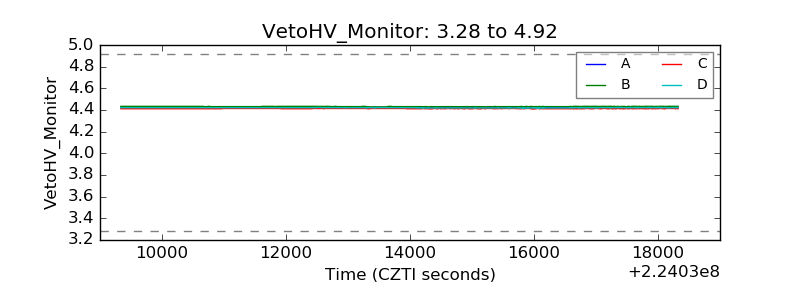 |
| Veto LLD | 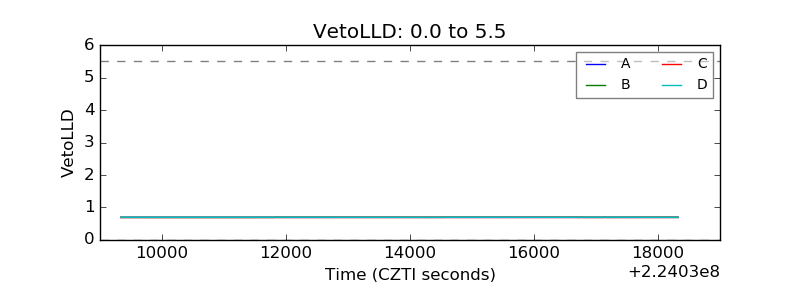 |
| Alpha Counter | 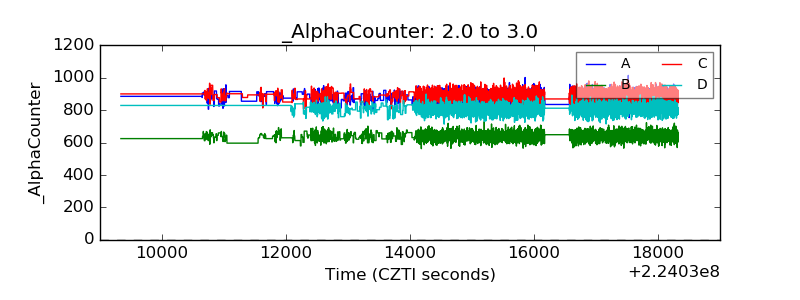 |
| _CPM_Rate | 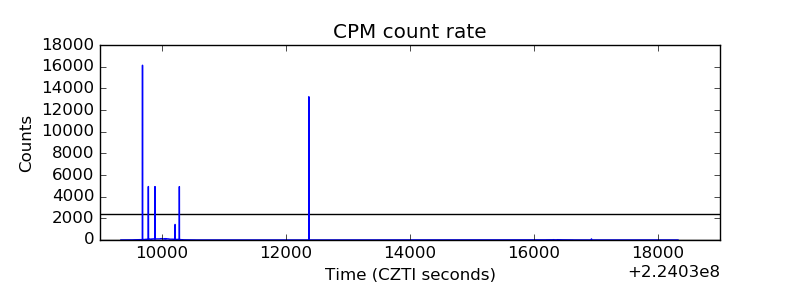 |
| CZT Counter | 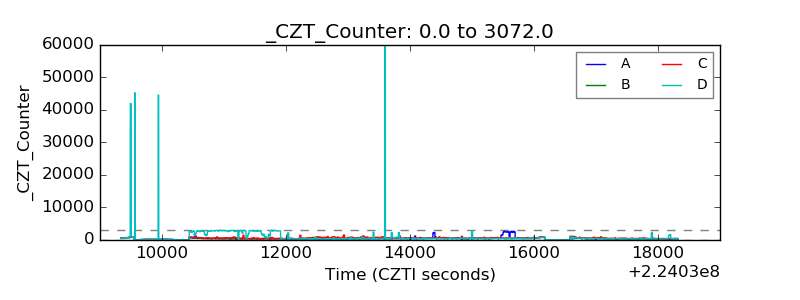 |
| +2.5 Volts monitor |  |
| +5 Volts monitor |  |
| _ROLL_ROT | 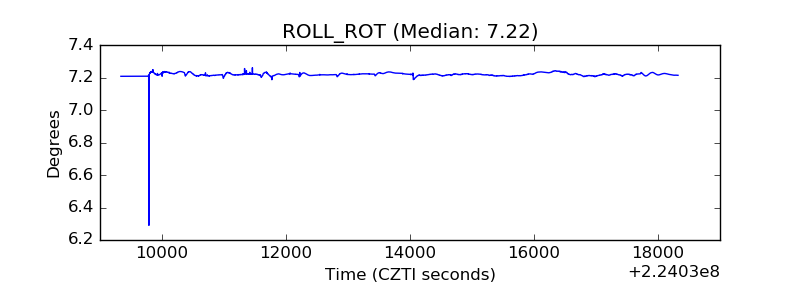 |
| _Roll_DEC | 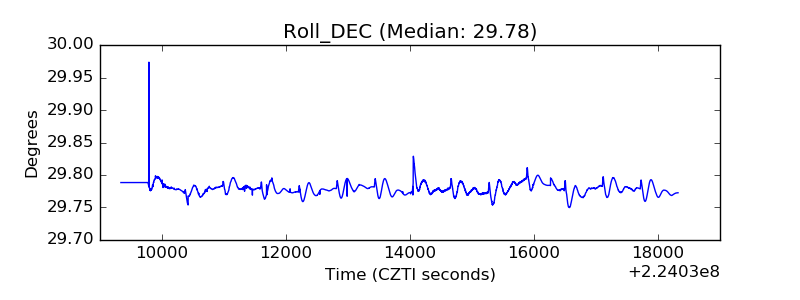 |
| _Roll_RA |  |
| Veto Counter | 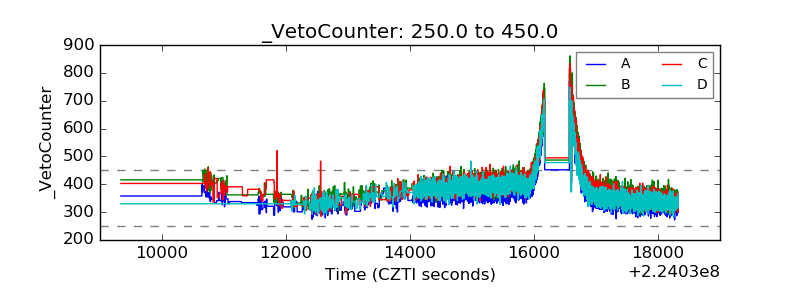 |